I.
Introduction
S
UNT compensation is basically a powerful tool to improve voltage profile and increase the steady state transmittable power. Voltage stability problems are solved by providing sufficient reactive power at the appropriate location, thus improving the voltage profile and reducing power loss [1].There are various kinds of shunt compensation devices and each one has its own characteristic and boundary [2]. The shunt capacitor (C), static var compensator (SVC), and static synchronous compensator (STATCOM) are used to improve the static voltage stability margin and power transfer efficiency. However, the performance of SVC and STACOM is better in terms of reducing power losses and improving voltage profile [3]. To achieve the benefits of loss reduction and voltage profile improvement, engineers are in need to determine the optimal location and size of the shunt compensation devices.
Several techniques have been presented for solving the problem of the optimal capacitor placement in power system such as analytical, numerical programming, heuristic, artificial intelligence-based techniques [4], Combined Optimization Approach [5], Ant-lion optimization (ALO) [6, 7], Analytical Technique [8]-[10], combined algorithm based on Loss Sensitivity Factor and Salp Swarm Algorithm
[11], combined algorithm based on Fuzzy Loss Sensitivity Factor with Sine Cosine Algorithm [12]. The genetic algorithm (GA), simulated annealing (SA), artificial immune system (AIS), Pareto Envelope-based Selection Algorithm II (PESA-II) with fuzzy logic decision maker and particle swarm optimization (PSO) have been used to determine the optimal placement of SVC in power system [13][14]. In [14], global harmony search algorithm (NGHS) has been used to determine the optimal allocation of STATCOM. In addition, different optimization techniques have been used for determining the optimal allocation of D-STATCOM in distribution systems [15]-[21]. However, the determination of optimal allocation of shunt compensation devices is still hot topic and needs more effort to achieve the maximum benefits from installation of these devices in electrical power systems.
This paper uses a new optimization technique, referred to as the Lightning Attachment Procedure Optimization (LAPO), to determine the optimal placement and sizing of shunt Var compensators in power systems. Lightning Attachment Procedure Optimization (LAPO) is a new optimization method that simulates the attachment procedure of lightning. LAPO has robustness, high quality and is able to disband a lot of troubles [4].
Sensitivity analysis has been applied to determine the candidate buses in order to reduce the search space in all buses and the total computation time [22][23].
In this paper, the optimal allocation of such compensation devices in power systems is determined using the developed optimization algorithm. In this algorithm, the candidate buses, which are considered
Voltage Stability Enhancement Based on Optimal
Allocation of Shunt Compensation Devices Using
Lightning Attachment Procedure Optimization
Salah Kamel
1,2*, Heba Youssef
31
Department of Electrical Engineering, Faculty of Engineering, Aswan University, 81542 Aswan (Egypt)
2State Key Laboratory of Power Transmission Equipment & System Security and New Technology,
Chongqing University, 400030 Chongqing (China)
3
Upper Egypt Electricity Distribution Company, Ministry of Electricity, Aswan (Egypt)
Received 19 December 2018 | Accepted 26 July 2019 | Published 30 October 2019
Keywords
Voltage Stability, Shunt Compensation Devices, Optimal Power Flow, Lightning Attachment Procedure Optimization, Sensitivity Indices.
Abstract
This paper proposes a combined approach to determine the optimal allocation of different shunt compensation devices (shunt capacitor, static var compensator, and static synchronous compensator) in power systems. The developed approach is a combination between Lightning Attachment Procedure Optimization (LAPO) and loss sensitivity indices (LSIs). Different objective functions such as enhancement of voltage stability index, improvement of voltage profile and minimization of total power losses are considered. Two loss sensitivity indices (LSIs) are developed to reduce the search space in all buses and the total computation time. The developed algorithm is validated using standard IEEE 14-bus and IEEE 30-bus test systems. The developed algorithm successes to achieve the objective functions with the better performance compared with other well-known optimization techniques such as Teaching learning-based optimization (TLBO), genetic algorithm (GA) and particle swarm optimization (PSO).
* Corresponding author.
E-mail address: [email protected]
the most suitable buses to connect with the compensation devices, are determined based on the loss sensitivity indices (LSIs). This step is necessary for reducing the search space and computation time. Then, LAPO is applied to compute the best size and determine the appropriate kind of shunt compensation devices in power systems. The results are contrasted with modern optimization techniques such as Teaching learning-based optimization (TLBO), genetic algorithm (GA) and particle swarm optimization (PSO) to confirm the applicability of the proposed technique. Two test systems are relied; the IEEE 14-bus and IEEE 30-bus system.
The rest of this paper is organized as follows: Section II presents an overview about the shunt compensation devices. The problem formulation is described in Section III. Section IV presents the sensitivity analysis. The LAPO algorithm is presented in Section V. Section VI presents the numerical results of the developed LAPO approach based on two standard test systems. Finally, the conclusions are presented in Section VII.
II.
Shunt Compensation Devices
The capacitors are the conventional type of compensation devices that are considered relatively inexpensive. The capacitor injects reactive power and is connected in parallel with system buses. Its injected reactive power is proportional to the square of the terminal voltage. Flexible Alternating Current Transmission Systems (FACTS) are the modern type of compensation devices. They are widely used with electric power systems to improve the system loadability, security and maximize exploitation of transmission lines [24][25]. There are different types of FACTS devices such as SVC and STATCOM.
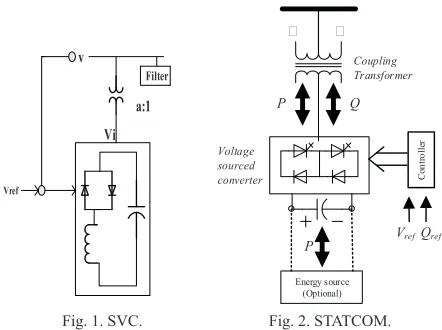
SVC is capable to extend fast acting reactive power reparation in electrical systems. In other meaning, SVCs have their output edit for interchange inductive or capacitive current to control the voltage, power factor, harmonics and stabilizing the system. SVC includes two groups; the first group consists of a fixed capacitor (FC) and a thyristor-controlled reactor (TCR), while the second group consists of a thyristor-switched capacitor (TSC) and TCR [26] [27]. Schematic diagram of SVC is shown in Fig. 1.
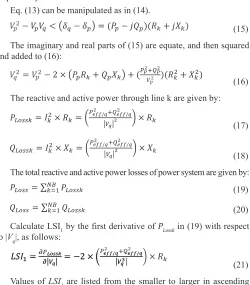
STATCOM is an advanced device that depends on a power electronics voltage source converter (VSC) and it can control the injected reactive power to the system. In addition, it can extend active power when it is connected to a source of power. Schematic diagram of STATCOM is shown in Fig. 2.
Fig. 1. SVC. Fig. 2. STATCOM.
Commercially, shunt compensation devices (capacitor, SVC and STATCOM) have constraints. However, this study has been achieved under injected Q with limit value 50 MVar and the suitable types of shunt compensation devices are given in Table I [14].
TABLE I. Types of Appropriate Shunt Compensation Devices Based on the Injected Reactive Power
Shunt controller Qmin (MVAR) Qmax (MVAR)
Capacitor -10 10
SVC -30 30
STATCOM -50 50
III.
Objective Functions
A. Voltage Profile Refinement
The voltage profile enhancement is the first objective function, which seeks to minimize the voltage deviations of load buses which can be represented as:
(1)
where, NPQ is the number of load buses and Vi is the voltage of load bus i.
B. Voltage Stability Improvement
The System stability is indicated by voltage stability index (Lmax), which varies between 0 to 1. This objective function is given by:
(2) The voltage stability index at bus j is given by (3).
(3) where, Vi is the voltage of ith generator bus and V
j is the voltage of
load bus.
Calculate Fij using Ybus matrix (4) – (6).
(4) where, the complex voltages and currents at the load and generator are VL, VG , IL , IG . Sub-matrices of system Ybus are YLL, YGG, YGL, YLG.
Eq. (4) can be written as in (5) and Fij is given by (6).
(5)
(6)
C. Real Power Losses Diminishing
Minimizing real power losses is the third objective function that is given by:
(7) where, NTL is the number of transmission lines, Gib is the conductance of the transmission ib and δib is phase difference between voltages of buses i, b.
IV.
Constraints
A. Equivalent Constraints
The balanced load flow equations are given by:
(8)
PGi, respectively, the reactive and active load demand at bus i are QDi
and PDi , respectively, the susceptance and conductance between buses b and i are Bib and Gib, respectively.
B. Inequality Constraints
The inequality constraints can be classified as follows:
1. Generated active and reactive powers, generators bus voltages, voltage magnitude of load buses and transformer tap settings which are within minimum and maximum values.
2. Apparent power flow in transmission lines . 3. Compensation MVAR (−50 ≤ Qcomd ≤ 50).
The operating constraints variables of the system must be considered in the objective functions. These variables can be easily limited in optimization solution using the quadratic penalty formulation of the objective functions for all dependent variables; therefore, the generalized objective function can be expressed as follows:
(10) where, hG ,hV , hQ , hS , hF and ht are the penalty factors. These
values are high positive. xlim acts as the limit values of the dependent
variable as:
(11)
V.
Sensitivity Analysis
The loss sensitivity analysis consists of two LSIs to determine the candidate buses for the existence of shunt reparation devices. Consequently, the search space in all the buses, and the simulation time will be reduced. Moreover, places are arranged according to their severity for efficient detecting the candidate load buses. Fig. 3 shows two-bus system connected by a line as a part of a large power system. Buses p and q represent the sending and receiving end buses, respectively.
Fig. 3. Two-bus system.
The reactive and active powers at the node p can be given as: (12)
(13) where, the power passes through line k are Pp and Qp. The total reactive and active load power around bus q are Qeff/q and Peff/q , respectively. The reactive and active power losses through line k are
QLossk and PLossk , respectively.
The current passing through line k from point p to point q is given as:
(14) where, the voltage magnitudes at point p and q are Vp and
Vq, respectively, the voltage angles at point p and q are δp and δq,
respectively, the reactance and resistance of line k are Xk and Rk
respectively.
Eq. (13) can be manipulated as in (14).
(15) The imaginary and real parts of (15) are equate, and then squared and added to (16):
(16) The reactive and active power through line k are given by:
(17)
(18) The total reactive and active power losses of power system are given by: (19)
(20) Calculate LSI1 by the first derivative of PLossk in (19) with respect to |Vq|, as follows:
(21) Values of LSI1 are listed from the smaller to larger in ascending order. The optimal buses to locate the shunt compensation devices are the highest negative values in the LSI1.
Calculate LSI2 by the first derivative of PLossk in (19) with respect
to Qeff/q as follows:
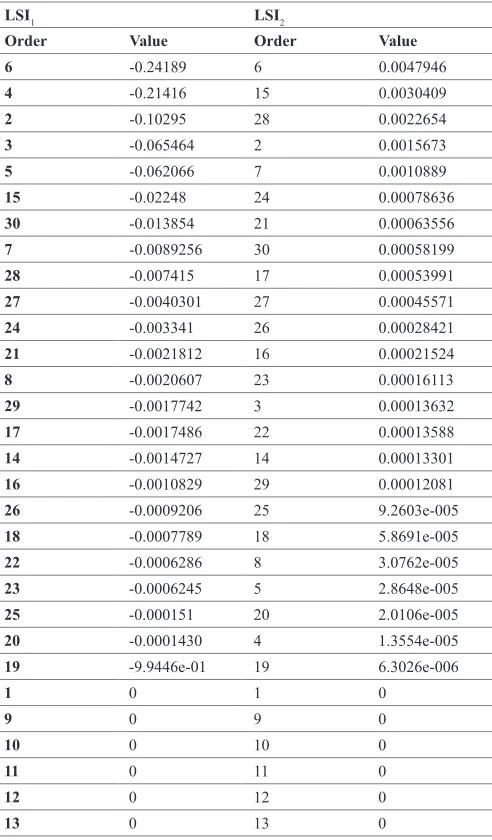
(22) Values of LSI2 are listed from the larger to smaller in descending order. The optimum buses to locate the shunt compensation devices are those with the highest positive values in the LSI2. The optimum buses where the shunt compensation devices will be located are acquired from the top two lists by means of merger or union. The buses selection is approximately half of the total number of system buses (50% to 55%).
VI.
Lighting Attachment Procedure Optimization
(LAPO)
The Lightning Attachment Procedure Optimization (LAPO)
[4][28], is inspired by the nature of lightning attachment operation which contains the movement of the falling leader, spread of the rising leader, and the feature of lightning. Ultimate better result would be the lightning hit point. The suggestion method is free from any parameter setting and it is seldom stuck in the local best points.
A. Serious Phases of LAPO
1. Air Collapse on Cloud Surface
Fig. 4. Distribution of the charge in the cloud.
2. The Fall of Lighting Channel
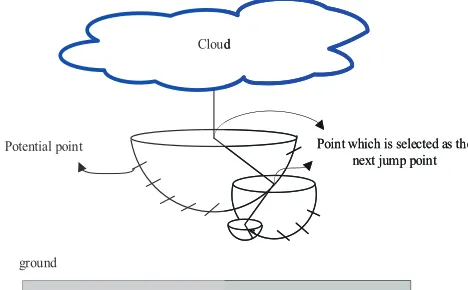
In the cloud’s edge air breakdown occurs, the lightning oncoming the earth in a stepwise motion. After each step, the lightning pauses, then shift to one or more other directions across the earth. With a view to know this operation, after each step, a hemisphere is seen beneath the leader tip with the center of leader tip and the radius of next step length (see Fig. 5) [4][28]. There are more than one potential points on the face of this hemisphere, there are many of potential points which could be chosen as the next jump spot. The following jump spot is chosen randomly; yet, a spot with large value of electrical field between the line connecting the leader tip and the identical spot is more possible to be considered as the following jump.
Fig. 5. The downward leader ‘s procedure of the gradient movement.
3. Section Fading
There are a lot of spots for the following jump of lightning, the charge of the top branch is classified into new branches. the new branches are created by the same steps. No air break-down happens when the charges of branch decrease more than a stringent value (1 μC) and the result is that no movement occurs. Thus, this branch would vanish as shown in Fig. 6.
4. Leader of the Rising
Existence of cloud implies existence of a large negative charge over the earth. This results in collecting of positive charges on the ground surface or earthed object beneath the cloud. In the heavy points, the high electric field produces air breakdown; thus, the heavy points start upward leader and spread through the air (see Fig. 7). As the downward leader is oncoming the ground, the upward leaders go across the downward leader quickly.
5. Ultimate Leaping
The ultimate jump happens when upward leader arrives to downward
leader wand, the striking point would be the point from which the upward leader has started. In this situation, all the other branches disappear and charge of the cloud is naturalized through this channel.
Fig. 6. Formation of the upward leader and diffusion through the downward
leader.
B. Mathematical Steps of LAPO Algorithm
Firststep: Trail spot
Generated initial trail spots are placed at the cloud and earth edge. Several of these trail spots are the emitted lightning points, and some of them are the spot from which the upward leaders start. The trail spot is calculated by
(23) Where Ymin and Ymax are minimal and maximum bound of
variables, and rand is random variable in the range (0,1). The fitness function is evaluated depending on the objective function
(24)
Second step: jump definition
The average of all trail spots and the fitness function according to trail spot’s averages are calculated by Eqs:
(25)
(26) There are many potential spots for a test point, which the lightning can pass. Since the lightning was a random action, for test point i, a random point p is chosen between the population (i /= p). If the fitness of the point p is greater than that of the average value, the lightning leaps across this point, otherwise, the lightning shifts to another direction. And are given by
(27) If average fitness of point p is lower than the fitness point
(28)
If average fitness of point p is higher than the fitness point.
Third Step: Section Fading
If the fitness function is higher than the prior point, the branch maintains; else, it fades, and are given by:
(29)
This operation is executed for all the test points. In other words, in the first stage, all the remaining points are treated to shift down.
Cloud Leader connecting line to the point with higher electric field than average electric field
Leader connecting line to the point with lower electric field than average electric field
Field branches
Fig. 7. Determine the next jump and determine the lightning path.
Fourth Step: Leader of the Rising
As explained in the prior steps, all the test points are treated as the downward leader and shifted down. In the second stage, all the test points are treated as the upward leader and moved above. The upward leader motion depends on the charge of the channels which is essentially spread exponentially, and is given by:
(31) where the number of iterations is j, the maximum number of iterations is jmax , and next jump is s, which depends on the charge of the channel and the next point is given by:
(32) Where Ymin and Ymax are the best and the worse solutions of the population.
Final Steps: Ultimate Leaping
The lightning operation pauses when the up leader and the down leader are gathering each other.
VII.
Simulation Results
A. Validation Strategy & Used Parameters
The developed optimization technique is validated using two standard IEEE systems (IEEE 14-bus and IEEE 30-bus) with three various objective functions. The systems data are given in [29]. Three case studies are discussed for each system; (i) Case 1: One compensation device, (ii) Case 2: Two compensation devices, and (iii) Case 3: Three compensation devices.
The parameters of LAPO are population size = 20 and maximum number of iterations = 200. The parameters of TLBO are population specified size = 20 and maximum number of iterations = 200. The parameters of PSO are population size = 20, maximum iterations = 200, C1 =1.05, C2 = 1.1, ωmax = 1 and ωmin = 0.3 [30]. The penalty factors are specified to be 100. The simulations are executed for 40 trials and the optimum results are given below.
B. Obtained Results
Table II and Table III present the obtained LSIs for IEEE 14-bus and IEEE 30-bus systems, respectively. The candidate buses that have high opportunity for connecting with shunt compensation devices is at the beginning of LSIs table and vice versa for the buses located at the end of LSIs table. The candidate buses are 2,3,4,5,11,12,13 and 14 for IEEE 14-bus and 2,3,4,5,6,7,15,16,17,21,24,26,27,28 and 30 for IEEE 30-bus.
TABLE II. Order of Load Buses Depending on LSIS (IEEE 14-Bus Test System)
LSI1 LSI2
Order Value Order Value
2 -0.085021 5 0.010309
5 -0.083808 13 0.0035644
3 -0.049055 14 0.0015991
4 -0.025891 2 0.001478
13 -0.022128 4 0.00026831
14 -0.013788 12 0.00014508
12 0.0014145- 11 0.0001217
11 0.00049929 - 3 0.00011671
10 0.00022395 10 8.1518e-005
1 0 1 0
6 0 6 0
7 0 7 0
8 0 8 0
9 0 9 0
TABLE III. Arrangement of Load Buses Depending on LSIS for IEEE 30-Bus Test System
LSI1 LSI2
Order Value Order Value
6 -0.24189 6 0.0047946
4 -0.21416 15 0.0030409
2 -0.10295 28 0.0022654
3 -0.065464 2 0.0015673
5 -0.062066 7 0.0010889
15 -0.02248 24 0.00078636
30 -0.013854 21 0.00063556
7 -0.0089256 30 0.00058199
28 -0.007415 17 0.00053991
27 -0.0040301 27 0.00045571
24 -0.003341 26 0.00028421
21 -0.0021812 16 0.00021524
8 -0.0020607 23 0.00016113
29 -0.0017742 3 0.00013632
17 -0.0017486 22 0.00013588
14 -0.0014727 14 0.00013301
16 -0.0010829 29 0.00012081
26 -0.0009206 25 9.2603e-005
18 -0.0007789 18 5.8691e-005
22 -0.0006286 8 3.0762e-005
23 -0.0006245 5 2.8648e-005
25 -0.000151 20 2.0106e-005
20 -0.0001430 4 1.3554e-005
19 -9.9446e-01 19 6.3026e-006
1 0 1 0
9 0 9 0
10 0 10 0
11 0 11 0
12 0 12 0
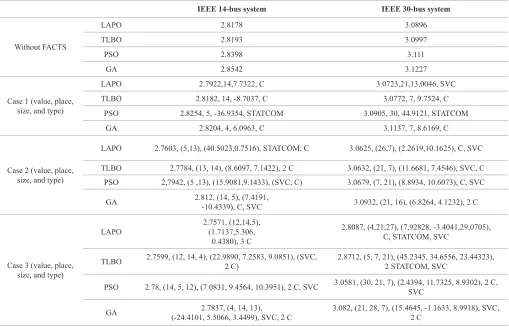
The results obtained with LAPO are compared with those obtained by other optimization techniques. Tables IV, V and VI present the results for VSI, voltage deviation and real power losses, respectively. From these tables, it can be observed that in case of not using FACTS, the maximum voltage stability index (Lmax) is 0.0669 p.u, voltage
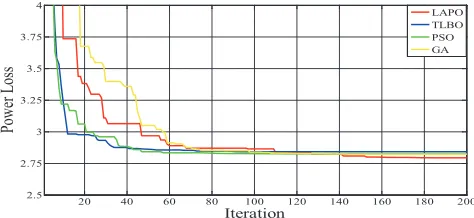
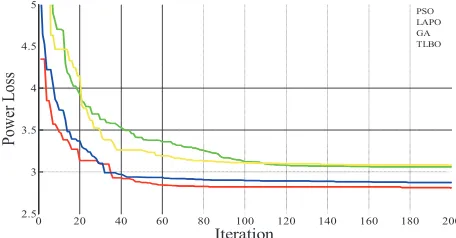
deviation is 0.0272 p.u and active power losses is 2.8178 MW, while the maximum voltage stability index after determining the optimal allocation of different shunt compensation devices decreases from 0.0669 p.u to 0.0645 p.u, voltage deviation decreases from 0.0272 p.u to 0.0068 p.u, and active power losses decreases from 2.8178 MW to 2.7571 MW for IEEE 14-bus and IEEE 30-bus, in case of not using FACTS, the maximum voltage stability index (Lmax) is 0.1240 p.u, voltage deviation is 0.0866 p.u and active power losses is 3.0896 MW, while the maximum voltage stability index after determining the optimal allocation of different shunt compensation devices decreases from 0.1240 p.u to 0.0923 p.u, voltage deviation decreases from 0.0866 p.u to 0.0643 p.u, and active power losses decreases from 3.0896 MW to 2.8087 MW. Fig. 8 gives convergence characteristics of various optimization methods for VSI without compensation devices of IEEE 14-bus system. Fig. 9 shows the convergence characteristics of various optimization methods for power losses with one shunt compensation devices of IEEE 14-bus system. From this figure, it can be observed that the performance of developed algorithm is competing with other optimization techniques, while TLBO is considered the faster one. Fig. 10 gives the convergence characteristics of various optimization methods for power losses without shunt compensation devices of IEEE 30-bus system. From this figure, it can be observed that the performance of LAPO is competing with other optimization techniques, while GA is considered the worst one. Fig. 11 gives the convergence characteristics of various optimization methods for VSI with two shunt compensation devices of IEEE 30-bus system. It can be observed that the TLBO is the faster one compared with other optimization techniques. Fig. 12 gives convergence characteristics of various optimization methods for VSI with three shunt compensation devices of IEEE 30-bus system. Fig. 13 shows convergence characteristics of various optimization methods for VDD with three shunt compensation devices of IEEE 30-bus system. Fig. 14 gives convergence characteristics of various optimization methods for power losses with three shunt compensation devices of IEEE 30-bus system. Fig. 15 gives convergence characteristics for power losses using LAPO of IEEE 30-bus system. Fig.16 gives convergence characteristics for VSI using LAPO of IEEE 30-bus system. From Fig. 12 and Fig. 13, it can be observed that the performance of the developed algorithm is competing with other optimization techniques.
C. Outstanding Features of Developed Algorithm
The results obtained by LAPO are comparable with those obtained by the well-known optimization techniques. This verifies the applicability of LAPO for power system studies as it gives a minimum objective function compared with TLBO, PSO and GA techniques.
Fig. 8. Convergence characteristics of various optimization methods for VSI without compensation devices of IEEE 14-bus system.
Fig. 9. Convergence characteristics of various optimization methods for power losses with one shunt compensation devices of IEEE 14-bus system.
Fig. 10. Convergence characteristics of various optimization methods for power losses without shunt compensation devices of IEEE 30-bus system.
Fig. 11. Convergence characteristics of various optimization methods for VSI with two shunt compensation devices of IEEE 30-bus system.
Fig. 13. Convergence characteristics of various optimization methods for VDD with three shunt compensation devices of IEEE 30-bus system.
Fig. 14. Convergence characteristics of various optimization methods for power losses with three shunt compensation devices of IEEE 30-bus system.
Fig. 15. Convergence characteristics for power losses using LAPO of IEEE 30-bus system.
Fig. 16. Convergence characteristics for VSI using LAPO of IEEE 30-bus system.
TABLE IV. VSI, Optimal Placement, Size in MVAR and Suitable Type of Shunt Compensation Devices
IEEE 14-bus system IEEE 30-bus system
Without FACTS
LAPO 0.0669 0.1240
TLBO 0.0712 0.12434
PSO 0.0713 0.1253
GA 0.0715 0.1257
Case 1 (value, place, size, and type)
LAPO 0.0656,14,38.3232, STATCOM ,21, 50, STATCOM 0.1173
TLBO 0.06631, 4, 49.97, STATCOM 0.118, 21, 49.7337, STATCOM
PSO 0.0703, 5, 33.45, STATCOM 0.125, 7, 22.8768, SVC
GA 0.0708, 5, 49.8751, STATCOM 0.1216, 21, 23.8204, SVC
LAPO 0.0648, (13,14),(-50,45.4927),
2 STATCOM
0.1073, (7,27), (9.1307, 44.8712), C, STATCOM
Case 2 (value, place, size, and type)
TLBO 0.0663, (4, 5), (-16.5310, 49.9692), SVC, STATCOM 0.11312, (30, 27), (-16.7354, 50), SVC, STATCOM
PSO 0.0701, (5, 4), (49.9997, 23.721), STATCOM, SVC 0.1168, (21,15), (42.7866, 38.4338),2 STATCOM
GA 0.0664, (4, 5), (27.8177, 28.1106),2 SVC 0.12001, (7, 17), (-41.2411, 46.7745),2 STATCOM
Case 3 (value, place, size, and type)
LAPO (-6.2314,45.0123, -50),0.0645, (4,14,12),
C, 2 STATCOM
0.0923, (15,21,30),(35.1034,22.5432,39.1089) 2 STATCOM, SVC
TLBO 0.0655, (5, 4, 5), (30.1891, -46.0102, 43.9262), 3 STATCOM 0.1112, (17, 21, 15), (26.174, 50.0, 35.377),SVC, 2 STATCOM
PSO 0.0697, (4, 5, 4), (33.5932, 43.629, 30.7922), 3 STATCOM 0.1161, (21, 7, 3), (33.6635, 49.9984, 34.6893), 3 STATCOM
GA (-24.9, 30.92, -16.123),0.0662, (4, 14, 4),
2 SVC, STATCOM
TABLE V. Voltage Deviation in PU, Optimal Placement, Size in MVAR and Suitable Type of Shunt Compensation Devices
IEEE 14-bus system IEEE 30-bus system
Without FACTS
LAPO 0.0272 0.0866
TLBO 0.03211 0.088319
PSO 0.0327 0.0907
GA 0.03286 0.095745
Case 1 (value, place, size, and type)
LAPO 0.0148, 14, 12.2541, SVC 0.0783,17,4.6421, C
TLBO 0.0300, 14, -42.3003, STATCOM 0.086812, 15, 17.5913, SVC
PSO 0.0324, 5, 43.4456, STATCOM 0.089608, 21, 24.3424, SVC
GA 0.0328, 4, -8.8882, C 0.0943,21, -41.2308, STATCOM
Case 2 (value, place, size, and type)
LAPO 0.0079, (14,12), (12.6500.-1.7732), SVC, C 0.0779, (20,15), (5.6523,14.8365), C, SVC
TLBO 0.0081, (14, 5), (13.0869, 15.3602), 2 SVC (-14.0, 15.92), 2 SVC0.083624, (3, 24),
PSO 0.0083, (14, 4), (13.0757,15.0135), 2 SVC 0.0848, (21, 15), (4.6344, 16.8076), C, SVC
GA 0.0183, (12, 14), (-23.9822, 11.6879), 2 SVC 0.092047, (24, 15), (10.8060, 1.2003), SVC, C
Case 3 (value, place, size, and type)
LAPO 0.0068, (4,5,14), (9.4621,7.0088,13.016), 2 C, SVC 0.0643, (15,26,30), (-3.9316,4.8339,5.1494), 3C
TLBO 0.00794, (5, 14, 12), (16.2095, 13.0638,22.1965), 3 SVC 0.0813, (4, 24, 15), (14.9389, 8.2276, 26.0513), 2 SVC, C
PSO 0.0080, (14, 12, 5), (12.9847, 24.5797, 0.6175), 2 SVC, C 0.0843, (21, 7, 15), (7.3001, 19.8402, 12.6049), C, 2 SVC
GA 0.0111, (14, 5, 4), (12.03, -36.644, 17.7964),2 SVC, STATCOM 0.091, (30, 24, 7), (30, 4.8605, -49.9498),STATCOM, C
TABLE VI. Power Losses in MW, Optimal Placement, Size in MVAR and Suitable Type of Shunt Compensation Devices
IEEE 14-bus system IEEE 30-bus system
Without FACTS
LAPO 2.8178 3.0896
TLBO 2.8193 3.0997
PSO 2.8398 3.111
GA 2.8542 3.1227
Case 1 (value, place, size, and type)
LAPO 2.7922,14,7.7322, C 3.0723,21,13,0046, SVC
TLBO 2.8182, 14, -8.7037, C 3.0772, 7, 9.7524, C
PSO 2.8254, 5, -36.9354, STATCOM 3.0905, 30, 44.9121, STATCOM
GA 2.8204, 4, 6.0963, C 3.1137, 7, 8.6169, C
Case 2 (value, place, size, and type)
LAPO 2.7603, (5,13), (40.5023,0.7516), STATCOM, C 3.0625, (26,7), (2.2619,10.1625), C, SVC
TLBO 2.7784, (13, 14), (8.6097, 7.1422), 2 C 3.0632, (21, 7), (11.6681, 7.4546), SVC, C
PSO 2,7942, (5 ,13), (15.9081,9.1433), (SVC, C) 3.0679, (7, 21), (8.8934, 10.6073), C, SVC
GA 2.812, (14, 5), (7.4191,-10.4339), C, SVC 3.0932, (21, 16), (6.8264, 4.1232), 2 C
Case 3 (value, place, size, and type)
LAPO 2.7571, (12,14,5),(1.7137,5.306,
0.4380), 3 C
2.8087, (4,21,27), (7,92828, -3.4041,29,0705), C, STATCOM, SVC
TLBO 2.7599, (12, 14, 4), (22.9890, 7.2583, 9.0851), (SVC, 2 C) 2.8712, (5, 7, 21), (45.2345, 34.6556, 23.44323),2 STATCOM, SVC
PSO 2.78, (14, 5, 12), (7.0831, 9.4564, 10.3951), 2 C, SVC 3.0581, (30, 21, 7), (2.4394, 11.7325, 8.9302), 2 C, SVC
VIII.
Conclusion
In this paper, a new hybrid optimization technique based on LAPO and loss sensitivity indices has been proposed to determine the optimal allocation of different shunt compensation devices in power systems. Two LSIs have been developed to determine the candidate locations for the existence of shunt compensation devices in order to decrease the search time in all buses and accelerate the convergence. The proposed optimization technique has been used to achieve different objective functions; voltage stability index, improvement of voltage profile and minimization of total power losses. IEEE 14-bus and IEEE 30-bus test systems have been used to verify the optimization algorithm. The results of the proposed algorithm have been compared with those obtained by other well-known optimization techniques such as TLBO, PSO and GA. The obtained results proved the capability of the proposed algorithm to effectively determine the optimal allocation of such compensation devices and achieve different objective functions during fast computation time. Other compensation devices such as; UPFC, IPFC and CUPFC have not been studied using the developed technique which maybe faces some challenges with them, as they are more complex devices. Hence, the future work will be focused to solve this issue.
Acknowledgment
The authors gratefully acknowledge the contribution of the NSFC (China)-ASRT (Egypt) Joint Research Fund, Project No. 51861145406 for providing partial research funding to the work reported in this research.
References
[1] F. Dincer, “The analysis on wind energy electricity generation status,
potential and policies in the world” Renewable and sustainable energy reviews 15.9 (2011): 5135-5142.
[2] P. Pourbeik, P. S. Kundur, and C. W. Taylor, “The anatomy of a power
grid blackout-Root causes and dynamics of recent major blackouts” IEEE Power and Energy Magazine 4.5 (2006): 22-29.
[3] A. Sode-Yome, and N. Mithulananthan, “Comparison of shunt capacitor,
SVC and STATCOM in static voltage stability margin enhancement” International Journal of Electrical Engineering Education 41.2 (2004): 158-171.
[4] A. Foroughi Nematollahi, A. Rahiminejad, and B. Vahidi, “A novel
physical based meta-heuristic optimization method known as Lightning Attachment Procedure Optimization” Applied Soft Computing 59 (2017): 596-621.
[5] A. Youssef, S. Kamel, M. Ebeed, and J. Yu, “Optimal Capacitor Allocation in Radial Distribution Networks Using a Combined Optimization Approach” Electric Power Components and Systems 46.19-20 (2018): 2084-2102.
[6] C. G. Boktor, A. Youssef, A. H. Ali, and S. Kamel, “Optimal Distribution Power Flow Including Shunt Capacitor Allocation Based on Voltage Deviation and Power Loss minimization” IEEE Nineteenth International Middle East Power System conference (MEPCON 2017), Cairo, Egypt, December 19-21, 2017.
[7] T. George, A. Youssef, M. Ebeed, and S. Kamel, “Ant Lion Optimization
Technique for Optimal Capacitor Placement Based on Total Cost and Power Loss Minimization” IEEE International Conference on Innovative Trends in Computer Engineering (ITCE 2018), Aswan, Egypt, February 19-21, 2018.
[8] A. A. Mohamed, S. Kamel, and M. M. Aly, “A Simple Analytical
Technique for Optimal Capacitor Placement in Radial Distribution Systems” IEEE Nineteenth International Middle East Power System conference (MEPCON 2017), Cairo, Egypt, December 19-21, 2017.
[9] S. Kamel, W. Hamdy, S. Abd-elgwad, A. Selim, and F. Jurado
“Development of Probabilistic Power Flow Algorithm for Radial Distribution Systems with Capacitors Using Analytical Approach” IEEE
10th International Renewable Energy Congress (IREC 2019), Sousse-Tunisia, March 26-28, 2019.
[10] S. Kamel, M. Mohamed, A. Selim, L. Nasrat, and F. Jurado “Power System Voltage Stability Based on Optimal Size and Location of Shunt Capacitor Using Analytical Technique” IEEE 10th International Renewable Energy Congress (IREC 2019), Sousse-Tunisia, March 26-28, 2019.
[11] A. Selim, S. Kamel, F. Jurado, and S. Marrouchi “Power and Energy Cost Losses Minimization Using Optimal Capacitor Placement in Distribution Networks” IEEE 10th International Renewable Energy Congress (IREC 2019), Sousse-Tunisia, March 26-28, 2019.
[12] S. Kamel, A. Selim, F. Jurado, J. Yu, K. Xie and T. Wu “Capacitor Allocation in Distribution Systems Using Fuzzy Loss Sensitivity Factor with Sine Cosine Algorithm” 2019 IEEE PES Innovative Smart Grid Technologies Asia (ISGT ASIA 2019), Chengdu, China, May 21-24, 2019.
[13] W. Ahmed, A. Selim, S. Kamel, J. Yu, and F. Jurado, “Probabilistic Load Flow Solution Considering Optimal Allocation of SVC in Radial Distribution System” International Journal of Interactive Multimedia and Artificial Intelligence 5.3 (2018): 152-161.
[14] R. Sirjani, A. Mohamed and H. Shareef, “Optimal allocation of shunt Var compensators in power systems using a novel global harmony search algorithm” International Journal of Electrical Power & Energy Systems 43.1 (2012): 562-572.
[15] S. Kamel, A. Ramadan, M. Ebeed, J. Yu, K. Xie and T. Wu “Assessment Integration of Wind-based DG and DSTATCOM in Egyptian Distribution Grid Considering Load Demand Uncertainty” 2019 IEEE PES Innovative Smart Grid Technologies Asia (ISGT ASIA 2019), Chengdu, China, May 21-24, 2019.
[16] M. Abdel-Nasser, K. Mahmoud, and H. Kashef, “A Novel Smart Grid State Estimation Method Based on Neural Networks” International Journal of
Interactive Multimedia and Artificial Intelligence 5.1 (2018): 92-100.
[17] A. Amin, S. Kamel, and J. Yu, “Developed Analytical Technique for Optimal Placement and Sizing of DG and DSTATCOM in Radial Distribution Systems” IEEE Twentieth International Middle East Power System conference (MEPCON 2018), Cairo, Egypt, December 18-20, 2018.
[18] M. Ebeed, S. Kamel, and H. Youssef, “Optimal Setting of STATCOM Based on Voltage Stability Improvement and Power Loss Minimization Using Moth-flame Algorithm” IEEE Eighteenth International Middle East Power Systems Conference (MEPCON 2016), Cairo (Egypt), December 27-29, 2016.
[19] M. A. Taher, S. Kamel, F. Jurado, and A. Ahmed “Optimal Allocation of STATCOM for Voltage Stability and System Loadability” IEEE Twentieth International Middle East Power System conference (MEPCON 2018), Cairo, Egypt, December 18-20, 2018.
[20] A. Selim, S. Kamel, and F. Jurado, “Hybrid Optimization Technique for Optimal Allocation of DG and D-STATCOM in Distribution Networks” IEEE Twentieth International Middle East Power System conference (MEPCON 2018), Cairo, Egypt, December 18-20, 2018.
[21] M. Ebeed, S. Kamel, and A. Youssef, “Optimal Integration of D-STATCOM in RDS by a Novel Optimization Technique” IEEE Twentieth International Middle East Power System conference (MEPCON 2018), Cairo, Egypt, December 18-20, 2018.
[22] B. V. Rao, and G. V. Nagesh Kumar, “Sensitivity Analysis based Optimal Location and Tuning of Static VAR Compensator using Firefly Algorithm” Indian Journal of Science and Technology 7.8 (2014): 1201-10.
[23] A. A. Abou El-Ela, R. A. El-Sehiemy, A. Kinawy and M. T. Mouwafi, “Optimal capacitor placement in distribution systems for power loss reduction and voltage profile improvement” IET Generation, Transmission & Distribution 10.5 (2016): 1209-1221.
[24] Y-H. Song and A. Johns, “Flexible ac transmission systems (FACTS)” IEE power and energy series, London: Institution of Electrical Engineers, 1999.
[25] N. G. Hingorani and L. Gyugyi, “Understanding FACTS: concepts and technology of flexible AC transmission systems” IEEE Electrical Insulation Magazine, Wiley-IEEE press, 2000.
[26] S. Kamel, F. Jurado, and J. P. Lopes, “Comparison of various UPFC models for power flow control” Electric power systems research 121 (2015): 243-251.
Heba Youssef
Heba youssef received the B.Eng. from the Faculty of Engineering, South Valley University, Egypt in 2011. She is currently pursuing his MSc degree in Department of Electrical Engineering, Aswan Faculty of Engineering, Aswan University. Her research activities include Power system modeling, analysis, and optimization.
Salah Kamel
Salah Kamel received the international Ph.D. degree from University of Jaen, Spain (Main) and Aalborg University, Denmark (Host) in Jan. 2014. He is an Assistant Professor in the Electrical Engineering Department, Aswan University. Also, He is a Leader for a power systems research group in the Advanced Power Systems Research Laboratory (APSR Lab), Aswan, Egypt. He is currently a Postdoctoral Research Fellow in State Key Laboratory of Power Transmission Equipment and System Security and New Technology, School of Electrical Engineering, Chongqing University, Chongqing, China. His research activities include power system modeling, analysis and simulation, and applications of power electronics to power systems and power quality.
Transmission & Distribution 10.9 (2016): 2177-2184.
[28] A. Foroughi Nematollahi, A. Rahiminejad, and B. Vahidi, “A novel multi-objective optimization algorithm based on Lightning Attachment Procedure Optimization algorithm” Applied Soft Computing 75 (2019): 404-427.
[29] Power systems test case archive. University of Washington, Seattle, Online: http://www.ee.washington.edu/research/pstca/