R E S E A R C H
Open Access
Detection and classification of peaks in 5
’
cap
RNA sequencing data
Dario Strbenac, Nicola J Armstrong, Jean YH Yang
*From
Asia Pacific Bioinformatics Network (APBioNet) Twelfth International Conference on Bioinformatics
(InCoB2013)
Taicang, China. 20-22 September 2013
Abstract
Background:The large-scale sequencing of 5’ cap enriched cDNA promises to reveal the diversity of transcription initiation across entire genomes. The process of transcription is noisy, and there is often no single, exact start site. This creates the need for a fast and simple method of identifying transcription start peaks based on this type of data. Due to both biological and technical noise, many of the peaks seen are not real transcription initiation events. Classification of the observed peaks is an essential filtering step in the discovery of genuine initiation locations.
Results:We develop a two-stage approach consisting of a fast and simple algorithm based on a sliding window with Poisson null distribution for detecting the genomic locations of peaks, followed by a linear support vector machine classifier to distinguish between peaks which represent the initiation of transcription and peaks that do not. Comparison of classification performance to the best existing method based on whole genome segmentation showed comparable precision and improved recall. Internal features, which are intrinsic to the data and require no further experiments, had high precision and recall rates. Addition of pooled external data or matched RNA sequencing data resulted in gains of recall with equivalent precision.
Conclusions:The Poisson sliding window model is an effective and fast way of taking the peak neighbourhood
into account, and finding statistically significant peaks over a range of transcript expression values. It is orders of magnitude faster than doing whole genome segmentation. The support vector classification scheme has better precision and recall than existing methods. Integrating additional datasets is shown to provide minor gains in recall, in comparison to using only the cap-sequencing data.
Background
The locations of transcription start sites (TSSs) in the gen-ome are of biological importance. Transcription factor binding sites (TFBS) are generally located within close proximity to annotated TSSs and are thought to regulate the packing of nucleosomes [1]. There is rarely only a single TSS for a particular transcript [2]. We refer to clusters of TSS for a single transcript as TSS regions. Nucleosome positioning determines the accessibility of the transcription start region to RNA Pol II. Knowing the locations of the TSS regions reduces the genomic regions in which to search for regulatory motifs and generate
hypotheses about the cause of changes in gene expression. For example, thePrkd2promoter contains aGabpbinding site. When there is a loss of Gabp, Prkd2expression is much reduced, and can lead to the development of chronic myelogenous leukemia [3]. Correct usage of alternative TSSs is also important for healthy development of the nervous system [4]. This highlights the importance of transcription start detection to human health.
Cap-analysis gene expression sequencing (CAGE-seq) is a high throughput sequencing technology that provides millions of short reads per biological sample, representing the variety of transcription initiation and recapping locations in a cell type [5]. Briefly, the RNA is reverse
* Correspondence: [email protected]
School of Mathematics and Statistics, University of Sydney, NSW, Australia
transcribed into a single strand of cDNA. Biotin is added onto both ends of the newly synthesised molecule. Only the 5’end biotin label is captured with streptavidin on magnetic beads. The single stranded cDNA is then released and sequenced. Due to its cost, CAGE-seq has been mostly performed by the FANTOM consortium, one of whom invented the technique [6,7]. CAGE-seq is, how-ever, becoming more widely used [8].
The CAGE reads typically represent the first thirty bases next to the 5’cap site, which is bound to the first RNA base of a transcript. The sequence of the read is mapped to a reference genome, to determine its location. Because CAGE reads are not supposed to be spliced, any general-purpose short-read mapping algorithm, such as Bowtie [9], could be used. Once the location is determined, only the first base is considered in further analyses. Even for well-characterised transcripts, there is a spread of posi-tions which have first base signals, and need to be grouped into units of peaks.
One caveat of CAGE-seq recently discovered is that it also enriches for recapped RNA, which means that regions are detected where there is no transcription initiation [10,11]. The startling overlap between CAGE reads in exons and small RNA sequencing datasets suggested cleaving and recapping throughout many RNA molecules was occurring. Also, some CAGE reads started less than 20 bases from exon boundaries and mapped across them. In addition, a protein has been discovered that cleaves and recaps RNA in the cytoplasm [12]. This established the functional mechanism causing recapping, and provides support to the earlier interpretation of the overlap of small RNA and CAGE-seq datasets.
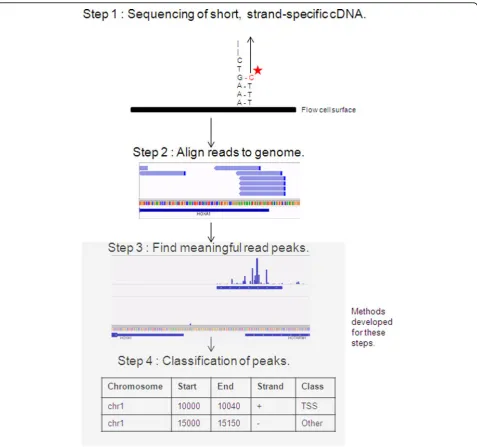
To date, a small number of methods are available to analyse CAGE-seq data. The general workflow consists of mapping the reads, creating positional histograms of read start position counts, finding statistical differences in read density along a sequence (peaks), and determining whether the identified peaks are TSS or not (Figure 1). With the exception of a single method [13], peak classifi-cation is always ignored [2,6,14-16].
CAGE-seq analysis is currently in its infancy, and algo-rithms proposed previously do not provide results that are required by biologists. Our two-stage approach pro-vides a solution to both critical steps of analysis. Unlike previous methods, the peak finding algorithm is fast and provides visually intuitive peaks. Our SVM-based classifi-cation gives high precision and recall values, and com-pared to both Segway and the ENCODE HMM method, is currently the best performing classifier for CAGE-seq data. Investigation of the benefits of integrating external data sources into the classification allows us to make informed recommendations. Pooled external data from a public database is simple to obtain at no cost, but is not representative of the cells studied by CAGE-seq.
Generating matched RNA-seq data is time and money consuming, but is specific to the cell type under study. Pooled external data was just as beneficial as integrating matched RNA-seq data, suggesting that the extra effort of RNA-seq provides no significant benefit.
Previous approaches
Various existing methods are available for the task of call-ing peaks. The first method for callcall-ing peaks in CAGE-seq data groups reads into clusters if they overlap by at least one base [14]. This is likely to join positions that are thou-sands of bases away for highly expressed transcripts. It also lacks any measure of statistical significance. A more recent approach using the Maximal Scoring Subsequences algorithm [2], implemented in the software package Paraclu, relies on exhaustively using all possible values of a penalty parameter that is used to define the breakpoints of peaks. The sheer number of results it returns, many of which overlap multiple genes, means it requires manual post-processing to arrive at a sensible number of peaks, which have biologically meaningful widths. A third approach is based on looking for adjoining positions with CAGE reads that have constant relative expression across multiple samples [15]. However, the recapping signal near TSS peaks also has constant relative expression at nearby positions, and this algorithm often generates peaks that are too wide to be biologically meaningful [P. Balwierz, pers. comm.].
The results of the peak calling algorithms above depend on read density, and do not classify peaks as originating from TSS or otherwise. The only algorithm specifically designed to classify CAGE peaks is based on modelling k-mer frequencies surrounding the peaks using an unsu-pervised hidden Markov model [13], herein called the ENCODE HMM method. The k-mers used in training are weighted proportionally to the number of reads in a peak. In other words, the algorithm biases towards learning the features of CAGE peaks with high read counts, and against peaks for lowly expressed genes. Strangely, no validation of results from the classifier is performed in the original article, and the results were used as if they were all correct. The authors also did not consider integrating external data in their model, which could potentially improve the algorithm performance. The simplest approach that avoids peak classification (and peak finding) altogether is to make small counting windows around annotated TSS [16], before performing an analysis of the amount of signal. The drawback is that novel transcription starts, and even novel genes, are ignored.
Methods
Datasets and preprocessing
development were also obtained online. Classification results of two existing methods were obtained online.
ENCODE project repository
CAGE data was obtained for six cell lines (GM12878, H1-hESC, K562, HeLa-S3, HepG2, and HUVEC - the CAGE cell lines) by downloading the mapped BAM files from the ENCODE data repository [17] on the UCSC Genome Browser website. Preprocessing details are found else-where [13]. The unique Submission IDs are 3946, 2380, 2359, 2363, 2381, and 2376.
Unmapped, total RNA-seq data for two of the six CAGE cell lines (GM12878 and K562) was downloaded. Total
STAR version 2.3.1c [18]. Non-default options set were –outFilterMultimapNmax 1–outFilterMismatchNmax 3 –clip3pNbases 40–alignIntronMax 100000. Only uniquely mapping reads and no more than 3 mismatches to the reference sequence were allowed. 40 bases from the ends of each pair of reads were ignored. No splice junctions spanning more than 100000 bases were allowed.
Pooled measurements of transcription factor binding from 95 cell types of an unspecified number of transcrip-tion factors stored in the table wgEncodeRegTfbsCluster-edV2 were downloaded. Pooled DNAse I hypersensitivity data using 74 cell lines was obtained from the table named wgEncodeRegDnaseClustered. H3K4me3 data was not integrated by ENCODE, so seven standardised signal files were downloaded, with Submission IDs 2806, 2815, 2846, 2878, 2890, 2909, and 2921. Four of the cell lines are CAGE cell lines.
The peaks classified as TSS by the ENCODE HMM were downloaded with Submission IDs 5610 and 5147. Five of the cell lines have the same submission identifier, although the classification results were all confirmed to be sample-specific.
UCSC table browser
The phyloP46wayPlacental track of conservation between 46 mammalian genomes was downloaded. Scores indicate the rate of evolution. Higher scores represent bases that are evolving faster and less conserved than the null hypothesis of neutral evolution.
FTP directories
Segway segmentations of the CAGE cell lines [19] were obtained from an URL provided to us by the authors of Segway (http://ftp.ebi.ac.uk/pub/databases/ensembl/ encode/awgHub/byDataType/segmentations/jan2011/).
GENCODE genes
The file gencode.v15.annotation.gtf.gz containing the latest transcript annotation of the human genome, version 15, was downloaded from the GENCODE data portal [20].
Peak finding
For a method to work generally for both high and low peaks, the null distribution of the statistical test should be different for each candidate region. Our method is similar in spirit to the popular ChIP-seq peak finding method MACS [21], but tailored to the particular characteristics of CAGE-seq data. CAGE reads with mapping quality of less than 20 are discarded. The definition of short read map-ping quality is described elsewhere [22]. Only the first position of a CAGE read is used in the analyses due to the fact that it is potentially representative of the site where transcription started. A candidate window of widthwis moved along each strand of each chromosome in incre-ments ofw/2. Based on biological intuition about the range of widths of peaks overlapping known transcription starts,w= 50is used. Also, flanks on either side of the
candidate window are made. The width of both of these windows was chosen to be 200. For each candidate window, and its two flanking windows, counts of CAGE read starts are made. Any candidate window with less than 10 reads is immediately discarded. The counts in the flanks are scaled for their window sizes relative to the can-didate window; in this case, dividing by 4, and rounded to the nearest integer. The counts are assumed to be Poisson distributed, and the probability of observing a count as high, or higher than the candidate region is calculated twice, withλequal to one of the scaled flank counts each time. If in either statistical test the probability is below
10−20, then the candidate window is added to a list of peak windows. The ends of peak windows are trimmed for outermost, contiguous positions that contain zero counts. Finally, any peak windows separated by less than 30 base pairs are merged into a single peak.
Feature construction
In total, eight features were constructed, as described below.
Kurtosis
Pearson’s kurtosis, based on the fourth standardised moment, is used. This feature is included to examine if any differences in peak shape would be discriminatory.
Read density
The number of CAGE reads inside the boundaries of a peak, divided by the width of a peak.
Mammalian conservation
Considered for its potential correlation with regulatory regions, such as promoters, scores inside the peaks were used. For each peak, the single base conservation values were averaged. A small fraction of peaks did not overlap with any bases with conservation scores, because the genomic sequence was not able to be multiply aligned to the other genomes. For these peaks, we used an imputed value equal to the minimum value of peaks that had conservation scores.
TFBS
Often enriched near locations where transcription starts. For each peak, the maximum score for each feature in a window extending 100 base pairs from the peak ends was assigned to the peak. The measured maximum is used so as to be permissive, rather than exclude cell type specific signals.
DNAse I hypersensitivity
Considered as TSSs typically occur in open chromatin. Similar to TFBS, the maximum count within 100 base pairs from selected peaks are determined.
H3K4me3
4-mers counts
Patterns of DNA bases surrounding the TSSs are also known to be different to other regions in the genome [23]. A 500 base pair window was created upstream and another downstream of the summit of each CAGE peak. Frequencies of all 4-mers were calculated independently for the two windows. In the upstream window, there are 44 = 256 distinct 4-mers, and similarly downstream, making a total of 512 4-mer features.
RNA-seq difference
The number of RNA-seq reads on either side of the peak was counted. Since there would be numerous reads expected downstream of a TSS region and none immedi-ately upstream, two counts were made. One count is a 100 base wide flanking window immediately upstream of the 5’edge of the CAGE peak. The other is the same size, but downstream of the 3’edge of the peak. The feature calculated was P(Y ≤y)of the Poisson distribution whereλis equal to the downstream flank count andyis the count in the upstream flank.
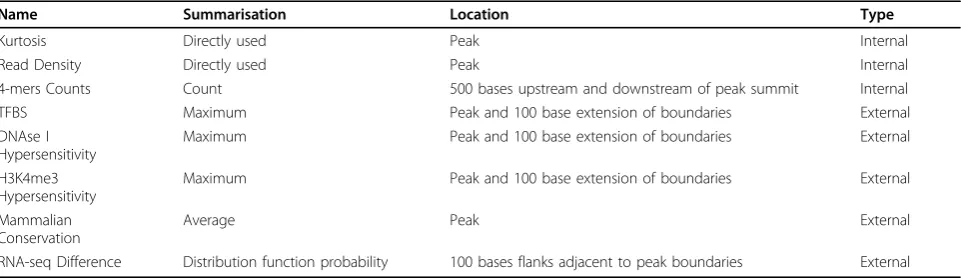
Table 1 provides a summary of all features and their calculation. PCA was used to determine which of the calculated features would be included in the classification analyses. Principal components were calculated and the first two dimensions visualised. Features that had|ρ| ≥0.5
with components that appeared to separate samples by class labels were retained. Correlation was calculated as the component loading multiplied by its eigenvalue. This procedure was done separately for the single features and the 4-mer multiple feature. The combinatorial number of 4-mer features means that they add a large amount of total variance without necessarily being informative, which PC1 will explain. Selected features were standardised to be between 0 and 1 by dividing by the maximum score for all peaks, per feature type and per cell line.
Peak classification
Class labelling of peaks was made by the same method used for Segway [19]; Segway is, to date, the most
comprehensive study of TSS region determination. Unlike typical classification datasets, where the true class mem-bership is clear and known in advance, TSS datasets require the assignment of inferred class labels to peaks. Briefly, 500 base windows were made upstream and down-stream of the start position of each GENCODE transcript. If a CAGE peak overlapped with any of the windows, it was labelled as a TSS peak. Otherwise, it was assigned to the non-TSS group.
SVM training was done with a L2-regularised L2-loss linear SVM and the primal solving option was chosen. This is because there are as many variables to optimise as there are features in the primal form, and there are many more CAGE peaks than peak features. A broad range of cost values was examined, to understand classification per-formance at different hardness levels of the SVM margin. To handle imbalanced class sizes, error weights were provided for each class. Not adjusting for differences in set sizes of the smaller TSS and larger non-TSS set would result in high accuracy for the non-TSS set and low accu-racy for the TSS set, since the default parameterisation of SVMs is to maximise the overall number of correct predictions [24]. For the TSS class, the weight was calcu-lated as the number of peaks in the non-TSS class divided by the number of peaks belonging to the TSS class. For the non-TSS class, the weight was 1.
Performance of the classification was evaluated by preci-sion and recall. Precipreci-sion is the percentage of TSS classi-fied peaks that are labelled as TSS peaks. Recall is the percentage of labelled TSS peaks that were classified as TSS peaks. Leave-one-out cross validation (LOOCV) was used with five cell lines for training and one for testing, in each round. Precision and recall values were compared to those of Segway and ENCODE HMM, to determine which method performs best for TSS region prediction, overall.
Computing environment
All analyses were performed in R [25] version 2.15.3. Packages from the Bioconductor [26] project were used
Table 1 Number of peaks found by Poisson thresholding of sliding window method.
Name Summarisation Location Type
Kurtosis Directly used Peak Internal
Read Density Directly used Peak Internal
4-mers Counts Count 500 bases upstream and downstream of peak summit Internal
TFBS Maximum Peak and 100 base extension of boundaries External
DNAse I Hypersensitivity
Maximum Peak and 100 base extension of boundaries External
H3K4me3 Hypersensitivity
Maximum Peak and 100 base extension of boundaries External
Mammalian Conservation
Average Peak External
RNA-seq Difference Distribution function probability 100 bases flanks adjacent to peak boundaries External
extensively. Mapped data was read into R by using the Rsamtools package. The package GenomicRanges was used for overlapping genomic intervals and creating flank-ing regions. The function oligonucleotideFrequency from Biostrings was used for calculating all 4-mers based on the sequence of the hg19 genome found in the package BSge-nome.Hsapiens.UCSC.hg19. The rtracklayer package was used for importing ENCODE feature tracks and exporting coverage and peak region tracks. The CRAN package “moments”was used to calculate peak kurtosis. SVM training and prediction were performed with the R inter-face to LIBLINEAR [27], LiblineaR.
Results
Peak finding
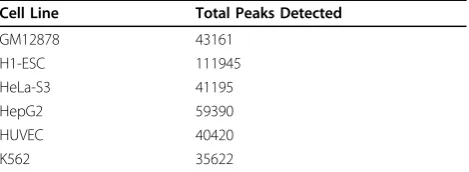
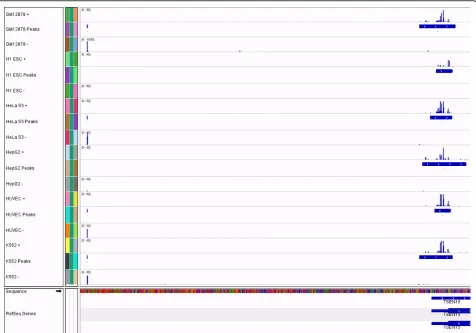
The local Poisson thresholding algorithm discovered tens of thousands of peaks in each sample (Table 2). About twice as many peaks were found for the H1-hESC cell line compared to any other cell line. This is biologically expected, because stem cells have open chromatin and transcription of many tissue-specific transcripts occurs, which are otherwise silenced in differentiated cells [28]. Manual exploration of coverage tracks showed that the algorithm finds peaks both broad and narrow (Figure 2). By definition, the algorithm will not find extremely broad peaks that were rarely observed, some of which are thou-sands of bases wide. However, based on current biological knowledge, these peaks are not likely to be real TSS regions, and were observed to overlap with known long 3’ UTRs.
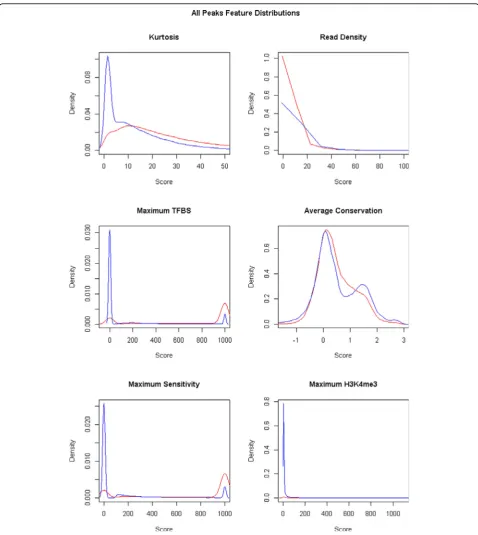
Feature selection
Feature selection is an important step in any classifica-tion algorithm, as features not correlated to the class distinction can adversely affect the prediction perfor-mance. All peaks from all cell lines were used in this step, so as to ensure features selected are those which generalise well. Initial exploration of the association of single features with classes suggested that some features would be better discriminators than others (Figure 3). Higher scores were generally observed for the three pooled external features and kurtosis, for TSS class
peaks. The three pooled features are known to be posi-tively correlated with TSS regions. The relationship of higher kurtosis for the TSS peaks than non-TSS peaks is expected, as TSS regions are known to be taller and nar-rower than non-TSS regions [2]. These observations motivate the use of feature selection.
Single feature selection was done based on standardised scores, as described in Methods, for all six single features. The first dimension had good separation, and largely corre-sponded to the separation between samples of the two classes. Those with an absolute correlation to PC1 of more than 0.5 were selected to be in the model. The features selected were: kurtosis (ρ=−0.53), transcription factor maximum (ρ=−0.92), DNase I hypersensitivity maxi-mum (ρ=−0.91), and H3K4me3 maximum (ρ=−0.86). These are the same features that were observed to be dif-ferent between classes in the density plots.
In addition to the single features, we also examined the multiple feature of 4-mer frequency. PCA was used on standardised counts of the 512 distinct 4-mers. The first principal component had good separation of the two classes. There were 168 4-mers that had |r| ≥0.5 with PC1, and were selected to be used in classification.
Among the selected features, we can broadly categor-ise them into internal and external features. Firstly, internal features have the characteristic of being directly computable from the mapped CAGE-seq data. Kurtosis and 4-mer frequencies are the internal features. The other features are external features. They must either be obtained from external databases or experimentally derived. In the next section, we examine classifier per-formance in a range of different feature scenarios.
Classification evaluation
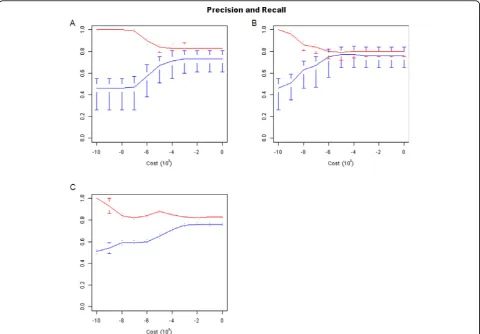
We used a linear SVM to classify peaks based on the selected features. Several different cost parameters were investigated. At each level, LOOCV was performed. In the first scenario, only internal features were considered. These are kurtosis and 4-mer counts. Kurtosis and each 4-mer were initially scaled to be in the range[0, 1]. To combine the kurtosis and 168 different 4-mers so that they have equal weighting in the classifier, the values of kurtosis were rescaled to be in the range[0, 168]. Figure 4A shows the precision and recall values for this SVM across a large range of cost values. Precision and recall are high for most of the cost parameter values.
In the second scenario, the internal features were combined with the unmatched external features. Three external features were selected previously - namely TFBS, DNAse I hypersensitivity, and H3K4me3. They are rescaled to each be in the range[0, 2×168/3], so that the contribution of all three external features is the same as the set of internal features. Figure 4B shows precision and recall values for this feature set. Precision
Table 2 Summary of features and how they are calculated.
Cell Line Total Peaks Detected
GM12878 43161
H1-ESC 111945
HeLa-S3 41195
HepG2 59390
HUVEC 40420
K562 35622
is essentially the same as for the internal feature set, while a moderate improvement of recall is observed. Genome browser tracks of peak locations for this sce-nario are available (Additional File 2).
Finally, the matched RNA-seq dataset was considered, because it is desirable to determine if integration of a com-plementary RNA-seq experiment with internal features can improve peak classification. The RNA-seq feature is scaled to have equal importance as the internal features by setting its range to be[0, 2×168]. Figure 4C shows preci-sion and recall values for this feature set. Recall is better, relative to the internal feature set.
Performance comparisons were made to Segway and ENCODE HMM, to determine the best currently avail-able method for TSS determination. The precision and recall of Segway (Table 3) was calculated for all six cell lines, using the same definition as in the publication, but with a current genome annotation. Segway’s precision is comparable to our method across all feature scenarios. Recall, however, averages 71 % for Segway, whereas it averages 82 % for our method when considering cost
parameters≥10−4. Evaluation of the ENCODE HMM was also performed. The reference labelling was gener-ated in the same way as for Segway. Precision and recall results of ENCODE HMM are also presented in Table 3. As expected from its assumptions, the algorithm has good recall (mean 0.92) at the expense of precision (mean 0.27). Our proposed SVM-based method has much better mean precision than ENCODE HMM.
Discussion
A good evaluation framework for peak finding methods in CAGE-seq data is still a challenging task. Although the peak locations found by the sliding window algorithm appear to be intuitively correct, there is no objective quality metric that could be used to fairly compare it to
which contain the transcription factor’s binding motif [31-33]. However, it is only possible to calculate this measure if the transcription factor has a known binding motif. In addition, it is impossible to assess false nega-tives, because a provably complete and correct experi-mental method does not exist. The general field of peak finding in high throughput sequencing data would bene-fit greatly if it were possible to generate a truth set to compare algorithm performance.
Our study shows that improvement by integrating RNA-seq data isn’t as evident as expected; the classification model with simple features shows comparable perfor-mance to the more feature-rich models. We examined three classes of features here: internal features, external (non-matched) features and external cell-specific features (RNA-seq). Internal features performed well, in terms of both precision and recall. Adding pooled external data for DNA accessibility, transcription factor site density, and an epigenetic modification known to be associated with TSS peaks resulted in a minor improvement in identifying true
TSS peaks. Likewise, adding matched RNA-seq informa-tion to the internal feature set for two of the cell lines did not noticeably improve precision, while recall improved.
Even with the myriad of‘omics data, identification of TSS regions remains a non-trivial task. The ENCODE HMM algorithm is dominated by false positives. This is a common type of analysis bias in most of the ENCODE consortium’s methods [34]. Currently, the segmentation of the genome using multiple epigenetic features appears to be the most sophisticated way to find regions of transcrip-tion initiatranscrip-tion. In the published example using Segway, 31 different sources of data were required [19] and this com-plexity translates into days of training on a computing cluster [W. S. Noble, pers. comm.]. In contrast, our pro-posed method runs in the order of seconds on a desktop computer, and was shown to have similar precision, but noticeably better recall. The reduced computational run-time is a major advantage of our method.
and FANTOM [6,7] consortium, and would greatly benefit from the proposed SVM classification method. Conceiva-bly, a sample preparation improvement may be developed in the future that is able to separate the recapped RNA from genuinely transcribed 5’ends, and may diminish the importance of the classification stage of our approach. However, any newly discovered knowledge relating to the recapping position can easily be incorporated into our SVM framework as additional features, enabling more accurate analysis of the many existing datasets.
Conclusions
A two-stage approach involving a sliding window using a Poisson-based cut-off together with a SVM classifier is a simple and effective approach to computationally define TSS peaks. An evaluation study considering three types of feature sets (internal, pooled external, and matched RNA-seq) showed that the precision was comparable to Segway and recall was consistently better across each of the three training feature scenarios, even though our method runs many times faster than Segway. There are currently no other algorithms that could be applied to the classification problem with good precision and recall, and desirable run time.
Additional material
Additional file 1: Plot of raw total RNA-seq data quality scores from ENCODE. Quality scores drop in the middle of the read, then again at the end of the read, suggesting that the data is unlikely to have been generated by a single-end sequencing protocol. The vertical axis is Phred quality score. A. Cell line GM12878 B. Cell line K562.
Additional file 2: Archive of all peak calls. Archive contains one BED file for each cell line. BED files can be viewed in any genome browser.
Competing interests
The authors declare that they have no competing interest.
Authors’contributions
DS developed the method, implemented the algorithm and drafted the manuscript. NJA and JYHY participated in all aspects of the study and helped to draft the manuscript. All authors read and approve of the final manuscript.
Acknowledgements
We thank Prof. Susan Clark and Dr. Clare Stirzaker from the Garvan Institute of Medical Research, Sydney, Australia for alerting us to challenges in CAGE-seq data analysis.
Declarations
Publication of this article was funded by the Australian Research Council grant DP130100488.
This article has been published as part ofBMC GenomicsVolume 14 Supplement 5, 2013: Twelfth International Conference on Bioinformatics (InCoB2013): Computational biology. The full contents of the supplement are available online at http://www.biomedcentral.com/bmcgenomics/
supplements/14/S5.
Published: 16 October 2013
References
1. Cairns BR:The logic of chromatin architecture and remodelling at promoters.Nature2009,461:193-198.
2. Frith MC, Valen E, Krogh A, Hayashizaki Y, Carninci P, Sandelin A:A code for transcription initiation in mammalian genomes.Genome Res2008, 18:1-12.
3. Yang Z-F, Zhang H, Ma L, Peng C, Chen Y, Wang J, Green MR, Li S, Rosmarin AG:GABP transcription factor is required for development of chronic myelogenous leukemia via its control of PRKD2.PNAS2013, 110:2312-2317.
4. Pruunsild P, Kazantseva1 A, Aid T, Palm K, Timmusk T:Dissecting the human BDNF locus: Bidirectional transcription, complex splicing, and multiple promoters.Genomics2007,90:397-406.
5. Takahashi H, Lassmann T, Murata M, Carninci P:5[prime] end-centered expression profiling using cap-analysis gene expression and next-generation sequencing.Nature Protocols2012,7:542-561.
6. Ravasi T, Suzuki H, Cannistraci CV, Katayama S, Bajic VB, Tan K, Akalin A, Schmeier S, Kanamori-Katayama M, Bertin N, Carninci P, Daub CO, Forrest ARR, Gough J, Grimmond S, Han J-H, Hashimoto T, Hide W, Hofmann O, Kamburov A, Kaur M, Kawaji H, Kubosaki A, Lassmann T, van Nimwegen E, MacPherson CR, Ogawa C, Radovanovic A, Schwartz A, Teasdale RD, Tegnér J, Lenhard B, Teichmann SA, Arakawa T, Ninomiya N, Murakami K, Tagami M, Fukuda S, Imamura K, Kai C, Ishihara R, Kitazume Y, Kawai J, Hume DA, Ideker T, Hayashizaki Y:An Atlas of Combinatorial Transcriptional Regulation in Mouse and Man.Cell2010,140:744-752. 7. Faulkner GJ, Kimura Y, Daub CO, Wani S, Plessy C, Irvine KM, Schroder K,
Cloonan N, Steptoe AL, Lassmann T, Waki K, Hornig N, Arakawa T, Takahashi H, Kawai J, Forrest ARR, Suzuki H, Hayashizaki Y, Hume DA, Orlando V, Grimmond SM, Carninci P:The regulated retrotransposon transcriptome of mammalian cells.Nature Genetics2009,41:563-571. 8. Bert SA, Robinson MD, Strbenac D, Statham AL, Song JZ, Hulf T,
Sutherland RL, Coolen MW, Stirzaker C, Clark SJ:Regional Activation of the Cancer Genome by Long-Range Epigenetic Remodeling.Cancer Cell2013, 23:9-22.
9. Langmead B, Trapnell C, Pop M, Salzberg SL:Ultrafast and memory-efficient alignment of short DNA sequences to the human genome.
Genome Biology2009,10:R25.
10. Fejes-Toth K, Sotirova V, Sachidanandam R, Assaf G, Hannon GJ, Kapranov P, Foissac S, Willingham AT, Duttagupta R, Dumais E, Gingeras TR: Post-transcriptional processing generates a diversity of 5|[prime]|-modified long and short RNAs.Nature2009,457:1028-1032.
11. Carninci P:RNA Dust: Where are the Genes?DNA Res2010,17:51-59. 12. Otsuka Y, Kedersha NL, Schoenberg DR:Identification of a Cytoplasmic
Complex That Adds a Cap onto 5′-Monophosphate RNA.Mol Cell Biol
2009,29:2155-2167.
13. Djebali S, Davis CA, Merkel A, Dobin A, Lassmann T, Mortazavi A, Tanzer A, Lagarde J, Lin W, Schlesinger F, Xue C, Marinov GK, Khatun J, Williams BA, Zaleski C, Rozowsky J, Röder M, Kokocinski F, Abdelhamid RF, Alioto T, Antoshechkin I, Baer MT, Bar NS, Batut P, Bell K, Bell I, Chakrabortty S,
Table 3 Precision and recall of publically available classifications.
Segway ENCODE
HMM
Proposed Method
Cell Line Precision Recall Precision Recall Precision Recall
GM12878 0.7 0.64 0.25 0.92 0.77 0.81 H1-ESC 0.59 0.71 0.27 0.89 0.61 0.81 HeLa-S3 0.79 0.66 0.32 0.91 0.76 0.87 HepG2 0.59 0.59 0.23 0.93 0.69 0.79 HUVEC 0.82 0.67 0.26 0.94 0.81 0.85
K562 0.77 0.62 0.27 0.93 0.71 0.88
Chen X, Chrast J, Curado J, Derrien T, Drenkow J, Dumais E, Dumais J, Duttagupta R, Falconnet E, Fastuca M, Fejes-Toth K, Ferreira P, Foissac S, Fullwood MJ, Gao H, Gonzalez D, Gordon A, Gunawardena H, Howald C, Jha S, Johnson R, Kapranov P, King B, Kingswood C, Luo OJ, Park E, Persaud K, Preall JB, Ribeca P, Risk B, Robyr D, Sammeth M, Schaffer L, See L-H, Shahab A, Skancke J, Suzuki AM, Takahashi H, Tilgner H, Trout D, Walters N, Wang H, Wrobel J, Yu Y, Ruan X, Hayashizaki Y, Harrow J, Gerstein M, Hubbard T, Reymond A, Antonarakis SE, Hannon G,
Giddings MC, Ruan Y, Wold B, Carninci P, Guigó R, Gingeras TR:Landscape of transcription in human cells.Nature2012,489:101-108.
14. Carninci P, Sandelin A, Lenhard B, Katayama S, Shimokawa K, Ponjavic J, Semple CAM, Taylor MS, Engström PG, Frith MC, Forrest ARR, Alkema WB, Tan SL, Plessy C, Kodzius R, Ravasi T, Kasukawa T, Fukuda S, Kanamori-Katayama M, Kitazume Y, Kawaji H, Kai C, Nakamura M, Konno H, Nakano K, Mottagui-Tabar S, Arner P, Chesi A, Gustincich S, Persichetti F, Suzuki H, Grimmond SM, Wells CA, Orlando V, Wahlestedt C, Liu ET, Harbers M, Kawai J, Bajic VB, Hume DA, Hayashizaki Y:Genome-wide analysis of mammalian promoter architecture and evolution.Nature Genetics2006, 38:626-635.
15. Balwierz P, Carninci P, Daub C, Kawai J, Hayashizaki Y, Belle WV, Beisel C, Nimwegen E van:Methods for analyzing deep sequencing expression data: constructing the human and mouse promoterome with deepCAGE data.Genome Biology2009,10:R79.
16. Plessy C, Pascarella G, Bertin N, Akalin A, Carrieri C, Vassalli A, Lazarevic D, Severin J, Vlachouli C, Simone R, Faulkner GJ, Kawai J, Daub CO, Zucchelli S, Hayashizaki Y, Mombaerts P, Lenhard B, Gustincich S, Carninci P:Promoter architecture of mouse olfactory receptor genes.Genome Res2012, 22:486-497.
17. ENCODE Project at UCSC.[http://genome.ucsc.edu/ENCODE/]. 18. Dobin A, Davis CA, Schlesinger F, Drenkow J, Zaleski C, Jha S, Batut P,
Chaisson M, Gingeras TR:STAR: ultrafast universal RNA-seq aligner.
Bioinformatics2013,29:15-21.
19. Hoffman MM, Buske OJ, Wang J, Weng Z, Bilmes JA, Noble WS: Unsupervised pattern discovery in human chromatin structure through genomic segmentation.Nature Methods2012,9:473-476.
20. GENCODE-Gencode data.[http://www.gencodegenes.org/data.html]. 21. Zhang Y, Liu T, Meyer CA, Eeckhoute J, Johnson DS, Bernstein BE,
Nusbaum C, Myers RM, Brown M, Li W, Liu XS:Model-based Analysis of ChIP-Seq (MACS).Genome Biology2008,9:R137.
22. Li H, Ruan J, Durbin R:Mapping short DNA sequencing reads and calling variants using mapping quality scores.Genome Res2008,18:1851-1858. 23. Sonnenburg S, Zien A, Rätsch G:ARTS: accurate recognition of
transcription starts in human.Bioinformatics2006,22:e472-e480. 24. Akbani R, Kwek S, Japkowicz N:Applying support vector machines to
imbalanced datasets.Proceedings of the 15th European Conference on Machine Learning (ECML)2004, 39-50.
25. R Development Core Team:R: A Language and Environment for Statistical ComputingVienna, Austria; 2008.
26. Gentleman RC, Carey VJ, Bates DM, Bolstad B, Dettling M, Dudoit S, Ellis B, Gautier L, Ge Y, Gentry J, Hornik K, Hothorn T, Huber W, Iacus S, Irizarry R, Leisch F, Li C, Maechler M, Rossini AJ, Sawitzki G, Smith C, Smyth G, Tierney L, Yang JY, Zhang J:Bioconductor: open software development for computational biology and bioinformatics.Genome Biology2004,5: R80.
27. Fan R-E, Chang K-W, Hsieh C-J, Wang X-R, Lin C-J:LIBLINEAR: A Library for Large Linear Classification.J Mach Learn Res2008,9:1871-1874. 28. Efroni S, Duttagupta R, Cheng J, Dehghani H, Hoeppner DJ, Dash C,
Bazett-Jones DP, Le Grice S, McKay RDG, Buetow KH, Gingeras TR, Misteli T, Meshorer E:Global Transcription in Pluripotent Embryonic Stem Cells.
Cell Stem Cell2008,2:437-447.
29. Giannopoulou EG, Elemento O:An integrated ChIP-seq analysis platform with customizable workflows.BMC Bioinformatics2011,12:277. 30. Rozowsky J, Euskirchen G, Auerbach RK, Zhang ZD, Gibson T, Bjornson R,
Carriero N, Snyder M, Gerstein MB:PeakSeq enables systematic scoring of ChIP-seq experiments relative to controls.Nature Biotechnology2009, 27:66-75.
31. Wilbanks EG, Facciotti MT:Evaluation of Algorithm Performance in ChIP-Seq Peak Detection.PLoS ONE2010,5:e11471.
32. Boyle AP, Guinney J, Crawford GE, Furey TS:F-Seq: a feature density estimator for high-throughput sequence tags.Bioinformatics2008, 24:2537-2538.
33. Hower V, Evans SN, Pachter L:Shape-based peak identification for ChIP-Seq.BMC Bioinformatics2011,12:15.
34. Graur D, Zheng Y, Price N, Azevedo RBR, Zufall RA, Elhaik E:On the Immortality of Television Sets:“Function”in the Human Genome According to the Evolution-Free Gospel of ENCODE.Genome Biol Evol
2013,5:578-590.
doi:10.1186/1471-2164-14-S5-S9
Cite this article as:Strbenacet al.:Detection and classification of peaks in 5’cap RNA sequencing data.BMC Genomics201314(Suppl 5):S9.
Submit your next manuscript to BioMed Central and take full advantage of:
• Convenient online submission
• Thorough peer review
• No space constraints or color figure charges
• Immediate publication on acceptance
• Inclusion in PubMed, CAS, Scopus and Google Scholar
• Research which is freely available for redistribution