Please cite this article as: M. Kabiri naeini, M. S. Owlia, M. S. Fallahnezhad, A New Statistical Approach for Recognizing and Classifying Patterns of X XControl Charts, International Journal of Engineering (IJE), TRANSACTIONS A: Basics Vol. 28, No. 7, (July 2015) 1040-1048
International Journal of Engineering
J o u r n a l H o m e p a g e : w w w . i j e . i r
A New Statistical Approach for Recognizing and Classifying Patterns of
X
Control
Charts
M. Kabiri naeini*a, M. S. Owliab, M. S. Fallahnezhadb
a Department of Industrial Engineering, Payam Noor University, Yazd. Iran b Department of Industrial Engineering, Yazd University, Yazd, Iran
P A P E R I N F O
Paper history:
Received 19 September 2014 Received in revised form 10 April 2015 Accepted 11 June 2015
Keywords:
Statistical Process Control Control Chart
Pattern Recognition Bayes Rule
Maximum Likelihood Estimation
A B S T R A C T
Control chart pattern (CCP) recognition techniques are widely used to identify the potential process problems in modern industries. Recently, artificial neural network (ANN) –based techniques are very popular to recognize CCPs. However, finding the suitable architecture of an ANN-based CCP recognizer and its training process are time consuming and tedious. In addition, because of the black box nature, the outputs of the ANN-based CCP recognizer are not interpretable. To facilitate the research gap, this paper presents a statistical decision making approach to recognize and classify the patterns of control charts. In this method, by taking new observations from the process, the Maximum Likelihood Estimators of pattern parameters are first obtained and then in an iterative approach based on the Bayesian rule, the beliefs, that each pattern exists in the control chart, are updated. Finally, when one of the updated beliefs becomes greater than a predetermined threshold, a pattern recognition signal is issued. Simulation study is performed based on moving window recognition approach, and the accuracy and speed of method is evaluated and compared with the ones from some ANN-based methods. The results show that the proposed method has more accurate interpretable results without training requirement.
doi: 10.5829/idosi.ije.2015.28.07a.10
1. INTRODUCTION1
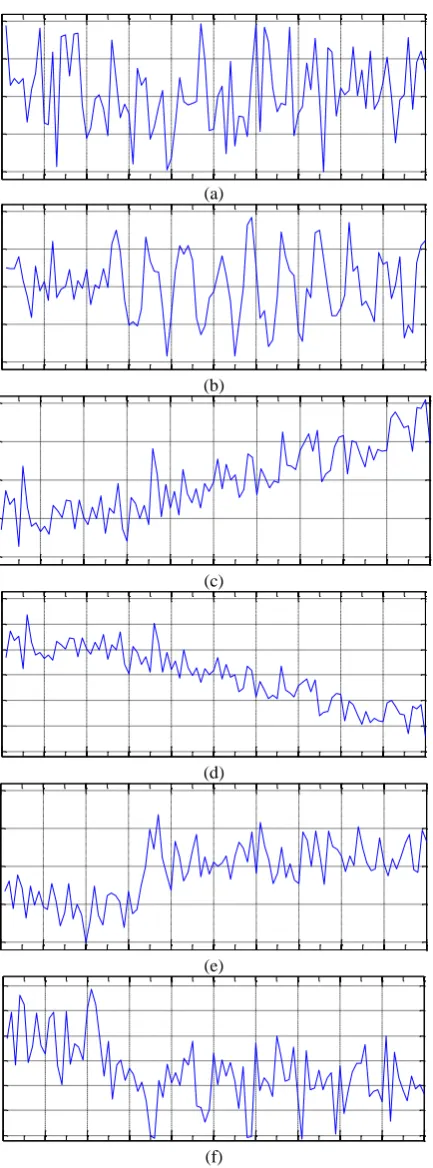
Statistical Process Control (SPC) tools are widely used to achieve process stability and improve capability through the reduction of variability. One of the primary tools of SPC is control chart. Control charts are very popular for process control to determine whether the process is behaving in its intended mode or if there are some unnatural causes of variation. To use a control chart, samples of the output are collected during manufacturing process and sample statistics are plotted on the chart. Series of points plotted on a chart constitute a pattern. Patterns displayed on control charts can be classified as natural (Normal pattern (N)) and unnatural (abnormal patterns, i.e., Cyclic (CYC), Increasing Trend (IT), Decreasing Trend (DT), Upward Shift (US) and Downward Shift (DS)). In Figure 1, (a)
1*Corresponding Author’s Email: [email protected] (M.
Kabiri naeini)
pertains to a normal process and (b) to (f) belong to a process that has changed at point 26. The basic significance of a natural pattern is that it indicates a process under control. On the contrary, an unnatural pattern indicates a process which is out of control. Abnormal patterns often contain valuable information relevant to process changes and problems [1]. In practice, shift patterns may result from the introduction of new workers, methods, raw materials, machines, a change in the inspection method or standards, or a change in either the skill, attentiveness, or motivation of the operators. Trend patterns are usually due to a gradual wearing out or deterioration of a tool or some other critical process component. Cyclic patterns may result from systematic environmental changes such as temperature, operator fatigue, regular rotation of operators or machines or fluctuation in voltage or pressure or some other variables in the production equipment. Once the sources of abnormal patterns are correctly identified, quality practitioners can remove
them and bring the abnormal process back to the normal condition. Hence, accurate recognition of control chart patterns is an important task in process control.
(a)
(b)
(c)
(d)
(e)
(f)
Figure 1. Six types of control chart patterns: a) N; b) CYC; c) IT; d) DT; e) US and f) DS
Since late 1980s, CCP recognition has become an active area of research and different approaches have been proposed [1]. Traditionally, control chart patterns have been analyzed and interpreted manually. Over the years numerous supplementary rules known as zone test or run rules have been developed to assist the quality practitioners [2-4]. Simultaneous application of all the available rules could result in excessive numbers of false alarms, moreover due to the natural random variation in the process, a run would still have a low probability of occurrence and since abnormal change of a process that is being looked for can be common to more than one pattern. Furthermore, working with run rules requires considerable experience and skill. Therefore, run rules are not very effective for CCP recognition [5].
To improve and facilitate the task of CCP recognition, various kinds of expert systems (ES) have been proposed. Swift [6] developed the first ES for CCP recognition. Cheng [7] applied a template-matching method to develop a process deviation reasoning system. Cheng and Hubele [8], developed a syntactic pattern recognition system to detect deviations of processes, and demonstrated its capability on six unnatural patterns of control charts. Some researchers [9, 10] have applied the concept of fuzzy sets and membership functions to detect unnatural patterns. The advantage of a rule-based expert system is that it contains explicit rules that if required, can be modified and updated easily. However, there are also the problems of false or missing alarm by using the expert system to recognize CCPs [11, 12].
Some researchers like Al-Ghanim and Kamat [13] and Yang and Yang [14], used statistical methods based on correlation analysis to develop a CCP recognition system. The recent papers have mostly applied artificial neural networks (ANNs) to solve the CCP recognition problem [9, 15-39]. In ANN approach, the network is trained to recognize several types of patterns. An ANN does not require the provision of explicit rules or templates for pattern recognition.
configuration for supervised ANN is quite slow and hence infeasible for on-line quality practitioners.
In this study we describe a new method based on
Decision on Beliefs (DOB) [40] for CCP recognition problem. In this approach, we look at the CCP recognition as a decision making problem to select one member of the alternatives set. The adopted approach of DOB, has also experienced solving some other statistical problems such as Response Surface
methodology [40], Quality Control [41] and
Distribution Fitting [42]. In all the cases, adopted DOB algorithms outperform all the best common ones in many aspects.
Similar to most researchers [14, 15, 18, 22, 23, 35, 36, 43, 44], six basic types of simple CCPs (Normal,
Upward and Downward Shift, Increasing and
Decreasing Trend and Cycle) are considered in this research.
2. THE PROPOSED APPROACH
The proposed method looks at the CCP recognition as a decision making problem to select one member of the alternatives set. To do this, we assume a quality characteristic is given to be monitored by means of X
control chart. Although the control chart pattern (Patternx), is unknown, we know it belongs to a
candidate set S={Pi;=1,2,3,4} where the values of i
represent normal, trend, shift and cycle, respectively. We assume the distribution of the quality characteristic as well as its parametersare known. The objective is to identify the control chart pattern (Patternx)from the set
of four candidate patterns.
The presented method selects a member of S which its probability of presence is both greater than other members’ probability and a lower bound. Following Eshragh and Niaki [40], we name the probability measures as "belief". At each iteration, we need to calculate the beliefs of the members of S. To calculate and update the beliefs, after obtaining each new observation, we estimate the pattern parameters using the observations gathered from beginning up to now.
TABLE 1. Equations of patterns
Pattern Pattern equation
Normal xtrt
Trend (Increasing, Decreasing) xtrtkt; In case of decreasing trend, k<0 Shift (Upward, Downward) xtrts;
In case of downward shift, s<0
Cycle xtrtAsin(2t/T);
Using estimated pattern parameters, we attempt to eliminate the effect of considered pattern assignable cause to reach normal distributed data. Then we can update the beliefs on patterns using the Bayes theorem to calculate the posterior beliefs from the prior ones. After updating the beliefs, by identifying the maximum belief, and according to the criterion of stopping condition that will be introduced later, we either select maximum belief’s regarding pattern for Patternx or
decide to continue and try another observation. In following subsections we explain the presented method.
2. 1. Estimation of Patterns Parameters In the first step of the presented method, we need to estimate the patterns parameters. We want to obtain the Maximum Likelihood Estimator (MLE) of patterns parameters using several recently gathered process observations. For the sake of simplicity, we assume only one single observation is gathered at each iteration. First we introduce a required definition.
Definition 1. Let the outcome of tth process observation be denoted by xt. Then, after t observations, we call
1 2 ( , ,..., )
t t
O x x x as tth observations vector.
The patterns equations are mentioned in Table 1. In patterns equations, xt represents the tth process
observation. In case of normal pattern, we assume the in-control process follows a normal distribution with meanand variance 2 (the mean and the variance of the process can be either estimated from the in-control observations or set by the user). So in case of each pattern, by subtracting the pattern part from the observation data, the remainder value (rt) is a normal
random variable with known parameters and 2, as presented in Equations (1-4):
t t
r x (1)
t t
r x kt (2)
t t
r x s (3)
sin(2 / )
t t
r x A t T (4)
By knowing the distribution of rt and using tth
observations vector, MLE of parameters k, s and A
could be obtained using Equations (5-7).
ˆ 2( ) /( 1)
k x n (5)
ˆ
sx (6)
2
1 1
ˆ t sin(2 / ˆ) / t sin (2 / ˆ)
i
i i
A i T x i T
(7)1 2 1
1
ˆ sin(2 / )
ˆ ˆ
cos(2 / ) sin(2 / )
ˆ sin (2 / )
t i t i i t i i
i T x
i i T x i T
i T
0 (8)A numerical search procedure by testing the values of 4,5,…,20 for ˆT is used to solve Equation (8). The value of ˆTthat makes the absolute of right hand side of Equation (8) positive minimum is the solution of this equation.
2. 2. Updating the Beliefs At each iteration of data gathering process, beliefs are calculated and updated using a recursive equation based on Bayes’ Rule. Another required definition is as follows.
Definition 2. Assume we have the tth observations vector Ot. The belief on Pi to be the desired pattern, on
the basis of the information obtained from the observations up to this point, is defined as follows:
( ) : Pr | }
i t x i t
B O Pattern P O
After (t-1) observations, let assume the decision is to continue. After taking a new observation, xt,
1 1 2
( , ) ( , ,..., )
t t t t
O O x x x x is the observations vector
on the quality characteristic of the current and the previous t-1 iterations. To calculate posterior beliefs
( ), 1, 2,3, 4 i t
B O i , from the prior beliefs B Oi( t1), Bayes formula is applied, as follows:
1 1
1 1
1 1 1
( ) ( , ) : Pr{ | }
Pr{ | , }
Pr{ , | }/ Pr{ | }
Pr{ | }Pr{ | , }/ Pr{ | }
i t i t t x i t
i t t
i t t t t
i t t i t t t
B O B x O Pattern P O
P x O
P x O x O
P O x P O x O
Thus the beliefs B x Oi( ,t t1)can be determined by the following recursive equation.
1 1 4 1 1
Pr | }Pr | }
( , )
Pr | }Pr | }
t i
i t
i t t
t j
j t
j
P O x P
B x O
P O x P
1 2 4 1 2 1( , ) Pr{ | }
( , ) Pr{ | }
i t t t i
j t t t j
j
B x O x P
B x O x P
(9)In Equation (9), we need to calculate the probability
1
Pr x P Ot| ,i t}Pr x Pt| }i . When pattern Pi exists in the
process then it is concluded that variables rit are
independent normal variables with parameters and 2
. Hence by assuming the presence of pattern Pi in
the process, we have:
2
( ) / 2
Pr{ | } (1/ 2 ) rit
it i
r P e (10)
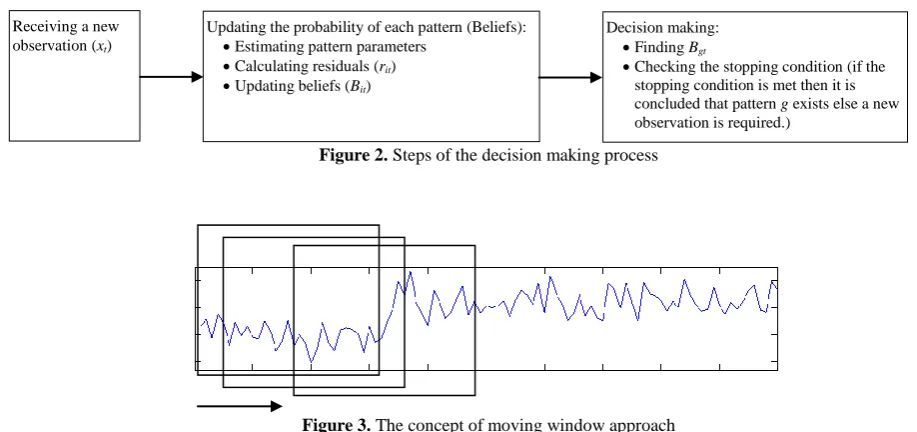
2. 3. Steps of Decision Making Process In the proposed approach, at each iteration of the data
gathering process, a recursive equation is used to update the values of Bi(xt,Ot-1). Then, when one of the updated
beliefs becomes greater than a predetermined threshold, a pattern recognition signal is issued. The suitable value of could be determined based on type I and type II errors using simulation experiments. Hence, the detection and classification of control chart patterns at iteration t can be achieved by employing the following algorithm (see Figure 2):
Step 1: Estimate the patterns parameters using Equations (5-8).
Step 2: Determine the residuals, rit, using Equations
(1-4).
Step 3: Calculate and update the beliefs using 2
2
( ) / 2 , 1
4 ( ) / 2 , 1
1
(1/ 2 )
(1/ 2 )
it jt r i t it r j t j B e B B e
where B1,0= B2,0= B3,0= B4,0=0.25.
Step 4: Find the greatest belief, Bg,t, where
, ( ) { ( ); 1, 2,3, 4}
g t g t i t
B B O Max B O i .
Step 5: Check for stopping condition: if Bg,t is greater
than , then conclude that pattern Pg exists and finish
the process. If g is 2 or 3, then look at the sign of the current regarded pattern parameters and decide whether the pattern is increasing (upward) or decreasing (downward). For example if g=2 and kˆ 0.085, conclude that decreasing trend exists in the process. If
Bg,t is not greater than , without having any selection
at this iteration, take a new observation (xt+1) and return
to Step 1.
3. THE MOVING WINDOW APPROACH
Generally two methods were reported in the literature for evaluating the CCP recognition systems: fixed observation window method [20, 34, 35] and moving observation window method [18, 21, 24, 28, 29, 45]. In moving window method, at each iteration, the observation window is incremented forward by one process measurement until the CCP recognizer can detect an unnatural pattern based on the observation window points (see Figure 2).
In this approach, the process commences with an in-control condition, so the initial observation window contains no unnatural pattern points and unnatural patterns begin to appear as the window moves along the time series, and the pattern features gradually strengthen as the recognition window moves forwards through the process data stream.
Although the evaluation results using this approach are inferior to those with the first approach, it is considered more practical because, in a real-time process-monitoring scheme, an unnatural CCP often occurs after a period during which the process is in control, and the starting point of the unnatural CCP is generally unknown [18, 45]. So the second approach which enables to handle the online CCP recognition schemes, is considered as being more practical than the first approach.
Our adopted moving window approach consists of the following steps:
1. Determine the stopping condition (the suitable value of threshold for recognition).
2. At each sampling time i, collect the most recent m
sample values, Xi (i=t-m+1,t-m+2,…,t-1,t) from the
monitored process and feed them to the presented recognizer to calculate MLEs and residuals and beliefs. 3. If the stopping condition is met for any of patterns, conclude that pattern has been detected in the current recognition window. Otherwise, increment t by 1, and go to Step 2. Repeat this procedure until an unnatural pattern is detected.
4. EVALUATION OF THE PROPOSED METHOD
In this section accuracy and speed of the presented method is evaluated. Like most of the researchers, the synthetic (artificial) samples generated using Monte-Carlo simulation approach, was applied as the test data. The simulation experiments were performed based on moving window recognition approach and the window size of 25 was used. All the unnatural CCPs began at point 26 in the simulated process data stream. The first 25 data points were generated using a normal distribution. Using MATLAB® 2008, a set of 600,000
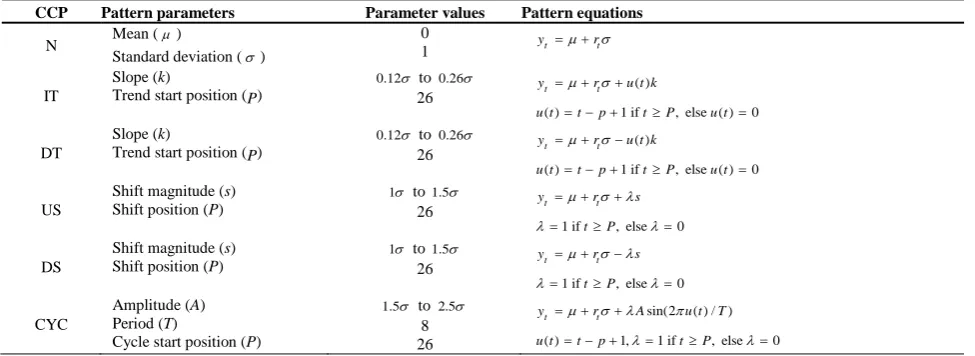
(=100×1000×6) sample patterns (consisting of all the six types of patterns in equal number) were generated from 100,000 series of standard normal variates. The equations along with the corresponding parameters used for simulating the six basic CCPs, are given in Table 2. In these equations, t (= 1,2,…,100) represents discrete time point at which a data is sampled, and rt and yt
represent random value of a standard normal variate and the sample value, respectively, at the th time point. Except for the normal pattern, each sample in the other five unnatural patterns starts from in-control condition and out-of-control conditions occuring after the change point. Moreover, to evaluate the adaptive capability of recognizer, the values of different parameters for the unnatural patterns are randomly varied in a uniform manner between the presented limits.
Recognition accuracy (RA) of the presented method is introduced through confusion matrix in Table 3. Results for classification of normal patterns (100%) prove that the type I error probability for proposed recognizer is zero. It can be seen that there is a tendency for the shift patterns to be mostly confused with trend. The presented recognizer misclassifies about 25% of shift patterns as trend. Shift patterns are hardest to be classified (75.2%). Recognition accuracy of method is governed by the pattern parameters (slope for the trend pattern, magnitude for the shift pattern and the amplitude and the period for the cycle). For example, there is a much higher probability for the proposed method to recognize cycle patterns with small amplitude and shift patterns with small magnitude as normal.
Another measure used to evaluate and compare CCP recognizers is the average run length (ARL). The ARL is defined as the expected number of samples taken until an out-of-control signal is given [1].
Figure 2. Steps of the decision making process
Figure 3. The concept of moving window approach Receiving a new
observation (xt)
Updating the probability of each pattern (Beliefs):
Estimating pattern parameters
Calculating residuals (rit) Updating beliefs (Bit)
Decision making:
Finding Bgt
TABLE 2. Equations and parameters for CCP simulation
CCP Pattern parameters Parameter values Pattern equations
N Mean ()
Standard deviation ()
0
1 yt rt
IT
Slope (k)
Trend start position (P)
0.12 to 0.26
26
( )
( ) 1 if , else ( ) 0
t t
y r u t k
u t t p t P u t
DT
Slope (k)
Trend start position (P)
0.12 to 0.26
26
( )
( ) 1 if , else ( ) 0
t t
y r u t k
u t t p t P u t
US
Shift magnitude (s) Shift position (P)
1 to 1.5
26
1 if , else 0
t t
y r s
t P
DS
Shift magnitude (s) Shift position (P)
1 to 1.5
26
1 if , else 0
t t
y r s
t P
CYC
Amplitude (A) Period (T)
Cycle start position (P)
1.5 to 2.5
8 26
sin(2 ( ) / )
( ) 1, 1 if , else 0
t t
y r A u t T
u t t p t P
The monitoring method should generate signals as quickly as possible (i.e. shorter ARLs) if the production process is out of control and as late as possible if the production process is in control. ARLs of the presented method compared with some other methods are introduced in Table 4.
We now compare the relative performances of the proposed method and some existing ANN-based methods. Table 4 and 5 contain the performance of the presented method comparing with some ANN-based methods. It can be seen that except for shift pattern, the presented method has the most accurate results (see Table 4). For instance, the proposed method outperforms the ANN-based CCP recognizer by Cheng & Cheng [19]. The RAs of Cheng & Cheng [19] are 98.50 percent, 84.80 percent, 76.50 percent and 87.00 percent for normal, trend, shift and cycle patterns, respectively (extracted from Table 4 of the work of Cheng & Cheng [19]). From Table 5 we conclude that although the speed of the presented method is satisfactory, it detects unnatural patterns slower than recent ANN-based methods. Therefore we can conclude that the presented method provides better discriminant capability than ANN-base methods at the expense of recognition speed.
The study on how to improve the accuracy of method on recognizing shift patterns from trend patterns and how to improve its speed could be done in future research.
TABLE 3. Confusion matrix
Normal (%) Trend (%) Shift (%) Cycle (%)
Normal 100.0 0.0 0.0 0.0
Trend 0.0 100.0 0.0 0.0
Shift 0.0 24.8 75.2 0.0
Cycle 0.0 0.0 0.0 100.0
TABLE 4. Recognition accuracy (RA) of the presented method and some ANN-based methods
Normal (%)
Trend (%)
Shift (%)
Cycle (%)
RA from Cheng
[18] - 78.95 82.30 90.00
RA from Guh &
Tannock [24] - 61.00 61.60 87.91
RA from Guh
[45] - 87.50 89.50 94.00
RA from Guh
[21] - 79.00 91.50 94.00
RA from Cheng &
Cheng [19]
98.50 84.80 76.50 87.00
RA of the
Presented method 100.00 100.00 75.20 100.00
TABLE 5. ARLs of the presented method and some ANN-based methods
Trend Shift Cycle
RA from Cheng [18] 19.65 27.30 -
RA from Guh & Tannock [24] 9.45 9.39 9.40
RA from Guh [45] 9.8 7.2 10.32
RA from Guh [21] 7.39 6.50 8.52
RA from Cheng & Cheng [19] - -
-RA of the Presented method 15.42 28.76 20.43
5. CONCLUSION AND RECOMMENDATIONS FOR FUTURE RESEARCH
The basis of this approach is to select the pattern with the greatest probability of presence. However, this probability, called belief, is required to validate a stopping condition. In case where none of the beliefs validate the condition, another observation is got to update the beliefs.
In this paper, first, the advantages and disadvantages of different CCP recognition techniques were studied. Then, the steps of method were explained in detail. Next, the adopted approach of moving window was clarified. Finally some simulation studies based on moving window recognition approach was performed to prove that the proposed method has high accuracy for solving the CCP recognition problem.
The proposed CCP recognizer gives highly accurate results with satisfactory ARLs. Compared with ANN-based methods, interpretable results reached by this method are not based on training samples and will be more reliable.
There are several directions for future research:
Only six types of single control chart patterns were studied in this research. The other types of single patterns and concurrent patterns could be studied in future researches.
Future research could address the study on how to improve the accuracy of method on recognizing shift patterns from trend patterns and how to improve its speed.
Determining the optimum control threshold of the beliefs is an interesting subject for research.
It was assumed that the process follows normal distribution. In practice it is possible that the quality characteristic follow any other distribution. The other probability distributions are desired for further research.
The effect of pattern parameters magnitudes in the performance of method is another research area.
Some techniques (e.g. wavelet analysis) could be joined to this method to improve its discrimination capability.
Future research can combine this approach with other ones (like ANN) to present a hybrid system for CCP recognition.
The ability to interpret a particular pattern in terms of assignable cause requires experience and knowledge of the process. The presented method may be supplemented with an automated decision algorithm (such as a rule-based expert system) to diagnose the assignable causes of an unnatural pattern.
6. REFERENCES
1. Hachicha, W. and Ghorbel, A., "A survey of control-chart pattern-recognition literature (1991–2010) based on a new conceptual classification scheme", Computers & Industrial Engineering, Vol. 63, No. 1, (2012), 204-222.
2. Nelson, L.S., "Column: Technical aids: The shewhart control chart--tests for special causes", Journal of Quality Technology, Vol. 16, No. 4, (1984).
3. Nelson, L.S., "Interpreting shewhart x-bar control chart",
Journal of Quality Technology, Vol. 17, (1985), 114-117. 4. Palm ,A.C., "Tables of run length percentiles for determining the
sensitivity of shewhart control charts for averages with supplementary runs rules", Journal of Quality Technology, Vol. 22, No. 4, (1990), 289-298.
5. Lucy-Bouler, T., "Problems in control chart pattern recognition systems", International Journal of Quality & Reliability Management, Vol. 10, No. 8, (1993).
6. Swift, J.A., Development of a knowledge-based expert system for control-chart pattern recognition and analysis, (1987), Oklahoma State Univ ,.Stillwater, OK (USA).
7. Cheng, C.-S., "Group technology and expert systems concepts applied to statistical process control in small-batch manufacturing", (1989).
8. Cheng, C.-S. and Hubele, N.F., "Design of a knowledge-based expert system for statistical process control", Computers & Industrial Engineering, Vol. 22, No. 4, (1992), 501-517. 9. Yang, M.-S. and Yang, J.-H., "A fuzzy-soft learning vector
quantization for control chart pattern recognition", International Journal of Production Research, Vol. 40, No. 12, (2002), 2721-2731.
10. Zarandi, M.F., Alaeddini, A. and Turksen, I., "A hybrid fuzzy adaptive sampling–run rules for shewhart control charts",
Information Sciences, Vol. 178, No. 4, (2008), 1152-1170. 11. Gauri, S.K. and Chakraborty, S., "Recognition of control chart
patterns using improved selection of features", Computers & Industrial Engineering, Vol. 56, No. 4, (2009), 1577-1588. 12. Jiang, P., Liu, D. and Zeng, Z., "Recognizing control chart
patterns with neural network and numerical fitting", Journal of Intelligent Manufacturing, Vol. 20, No. 6, (2009), 625-635. 13. Al-Ghanim, A.M. and Kamat, S.J., "Unnatural pattern
recognition on control charts using correlation analysis techniques", Computers & Industrial Engineering, Vol. 29, No. 1, (1995), 43-47.
14. Yang, J.H. and Yang, M.S., "A control chart pattern recognition scheme using a statistical correlation coefficient method",
Computers and Industrial Engineering, Vol. 48, No., (2005), 205-221.
15. Al-Assaf, Y., "Recognition of control chart patterns using multi-resolution wavelets analysis and neural networks", Computers & Industrial Engineering, Vol. 47, No. 1, (2004), 17-29. 16. Anagun, A., "A neural network applied to pattern recognition in
statistical process control", Computers & Industrial Engineering, Vol. 35, No. 1, (1998), 185-188.
17. Chang, S. and Aw, C., "A neural fuzzy control chart for detecting and classifying process mean shifts", International Journal of Production Research, Vol. 34, No. 8, (1996), 2265-2278.
18. Cheng, C.-S., "A neural network approach for the analysis of control chart patterns", International Journal of Production Research, Vol. 35, No. 3, (1997), 667-697.
19. Cheng, H.-P. and Cheng, C.-S., "Control chart pattern recognition using wavelet analysis and neural networks",
Journal of Quality, Vol. 16, No. 5, (2009), 311-321.
20. Gauri, S.K., "Control chart pattern recognition using feature-based learning vector quantization", The International Journal of Advanced Manufacturing Technology, Vol. 48, No. 9-12, (2010), 1061-1073.
International Journal of Pattern Recognition and Artificial Intelligence, Vol. 18 ,No. 02, (2004), 75-99.
22. Guh, R.-S. and Hsieh, Y.-C., "A neural network based model for abnormal pattern recognition of control charts", Computers & Industrial Engineering, Vol. 36, No. 1, (1999), 97-108. 23. Guh, R.-S. and Shiue, Y.-R., "On-line identification of control
chart patterns using self-organizing approaches", International Journal of Production Research, Vol. 43, No. 6, (2005), 1225-1254.
24. Guh, R.-S. and Tannock, J., "Recognition of control chart concurrent patterns using a neural network approach",
International Journal of Production Research, Vol. 37, No. 8, (1999), 1743-1765.
25. Guh, R.-S., Zorriassatine, F., Tannock, J. and O'Brien, C., "On-line control chart pattern detection and discrimination—a neural network approach", Artificial Intelligence in Engineering, Vol. 13, No. 4, (1999), 413-425.
26. Hassan, A., Baksh, M.S.N., Shaharoun, A.M. and Jamaluddin, H., "Improved spc chart pattern recognition using statistical features", International Journal of Production Research, Vol. 41, No. 7, (2003), 1587-1603.
27. Hwarng, H. and Chong, C., "Detecting process non-randomness through a fast and cumulative learning art-based pattern recognizer", International Journal of Production Research, Vol. 33, No. 7, (1995), 1817-1833.
28. Hwarng, H.B. and Hubele, N.F., "Back-propagation pattern recognizers for x control charts: Methodology and performance", Computers & Industrial Engineering, Vol. 24, No. 2, (1993), 219-235.
29. Hwarng, H.B. and Hubele, N.F., "X control chart pattern identification through efficient off-line neural network training",
IIE transactions, Vol. 25, No. 3, (1993), 27-40.
30. Pacella, M., Semeraro, Q. and Anglani, A., "Adaptive resonance theory-based neural algorithms for manufacturing process quality control ,"International Journal of production research, Vol. 42, No. 21, (2004), 4581-4607.
31. Perry, M.B., Spoerre, J.K. and Velasco, T., "Control chart pattern recognition using back propagation artificial neural networks", International Journal of Production Research, Vol. 39, No. 15, (2001), 3399-3418.
32. Pham, D. and Chan, A., "Control chart pattern recognition using a new type of self-organizing neural network", Proceedings of the Institution of Mechanical Engineers, Part I: Journal of Systems and ControlEngineering, Vol. 212, No. 2, (1998), 115-127.
33. Pham, D. and Chan, A., "Unsupervised adaptive resonance theory neural networks for control chart pattern recognition",
Proceedings of the Institution of Mechanical Engineers, Part B: Journal of Engineering Manufacture, Vol. 215, No. 1, (2001), 59-67.
34. Pham, D. and Oztemel, E., "Xpc: An on-line expert system for statistical process control", The International Journal Of Production Research, Vol. 30, No. 12, (1992), 2857-2872. 35. Pham, D. and Oztemel, E., "Control chart pattern recognition
using learning vector quantization networks", The International Journal of Production Research, Vol. 32, No. 3, (1994), 721-729.
36. Pham, D. and Wani, M., "Feature-based control chart pattern recognition", International Journal of Production Research, Vol. 35, No. 7, (1997), 1875-1890.
37. Wang, C.-H. and Kuo, W., "Identification of control chart patterns using wavelet filtering and robust fuzzy clustering",
Journal of Intelligent Manufacturing, Vol. 18, No. 3, (2007), 343-350.
38. Wani, M. and Pham, D., "Efficient control chart pattern recognition through synergistic and distributed artificial neural networks", Proceedings of the Institution of Mechanical Engineers, Part B: Journal of Engineering Manufacture ,Vol. 213, No. 2, (1999), 157-169.
39. Wong, M., Jack, L. and Nandi, A., "Modified self-organising map for automated novelty detection applied to vibration signal monitoring", Mechanical Systems and Signal Processing, Vol. 20, No. 3, (2006), 593-610.
40. Eshragh, J. and Niaki, S., "The application of decision on beliefs in response surface methodology", in Proceedings of the 4th International Industrial Engineering Conference, Tehran, Iran, (2006).
41. Niaki, S.T.A. and Nezhad, M.S.F" ,.Decision-making in detecting and diagnosing faults of multivariate statistical quality control systems", The International Journal of Advanced Manufacturing Technology, Vol. 42, No. 7-8, (2009), 713-724. 42. Eshragh, A. and Modarres, M., "A new approach to distribution fitting: Decision on beliefs", Journal of Industrial and Systems Engineering, Vol. 3, No. 1, (2009), 56-71.
43. Wang, C.-H., Dong, T.-P. and Kuo, W., "A hybrid approach for identification of concurrent control chart patterns", Journal of Intelligent Manufacturing, Vol. 20, No. 4, (2009), 409-419. 44. Wang, C.-H., Kuo, W. and Qi, H., "An integrated approach for
process monitoring using wavelet analysis and competitive neural network", International Journal of Production Research, Vol. 45, No. 1, (2007), 227-244.
45. Guh, R.-S., "Robustness of the neural network based control chart pattern recognition system to non-normality",
A New Statistical Approach for Recognizing and Classifying Patterns of
X
Control Charts
RESEARCH NOTE
M. Kabiri naeinia, M. S. Owliab, M. S. Fallahnejadb
a Department of Industrial Engineering, Payam Noor University, Yazd, Iran b Department of Industrial Engineering, Yazd University, Yazd, Iran
P A P E R I N F O
Paper history:
Received 19 September 2014 Received in revised form 10 April 2015 Accepted 11 June 2015
Keywords:
Statistical Process Control Control Chart
Pattern Recognition Bayes Rule
Maximum Likelihood Estimation
هديكچ
کینکت هدرتسگ تروص هب لرتنک رادومن رد وگلا صیخشت یاه یم هدافتسا دنیارف لئاسم ییاسانش یارب هتفرشیپ عیانص رد یا
-کینکت اریخا .دوش کی یارب بسانم یرامعم نتفای اما .تسا هتفای یرایسب جاور راک نیا یارب یبصع هکبش رب ینتبم یاه
تیهام لیلد هب هولاع هب .تسا هدننک لسک و ربنامز یرما ،نآ شزومآ دنیارف زین و یبصع هکبش رب ینتبم هدنهد صیخشت "
هبعج
هایس " یجورخ ،یبصع هکبش وت اب .دنتسین ریسفت لباق نآ یاه
میمصت درکیور کی هلاقم نیا رد ،تلاکشم نیا هب هج یریگ
هقبط و صیخشت یارب یرامآ یم هئارا راب سکیا رادومن یاهوگلا یدنب
،دنیارف دیدج تادهاشم تفایرد اب شور نیا رد .دوش
یم هبساحم وگلا یاهرتماراپ زا ییامنتسرد رثکادح یاهرگدروآرب بم هدنوش رارکت درکیور کی رد سپس و دوش
،زیب هدعاق رب ینت
سدح یم یناسرزورب لرتنک رادومن رد وگلا ره دوجو هبطوبرم یاه سدح زا یکی هاگره تیاهن رد .دوش
هدش یناسرزورب یاه
یم رداص وگلا دوجو لانگیس کی ،دش رتشیب صخشم هناتسآ دح زا هیبش هعلاطم .دوش
کرحتم هرجنپ درکیور یانبم رب یزاس
ر تعرس و تحص یبایزرا یارب شور زا یدادعت اب هسیاقم رد شو
یم ناشن جیاتن .تفرگ ماجنا یبصع هکبش رب ینتبم یاه دهد
حیحص جیاتن یداهنشیپ شور هک یم هئارا یرت
شور نیا رد شزومآ هب یزاین هولاع هب و دنتسه ریذپ ریسفت جیاتن نیا .دهد
یمن .دشاب