!
∀# #∃!# %&∋(# #
! )∗! ∀!(#
!%%+,) !∀!−,./,
UNDERSTANDING OBJECT FEATURE BINDING THROUGH EXPERIMENTATION AS A PRECURSOR TO MODELLING
C. MAIR, M. SHEPPERD, M. CARTWRIGHT, C. KIRSOPP, AND D. HEATHCOTE ESERG, School of Design, Engineering and Computing, Bournemouth University, UK.
Email: [email protected]
In order to explore underlying brain mechanisms and to further understand how and where object feature binding occurs, psychophysical data are analysed and will be modelled using an attractor network. This paper describes psychophysical work and an outline of the proposed model. A rapid serial visual processing paradigm with a post-cue response task was used in three experimental conditions: spatial, temporal and spatio-temporal. Using a ‘staircase’ procedure, stimulus onset asynchrony for each observer for each condition was set in practice trails to achieve ~50% error rates. Results indicate that spatial location information helps bind objects features and temporal location information hinders it. Our expectation is that the proposed neural model will demonstrate a binding mechanism by exhibiting regions of enhanced activity in the location of the target when presented with a partial post-cue. In future work, the model could be lesioned so that neuropsychological phenomena might be exhibited. In such a way, the mechanisms underlying object feature binding might be clarified.
1 Introduction
Working memory (WM) can be described as a system for temporarily holding and manipulating information required to perform cognitive tasks (Baddeley, 1986). Prefrontal cortex (PFC) plays an important role in WM. Neurons in PFC exhibit sustained activity in the period between presentation of a stimulus and a delayed response (Funahashi et al., 1990). Ungerleider, Courtney et al. (1998) claim that PFC neurons reactivate representations in posterior visual areas via feedback projections, and integrate objects through multiple reverbatory neural assemblies (Raffone and Wolters, 2001).
Perception of incorrect combinations of registered features is known as illusory conjunction (IC). ICs are likely to occur from a failure to focus attention (Treisman, 1996), when multiple objects are present, and with proximity (Cohen and Ivry, 1991). In support of location-based binding, Prinzmetal et al. (1986) found that ICs are less likely to occur when attention is directed by a cue to a point in space.
In most circumstances, feature binding is not a problem for the nervous system, yet it remains an intriguing conceptual problem for neuroscientists. The present study attempts to lead to a further understanding of object feature binding by addressing some of the issues outlined above and testing the following hypotheses. If binding is driven by spatial location (Treisman and Gelade, 1980; Cave and Zimmerman, 1997), fewer errors should be recorded when stimuli are presented at different spatial locations, than when presented at the same spatial location. Objects appearing spatially closer to the target should be erroneously reported as the target more frequently than objects appearing more distant from the target. In addition, objects appearing temporally closer to the target should be reported as the target in error more frequently than objects appearing more distant in time from the target. If ICs are more likely to occur when multiple objects are present, and with proximity (Cohen and Ivry, 1991) there should be a greater occurrence of ICs than chance in all conditions, and more adjacent than distant ICs.
2 Experiment
A within subjects post-cue response task was designed using a battery of sixty-four objects comprising three features in three conditions.
2.1 Method 2.1.1 Stimuli
2.1.2 Design and Procedure
Fifteen volunteer adults with normal or corrected vision took part. The three experimental conditions were spatial (SC) (simultaneous at four fixed locations), temporal (TC) (sequential at focal point), and spatio-temporal (STC) (sequential at four fixed locations). Each condition comprised 64 presentations, in each of which a unique set of four objects was pseudo-randomly selected from the battery of 64 objects, to ensure each feature had an equal probability of selection. Within each display set of 4, each object contained each feature once and only once.
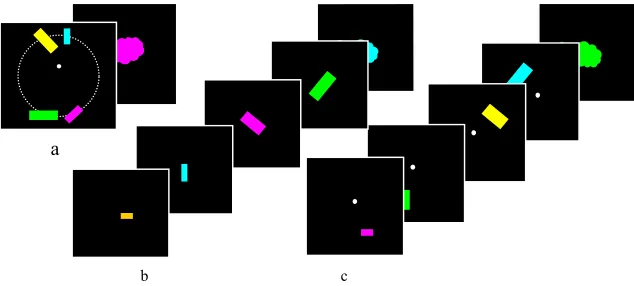
In SC, the 4 objects were presented simultaneously, each in 1 of 4 positions on the circumference of an imaginary circle (Fig.1a) preceded and followed by a checkerboard mask. In TC, the 4 objects were presented sequentially in the focal position separated by a checkerboard mask. In STC, the 4 objects were presented sequentially in the same positions as in SC, separated by the checkerboard mask.
When each set of 4 objects had been displayed, the post cue: a coloured ‘cloud shape’ was presented, and the observers were asked to report the size and orientation of the perceived target (Fig.2). In STC, 2 datasets were collected: one for spatial responses (STCs) and one for temporal responses (STCt).
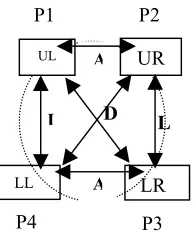
In SC and STCs, a response corresponding to a feature of the object horizontal to the target was recorded as adjacent (A); a response corresponding to a feature of the object vertical to the target was recorded as lateral (L); and a response corresponding to a feature of the object diagonal to the target was recorded as distant (D) (Fig. 1a). In TC and STCt, a response corresponding to a feature of the object +1 or –1 to the target was recorded as adjacent (A); a response corresponding to a feature of the object +2 or -2 to the target was recorded as intermediate (D1); and a response corresponding to a feature of the object +3 or -3 to the target was recorded as distant (D2) (Fig. 1b).
P2 P1
L
LR
LL
D L
A A UR
UL
P3 P4
Figure 1a Error coding for spatial (SC and STC) display. P1=position1, P2=position2, P3=position3, P4=position4. UL=upper left, UR=upper right, LR=lower right, LL=lower left.
D2 D1 A T D1 A T A
A T A D1 A D1 D2
a b c d
T
Figure 1b. Error coding temporal (TC) display. Target shown as solid. Arrows indicate sequence. T=target, A=adjacent, D1=intermediate, D2=distant
c
a
LL
b c
Figure 2. a) Spatial display in which the correct response is the object in position 3 (lower right (LR)); b) Temporal display in which the correct response is the object in position 2; c) Spatio-temporal display in which the correct response is the object in Spatio-temporal position 2, spatial position 4 (lower left (LL)) . Mask not shown. Circumference shown for illustration only.
Observers were instructed to focus on the centre of the screen indicated by a white dot. Response time was not recorded. Observers carried out 64 trials in each condition to set the error level at 50% for each feature. In order to avoid floor or ceiling effects, the ‘staircase procedure1’ was used to determine the SOA independently for each condition for each observer.
3 Results
Recordings were collected in as 4 datasets: SC, TC and STC space (STCs) and STC time (STCt). Statistical analyses were carried out using t-tests to make pair-wise comparisons of error position (e.g. spatial errors in SC and STCs, A/D, A/L and L/D, and temporal errors in TC and STCt, A/D1, A/D2 and D1/D2) and between conditions for specific error positions (e.g. between SC and STCs A/A, D/D and L/L, and between TC and STCt A/A, D1/D1 and D2/D2).
1
Thus 18 t-tests were conducted. Using the Bonferroni adjustment, alpha was reduced from p=0.05 to p= 0.003.
3.1 SOA
Mean SOA for SC was 139ms, for TC 172 ms, and for STC 137 ms. This resulted in mean presentation duration of 417ms in SC, 1548 in TC, and 1233 in STC).
3.2 Spatial and temporal errors
A total of 7680 responses were recorded (4 datasets: SC spatial, TC temporal, STC spatio-temporal-space and STC spatio-temporal-time, 64 presentations, 2 features each, 15 observers). Despite setting SOA to achieve 50% error rate for each error type, there were significantly more temporal than spatial errors (p<0.001). In addition, there were significantly more errors in STCs than SC (p<0.001). There were also more errors in TC than STCt, but using the Bonferroni adjustment, this difference was not significant (p=0.005). Observers had an equal chance (33%) of making each type of spatial error, but a 50% chance of making temporally adjacent error, 33.3% chance of a temporally intermediate error, and 16.7% chance of a temporally distant error. The greatest number of errors (1028) were recorded in TC (7% more than expected), the fewest (734) in SC (24% fewer than expected), 953 errors were recorded in STC (1% less than expected).
3.3 Adjacent and distant errors
‘Expected’ values were determined by setting the SOA to achieve a 50% error rate for each observer in each condition. Overall, there were more adjacent (1673) errors and more distant (773) errors (p=0.004 and p=0.008). In SC, lateral and temporally intermediate errors (1146) were not significantly greater than expected. In STCs, that is the recording of spatial errors in STC, actual adjacent errors were significantly greater (p<0.001) than expected, but distant errors were not (p=0.005). Spatially adjacent errors between conditions (SC and STC) were significantly greater in STCs than SC (p<0.001), but after Bonferroni adjustment there was no significant difference between spatially distant errors (p=0.02). Differences between conditions for temporal errors (TC and STCt) were not significantly different, but in both conditions, temporal errors of all types were greater than expected: adjacent errors in both TC and STCt (p<0.001); intermediate errors in TC (p=0.004), intermediate errors in STCt (p<0.001); distant errors in TC (p=0.012) and in STCt (p=0.006).
3.4 Error effects
difference between A-L, A-D, and L-D errors. The temporal positional effect is defined as A-(D1+D2). The spatial error effect (between SC and STCs) is a result of temporal properties; the temporal error effect (between TC and STCt) is a result of spatial properties (Table 1).
SPATIAL TEMPORAL
A-L A-D L-D A - (D1+D2)
SC 35 35 0 TC 52
STC 142 90 -52 STC 52
Temporal effect 107 55 52 Spatial effect 0
Table 1. Spatial and temporal error effect
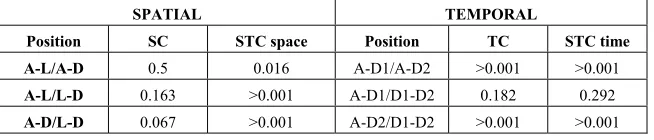
Error effects in STCs were highly significant. Temporal error effects in both TC and STCt were highly significant at A-D1/A-D2 and A-D2/D1-D2 (Table 2). To compare spatial and temporal error positional effects, comparisons were made between SC and STCs, and TC and STCt. Spatial error effects were significant only for P1-P2, while temporal error effects were insignificant (Table 3).
SPATIAL TEMPORAL
Position SC STC space Position TC STC time
A-L/A-D 0.5 0.016 A-D1/A-D2 >0.001 >0.001
A-L/L-D 0.163 >0.001 A-D1/D1-D2 0.182 0.292
A-D/L-D 0.067 >0.001 A-D2/D1-D2 >0.001 >0.001 Table 2. One-tailed t-test results for significance between effect of positional error.
Position SC-STCs Position TC-STCt
A-L 0.004 A-D1 0.458
A-D 0.158 A-D2 0.067
L-D 0.1 D1-D2 0.225
Table 3. One-tailed t-tests for effect of spatial and temporal positional error.
3.5 Illusory Conjunctions (ICs)
4 Discussion
Displays in TC and STC had longer durations than SC. To remove effects of primacy and recency on recall, SOA was set a priori to achieve 50% in each condition. More errors were made when objects were presented at the same spatial location (TC) than when they were presented at individual locations (SC and STC). When objects were presented at different locations, but were separated in time (STC), there were fewer temporal errors than in TC, and more spatial errors than in SC. This implies that separating objects in space aids integration in recall, whereas separating objects in time is detrimental. Most errors were adjacent in both space and time, but spatially adjacent errors were highly significantly greater when objects were presented sequentially (STC) than when presented simultaneously (SC). The spatial error effect was more than three times greater than the temporal error effect. The temporal positional error effect (A-(D1+D2)) was equal, whereas the spatial positional error effect was insignificant between positions in SC, but significant for all positions in STC.
Results from this study suggest location information is important for binding, but it is most important when objects are not separated in time. Indeed, Keele et al. (1988) claimed that although location is primary, time of stimulus occurrence must be taken into account.
Saiki (2003) claims that location-based integration applies only to static objects. In TC and STC stimuli were presented sequentially with brief exposure. The stimuli might have been perceived as moving and therefore not correctly retained as integrated objects in memory.
According to earlier research (e.g. Cohen and Ivry (1991)) ICs occur mostly when multiple objects are present, and with proximity. However, ICs were not significantly greater than chance in any condition, but more ICs occurred mostly in TC and STCt, and more were adjacent than distant.
To more fully explore the data from this experiment and ultimately to further understand the mechanisms of object feature binding, a neural model is under development. The following sections describe the early stages of development and potential future modifications of the proposed model.
5 The neural model under development
Membrane potential is reset after each spike, therefore in order to maintain activity in the absence of a stimulus, real neurons feedback on themselves. This can be represented in an autoassociative network model with collateral recurrent connections tuned to avoid the possibility of each node becoming active once a subset is activated. In addition, to enhance biological plausibility, the nodes should represent integrate and fire (IF) neurons
The model is defined following Trappenberg (2002), Rolls and Deco (2002) and Rolls and Treves (1998). Nodes have diluted connectivity to give a non-symmetric synaptic matrix generated by Hebbian learning on random patterns, and the activation function is threshold linear to enable continuously variable firing rates. Weights are initialised to random values before learning starts. Inputs are mainly excitatory and mutual inhibition is implemented by inhibitory interneurons which comprise 10% of the 10,000 network nodes. The basic architecture is a one-layer (2-D) network of N*N nodes with a set of inputs that make modifiable excitatory synapses with the output neurons. The output cells compete by means of the softmax function (Bridle, 1990), and at each time step, all nodes are simultaneously updated by random sequence. Spatial location is an important factor in the current study and is represented in the model as ‘the centre of mass of an activity packet’ (Trappenberg, 2002, p.209).
6 Conclusion
Psychophysical results from this and other studies have shown spatial information helps bind object features. By analysing output from the proposed neural model it might be possible to determine the dynamics of spatial and temporal errors, particularly in the spatio-temporal condition when objects have neither a unique spatial nor temporal location and it was shown that correct recall is impoverished by temporal properties and enhanced by spatial ones. In addition, understanding how memories develop into stable states, might lead to a better understanding of how temporal location properties are stored and whether they are transferred to spatial location properties in recall.
Further analyses of the psychophysical data and the model are planned. For example, because of its architecture, output from the basic model will demonstrate rapid and correct recall. However, humans make binding errors, and responses from observers in the experiment described earlier were tuned to achieve a 50% error rate. Therefore, the neural model will have to be adapted in order that it too achieves a 50% error rate. Further analyses should determine whether a particular feature (orientation or size) is dominant in binding, and if so, how do the dimensions of that feature impact on recall? What is the effect of the post-cue presentation on target recall in the following presentation? Futhermore, an experiment, incorporating a simple verbal activity could be conducted so that verbalization, which in some cases has been shown to enhance recall (Stefurak and Boynton, 1986; Johnson et al. 2002) of object features would not be possible.
Despite continued effort in the research community and a large literature on binding, the mechanisms that allow individual features to be bound rapidly and, for the most part, correctly into composite objects remain poorly understood. The aim of the work in hand is to elucidate on these mechanisms.
REFERENCES
Baddeley, A. D. (1986). Working Memory. NY, OUP.
Bridle, J. S. (1990). Probabilistic interpretation of feedforward classification network outputs, with relationships to statistical pattern recognition. Neurocomputing: Algorithms, Architectures & Applications. F. Fogelman Soulie & J. Herault (Eds.). N.Y., Springer Verlag.
Cave, K. R. & J. M. Zimmerman (1997). "Flexibility in spatial attention before & after practice." Psych. Sci. 8: 399-403.
Funahashi, S., C. J. Bruce, et al. (1990). "Visuospatial coding in primate prefrontal neurons revealed by oculomotor paradigms." J. Neurophys. 63: 814. Johnson, T. R., W. Hongbin, et al. (2002). "A model of spatio-temporal coding of memory for multidimensional stimuli." In Proceedings of the 24th Annual Conference of the Cognitive Science Society. Fairfax, Virginia, Hillsdale, NJ: Lawrence Erlbaum.
Keele, S. W., A. Cohen, et al. (1988). "Tests of a Temporal Theory of Attentional Binding." J.E.P. HPP 14(3): 444-452.
Nissen, M. J. (1985). Accessing features & objects. Attn. & Perf. XI. M. I. Posner & O. S. M. Marin. Hillsdale (Eds.), N.J., Lawrence Erlbaum Ass. Prinzmetal, W., D. E. Presti, et al. (1986). "Does attention affect visual feature integration?" J.E.P. HPP 12: 361-369.
Raffone, A. & G. Wolters (2001). "A cortical mechanism for binding in visual working memory." J. Cog. Neurosci. 13: 766-785.
Reinitz, M. T., W. J. Lammers, et al. (1985). "Memory conjunction errors." Mem. & Cog. 20(1): 1-11.
Renart, A., N. Parga, et al. (2000). A recurrent model of the interaction between the prefrontal cortex & inferior temporal cortex in delay memory tasks.
Advances in Neural Information Processing Systems. S. Solla, T. Leen & K. R. Mueller (Eds). Camb., Mass., MIT Press. 12: 171-177.
Rolls, E. T. & G. Deco (2002). Computational Neuroscience of Vision. OUP. Rolls, E. T. & A. Treves (1998). Neural Networks & Brain Function. OUP. Saiki, J. (2003). "Spatiotemporal characteristics of dynamic feature binding in visual working memory." Vis. Res. 43: 2107-2123.
Stefurak, D. l. & R. M. Boynton (1986). "Independence of memory for
categorically different colours & shapes." Perc. & Psychophys. 39(3): 164-174. Trappenberg, T. P. (2002). Fundamentals of Computational Neuroscience. OUP. Treisman, A. (1977). "Focussed attention in the perception & retrieval of multidimensional stimuli." Perception & Psychophysics, 22, 1-11 22: 1-11. Treisman, A. (1996). "The binding problem."Curr. Op.Neurobio. 6(2): 171-178. Treisman, A. & G. Gelade (1980). "A feature-integration theory of attention." Cog. Psych. 12(1): 97-136.
Ungerleider, L. G., S. M. Courtney, et al. (1998). "A neural system for human visual working memory." Proc. Nat. Acad. of Sci. U S A. 1998 95(3): 883-890. Vogel, E. K., G. F. Goodman, et al. (2001). "Storage of features, conjunctions, & objects in visual working memory." J.E.P. HPP 27(1): 92-114.