www.ann-geophys.net/33/471/2015/ doi:10.5194/angeo-33-471-2015
© Author(s) 2015. CC Attribution 3.0 License.
Analysis of the enhanced negative correlation between electron
density and electron temperature related to earthquakes
X. H. Shen, X. Zhang, J. Liu, S. F. Zhao, and G. P. Yuan
Institute of Earthquake Science, China Earthquake Administration, 100036 Beijing, China
Correspondence to: X. Zhang ([email protected])
Received: 15 September 2014 – Revised: 12 February 2015 – Accepted: 16 March 2015 – Published: 20 April 2015
Abstract. Ionospheric perturbations in plasma parameters have been observed before large earthquakes, but the corre-lation between different parameters has been less studied in previous research. The present study is focused on the rela-tionship between electron density (Ne) and temperature (Te)
observed by the DEMETER (Detection of Electro-Magnetic Emissions Transmitted from Earthquake Regions) satellite during local nighttime, in which a positive correlation has been revealed near the equator and a weak correlation at mid- and low latitudes over both hemispheres. Based on this normal background analysis, the negative correlation with the lowest percent in allNeandTepoints is studied before
and after large earthquakes at mid- and low latitudes. The multiparameter observations exhibited typical synchronous disturbances before the Chile M8.8 earthquake in 2010 and the Pu’er M6.4 in 2007, and Te varied inversely with Ne
over the epicentral areas. Moreover, statistical analysis has been done by selecting the orbits at a distance of 1000 km and ±7 days before and after the global earthquakes. En-hanced negative correlation coefficients lower than−0.5 be-tweenNeandTeare found in 42 % of points to be connected
with earthquakes. The correlation median values at differ-ent seismic levels show a clear decrease with earthquakes larger than 7. Finally, the electric-field-coupling model is discussed; furthermore, a digital simulation has been carried out by SAMI2 (Sami2 is Another Model of the Ionosphere), which illustrates that the external electric field in the iono-sphere can strengthen the negative correlation inNe andTe
at a lower latitude relative to the disturbed source due to the effects of the geomagnetic field. Although seismic activity is not the only source to cause the inverseNe–Tevariations,
the present results demonstrate one possibly useful tool in seismo-electromagnetic anomaly differentiation, and a
com-prehensive analysis with multiple parameters helps to further understand the seismo–ionospheric coupling mechanism. Keywords. Ionosphere (plasma temperature and density)
1 Introduction
The DEMETER (Detection of Electro-Magnetic Emis-sions Transmitted from Earthquake Regions) satellite was launched on 29 June 2004 in France and operated until 10 December 2010, with an inclination of 98◦ (Cussac et al., 2006). It was a solar-synchronous-orbit satellite, with the lo-cal time of each orbit passing the equator being the same: 10:30 in the daytime and 22:30 in the nighttime. From its records, many ionospheric perturbations related to seismic cases have been detected (Parrot et al., 2006; Sarkar et al., 2007, 2012; Zhang et al., 2009, 2010a, b, 2012a; Zeng et al., 2009; Pisa et al., 2011; Liu et al., 2011). Furthermore, sta-tistical analysis of different parameters has been developed to ascertain the relationship between ionospheric perturba-tions and large earthquakes (Némec et al., 2009; He et al., 2010, 2011; Zhang et al., 2011, 2012b; Parrot, 2012; Pisa et al., 2012; Li and Parrot, 2012). Based on a great amount of data, statistical research can help us to understand the general distribution features of ionospheric perturbations in time and space and to provide more information on their occurrence probability related to earthquakes.
Many papers have shown the correlation characteristics at different local times and conditions of the in situ electron density and temperature (NeandTe) observed by the
472 X. H. Shen et al.: Analysis of the enhanced negative correlation
NeorNi(ion density) andTeduring local daytime is widely
accepted. Some positive correlations have been found dur-ing periods of high solar activity (Kakinami et al., 2011a) and also in the equatorial area at sunset in December (Liu et al., 2007). In earthquake research, Ne and Ni are fre-quently used in case and statistical studies. Only a few papers have focused on Te and ion temperature (Ti). For example,
Oyama et al. (2008) studied the variations in Te observed
by the Hinotori satellite before and after three earthquakes during 1981–1982 and found thatTesignificantly decreased
over the epicenters in the afternoon in the 5 days before and after the earthquakes. Sharma et al. (2013) summarized Ti
and Te variations related to seismic activity during 1995–
1998 over India by using SROSS (Stretched Rohini Satellite Series)-C2 satellite data in the altitude range of 430–630 km, in which significant enhancement had been detected, with 1.2–1.5 times the average normal values of Te and 1.1–1.3
times the normal Ti within a 5◦ window over the
epicen-ters. Sarkar et al. (2012) studied the ionospheric anomalies related to the Haiti earthquake on 12 January 2010, and their results from the DEMETER satellite showed the most im-portant variations inNeandTe1 day before the main shock,
withTe exceeding the upper bound of∼100 K and Ne
ex-ceeding the upper bound by 20 and 9 % during the day- and nighttime, respectively. By using DEMETER satellite data, Zeng et al. (2009) found thatNeandTedecreased to a value
above 20 % during local daytime near the epicenter in the 4 and 5 days prior to the Wenchuan M7.9 earthquake on 12 May 2008 in China.
The big problem in earthquake prediction is the variety of anomalies before and after different earthquakes; a sin-gle kind of precursor is hard to detect in all events. Also, ionospheric perturbations cannot be detected for all earth-quakes. Thus, the sensitivity estimation of precursors is also an important topic in seismological studies. Here, based on the study of the correlation betweenNeandTerecorded by
the Langmuir probe onboard the DEMETER satellite, some short time disturbances with inverseNeandTeare recorded
for the more than 6 years of the DEMETER satellite’s op-erating time. Statistical analysis related to large earthquakes is also carried out. Finally, discussion and conclusions are provided in the last section of the paper.
2 Correlation characteristics ofNeandTeduring local nighttime
2.1 The ISL onboard the DEMETER satellite
The specific scientific objectives of the Langmuir probe in-strument (ISL: Inin-strument Sonde de Langmuir) are designed to map the bulk plasma parameters (primarilyNeandTe) and
to study their variations associated with solid-earth events and other sources of perturbations (Lebreton et al., 2006). The Langmuir probe sweeps at a voltage of±3.81 V. A
com-plete voltage sweep is performed in 1 s to obtain a comcom-plete current–voltage (I–V) characteristic, corresponding to about a 7 km spatial resolution at 710–660 km altitude from the sun-synchronous DEMETER orbit. From the analysis of the I–V characteristics, the plasma parameters are extracted with 1 s time resolution; these areNe,Te,Ni and spacecraft po-tential.
3 Correlation background betweenNeandTe
Due to the strong effects of solar activity during local day-time, local nighttime data is generally employed in earth-quake research to avoid solar and space disturbances. There-fore, here only the correlation betweenNeandTeduring
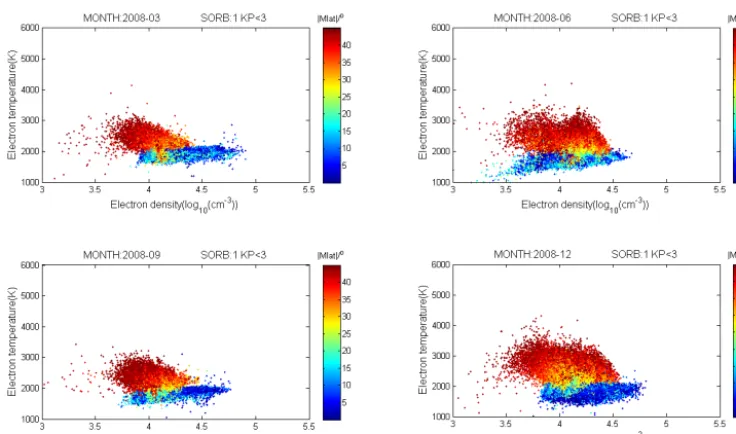
lo-cal nighttime is analyzed. Figure 1 shows the projection of Ne(xaxis) andTe(y axis) at the different geomagnetic
lati-tudes (color scale) in March, June, September and December 2008 (four images labeled 2008-03, 2008-06, 2008-09 and 2008-12). It can be seen that there is seasonal variation inNe
andTe, with the images from March and September being the
same and those from June and December being very similar to each other. Generally, all four seasons’ pictures show that at low latitudesNe changes a lot but Te varies little, while
at midlatitudesNe andTe are dispersed, especially in June
and December. In a previous study, the absolute values ofNe
andTefrom DEMETER were not very accurate, withTe
be-ing much higher than it is supposed to be (Kakinami et al., 2013); therefore, in this paper only the relative variations in NeandTe are taken into account. To reveal the relationship
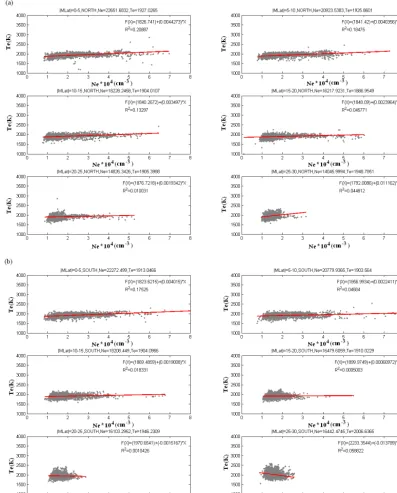
ofNe andTe at different latitudes, Fig. 2 provides the
cor-relation coefficients for March 2008 from a linear function fitting with the equation
R=
n
P
i=1
((Ne)i− ¯Ne)((Te)i− ¯Te)
s
n
P
i=1
((Ne)i− ¯Ne)2 n
P
i=1
((Te)i− ¯Te)2
, with the six diagrams
sepa-rated by a latitude interval of 5◦in the Northern and South-ern Hemisphere (Fig. 2a and b). The results show the weak connection betweenNeandTeduring local nighttime, with a
maximumRof only about 0.4 in the equatorial area of lati-tudes 5◦S–5◦N. With the increase in latitude,R decreased quickly, but it still maintained a positive correlation over both hemispheres. Compared with Hinotori satellite data, af-ter 20:00 LT, bothNeandTefollowed the usual nighttime
de-cay and a positive correlation was detected (Kakanami et al., 2011b), which was also observed using the incoherent scat-ter radar at Saint-Santin (Zhang et al., 2004). Therefore, the weak positive correlation betweenNe andTeis the normal
Figure 1. The distribution of log10(Ne) andTe at different magnetic latitudes (color bar) during quiet geomagnetic periods with Kp < 3 during 4 months (four panels correspond to March, June, September and December) in 2008.
4 Examples of ionospheric perturbations and statistical analysis
4.1 Disturbances in plasma parameters related to earthquakes
Figures 3 and 4 present the plasma variations before the sig-nificant earthquake on 27 February 2010 in Chile with a mag-nitude of 8.8 (72.72◦W, 35.85◦S). Figure 3 corresponds to orbit 30 168, recorded on 20 February 2010 (7 days before the earthquake), and Fig. 4 show orbit 30 256 on 26 February 2010 (1 day before the earthquake) at a distance of 2000 km from the epicenter. Both figures provide the same parameters in the following order (from top to bottom):Ne;Te;Ni(O+), detected by the IAP (Instrument d’Analyse du Plasma) on DEMETER with H+and He+excluded due to their small values; Ex in the ULF (ultra-low frequency) electric field, detected by ICE (Instrument Champ Electrique); and earth-quakes within 2000 km of the satellite orbit during±30 days of the orbite time. It can be seen that, along orbit 30 168_1, NeandNi(O+)diverged from their normally flat variational
trends and decreased over the seismic region of Chile (the disturbances are framed by the blue rectangle), whereas Te
increased in the same region (Fig. 3). Along orbit 30 256_1, NeandNi(O+)modulated over this seismic region andTe
also showed an inverse pattern (Fig. 4). Another anomalous phenomenon in Fig. 4 is that, at the northern conjugate epi-centers of the Chile earthquakes, a step-increasing variation was detected in Ne andNi(O+), while Te decreased. This
kind of variation was also observed before some moderate earthquakes. Figure 5 gives an example along orbit 15 572_1, observed to the north of the epicenter a few hours before the
Pu’er M6.4 earthquake in China on 2 June 2007 (23.03◦N, 101.05◦E), in which a reversed step variation is illustrated betweenTeandNe, whileNi(O+)shows variations of a sim-ilar shape asNe. All of these observations demonstrate that
some coupling processes during the preparation processes of earthquakes lead to the simultaneous variations inNeandTe.
In order to test the sensibility of this kind of anomaly, a sta-tistical analysis needs to be done based on large amounts of data from the DEMETER satellite and many seismic events.
5 Method and statistical analysis
In order to reflect this reversed variation feature betweenNe
andTe during local nighttime before earthquakes, the
float-ing coefficients are calculated for 20 observation points along orbits 15 572_1 and 30 168_1 (Fig. 6). The results show that the normal coefficients are above 0 during local nighttime, which means that the positive correlation between Ne and
Te is limited in time and space. Along 15 572_1, the
max-imal coefficients were near 1.0; however, a quick decrease was exhibited, with R lower than−0.9, around a latitude of 30◦N (Fig. 6a), which was just to the north of the Pu’er epi-center. By contrast, along orbits 30 168_1 and 30 256_1, the coefficients varied significantly, with a few points lower than
−0.5 (Fig. 6b and c), in the southern part of the orbits at 10–50◦S; this illustrates the extensive modulation due to the combined effect of the major earthquake and following after-shocks along the whole Chile seismic rupture fault.
On the basis of the negativeNe–Tecorrelation related to
474 X. H. Shen et al.: Analysis of the enhanced negative correlation
Figure 2. The linear correlation betweenNeandTeat 0–30◦at 5◦latitude intervals over the Southern (a) and Northern (b) Hemisphere (at
the top of each panel, MLat represents the magnetic latitude scale, NORTH/SOUTH means Northern or Southern Hemisphere, andNeand
Teare the averaged values of all the points distributed in that latitude range; the equation in each panel represents the fitted results, in which
xrepresentsNe,f (x)isTeandRis the linear correlation coefficient ofNeandTe).
ofNeandTewith 12–13 observation points at 1◦of latitude
during January 2005 to December 2010. Taking account of the distribution of global main quakes and the effects from polar electrojets at high latitudes, the studied area is limited to ±45◦ of latitude. Figure 7 shows the number of points corresponding to differentRvalues. It can be seen that most points have anRhigher than 0.5, which means thatNeandTe
Figure 3. The observation of plasma parameters from DEMETER
along orbit 30 168 on 20 February 2010 before the Chile M8.8 earthquake on 27 February 2010 (first panel:Ne; second panel:Te;
third panel: the ion density of O+; fourth panel: the electric field Ex; bottom panel: the earthquakes taking place within±30 days relative to the time of this orbit at a distance of 2000 km from the orbit; green squares represent past earthquakes, red triangles mean future earthquakes and open squares are the epicenters at geomag-netic conjugate position).
earthquakes are sudden events with a small probability, earth-quake preparation may be a factor that induces this inverse relationship betweenNeandTe.
Having selected earthquakes with a magnitude greater than 5.0, we select those points for which theRofNe–Teis less
than 5.0. These points are at a distance of 1000 km to the epicenters and were observed within 7 days before and af-ter the earthquake occurrences, suggesting that they are re-lated to the earthquakes. The results show that of the to-tal of 2 357 126 observation points, there are 13 101 points with strong negative correlations betweenNeandTe. In
or-der to reduce the effects of solar activity, the data when Kp > 3+is eliminated, so 6058 points are left in the end. Of these points, 2556 can be connected with earthquakes; this constitutes 42 % of global observation points withR≤ −0.5 inNe–Te. It should be noted that earthquake is only
one kind of factor that leads to a negative correlation be-tweenNe andTe, and there still exist many others in space
[image:5.612.46.288.63.329.2]or ground VLF (very low frequency) transmitters that may produce similar variations. Another problem is that not all earthquakes can excite the same phenomenon in the iono-sphere. In the areas studied, there were 8513 earthquakes
Figure 4. The observation of plasma parameters from DEMETER
on 26 February 2010, 1 day before the Chile M8.8 earthquake on 27 February 2010 (the order of the five panels is the same as in Fig. 3).
with M≥5.0 during 2005–2010, while 7659 earthquakes were in the 5.0≤M< 6.0 range, 611 in the 6.0≤M< 6.5 range, 168 in the 6.5≤M< 7.0 range and 75 had M≥7.0, as listed in Table 1. In order to illustrate the relationship of NeandTewith earthquakes, the median and averagedR
val-ues are calculated for all the data together, and Table 1 ex-hibits a median of 0.812 and an average of 0.694. Then the median and averageR of the points within 3 days of earth-quakes and at a distance of 1000 km from the epicenter of the quakes are computed at different magnitude levels to re-duce the normal background effects. As shown in Table 1, the averagedRvalues are similar to each other at four mag-nitude levels and are also near the average of all global data taken together. However, the medianRvalues decrease com-pared to the first medianRof all points, reducing to 0.683 at magnitudes greater than 7.0. This phenomenon reveals that there might exist much lower and even negatively correlated Ne–Te points before and after these destructive earthquakes
476 X. H. Shen et al.: Analysis of the enhanced negative correlation
Table 1. The statistical results ofRwith all observation points and of those related to earthquakes at different magnitude levels.
Statistic All points Points related to Points related to Points related to Points related to earthquake earthquake earthquake earthquake 5.0≤M< 6.0 6.0≤M< 6.5 6.5≤M< 7.0. M≥7.0
[image:6.612.46.287.185.461.2]MedianR 0.812 0.703 0.707 0.714 0.683 AverageR 0.694 0.694 0.691 0.694 0.691 No. of earthquakes 7659 611 168 75
Figure 5. The observation of plasma parameters from DEMETER
along orbit 15 572 on 2 June before the Pu’er M6.3 earthquake in China on 3 June 2007 (the order of the five panels is the same as in Fig. 3).
6 Discussion and conclusion
[image:6.612.309.550.191.445.2]From the observations of ionospheric perturbations associ-ated with large earthquakes, several models have been pro-posed to explain the seismo–ionospheric coupling mech-anism; these include an electromagnetic-wave-penetrating model from the lithosphere to the ionosphere (Molchanov et al., 1995), an acoustic-wave-propagating model (Hegai et al., 1997) and electrical-field-coupling models related to radon emission, aerosol accumulation, rock current and sur-face charge (Pulinets, 2004, 2009; Sorokin et al., 2007; Kuo et al., 2011). The last model plays an important role in ex-plaining the ionospheric disturbances related to seismic ac-tivities in plasma parameters, such as the perturbations in GPS TEC (total electron content), foF2 and electron density;
Figure 6. The correlation coefficients ofNeandTealong the three orbits (a: 15 572_1; b: 30 168_1; c: 30 256_1).
Figure 7. The histogram of distribution probability at different
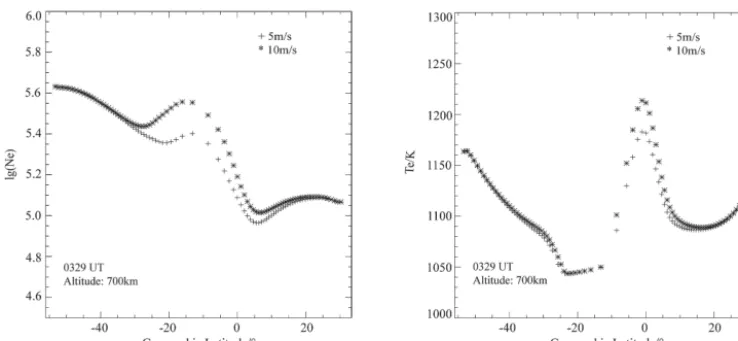
[image:6.612.306.551.496.654.2]Figure 8. The calculation results from SAMI2 ofNe(left) andTe(right) at an altitude of 700 km during local nighttime atE×Beffects of
5 m s−1(+)and 10 m s−1(*), respectively.
the drift effects from overlappedE×Bat the epicentral re-gion coincide with the spatial distribution of perturbations in the ionosphere as shown in GPS TEC (Kuo et al., 2011).
By observing the electric field and the plasma parame-ters simultaneously with the DEMETER satellite, the Ex-component waveforms of the ULF electric field (DC-15Hz) are analyzed along the orbits as shown in Figs. 3–5. Com-bined with the ULF electric field analysis before and after earthquakes in a previous study (Zhang et al., 2014), syn-chronous 3–1 5mV m−1 disturbances were always detected in the electric field, which illustrates the existence of an ex-ternal electric field in the topside ionosphere. To demonstrate the enhanced negative correlation associated with earth-quakes, SAMI2 (Sami2 is Another Model of the Ionosphere) (Huba et al., 2000) is employed to simulate the effects of overlapped external electric fields in a seismic region. Here, the Chile earthquake region (36◦S, 287◦E) is taken as an ex-ample, and the sinusoidalE×Bdrift model is used to calcu-late theE×Beffects as 5 m s−1and 10 m s−1, respectively. The computed results are shown in Fig. 8. With the increase ofE×B effects, the electron density shows a typical maxi-mum around 10◦S and two minima at 30◦S and 5◦N at an altitude of 700 km at 03:29 UT (in Figs. 3 and 4, this time is 22:10 LT in Chile), while the maximum ofTe occurs at the
equator and two minima occur at 10–25◦S and 10–20◦N, respectively. Comparing the two parameters,Neincreases at
30–20◦S, whileTestill decreases and maintains a low level.
At 10–0◦SNedecreases, whileTeincreases quickly, and at
5–10◦N N
e increases, while Te decreases quickly. It
illus-trates that the overlappedE×B effect from the Chile seis-mic region (∼ −36◦S) will strengthen the negative correla-tion feature betweenNeandTeover some specific latitudes,
such as at the north of the source region and even around the equator. It should be noted here that the assumption in SAMI2 of infinite parallel conductivity may lead to nearly the same feature over both hemispheres and a smaller
mod-ified area than expected. Therefore, the disturbed region in Fig. 8 might actually be larger.
In this paper, the correlation ofNeandTeis studied during
local nighttime on the basis of the ISL observations from the DEMETER satellite. By taking account of the normal back-ground with positive and weak correlations betweenNeand
Teat different latitudes, the relationship of the negative
corre-lation betweenNeandTewith strong earthquakes is analyzed
and discussed. The following can be concluded:
1. During local nighttime, log10(Ne) andTe show a
pos-itive linear correlation, especially at low latitudes over the Northern Hemisphere. At midlatitudes,Neexhibits
almost no correlation withTe.
2. Synchronous perturbations in plasma parameters such asNe,Te,Ni(O+)and the electric field have been
de-tected before a few strong earthquakes. Over the seismic regions, a negative correlation betweenNeandTeis
ex-hibited at mid- and low latitudes, which is significantly different from their normal background.
3. The statistical analysis of global strong earthquakes and negativeNe–Te correlations shows that the median R
ofNe–Tecorrelations only reduces with earthquakes of
a magnitude greater than 7.0, illustrating the enhance-ment of a negative correlation betweenNeandTeduring
large earthquakes.
4. According to results calculated by SAMI2, the over-lappedE×B effects will enhance the negative corre-lation betweenNe andTe, which proves that an
478 X. H. Shen et al.: Analysis of the enhanced negative correlation
Acknowledgements. This study was supported by the International
Science & Technology Cooperation Program (2012DFR20440K04; 2014DFR21280) and the National High-tech R&D Program (863 Program: 2012AA121004). The authors thank the DEMETER satellite center for providing the observational data.
Topical Editor H. Kil thanks K. O. Oyama and one anonymous referee for their help in evaluating this paper.
References
Balan, N., Oyama, K. I., Bailey, G. J., Fukao, S., Watanabe, S., and Abdu, M. A.: A plasma temperature anomaly in the equatorial topside ionosphere, J. Geophys. Res., 102, 7485–7492, 1997. Cussac, T., Clair, M. A., Ultre-Guerard, P., Buisson, F.,
Lassalle-Balier, G., Christina Elisabelar, M. L., Passot, X., and Rey, N.: The DEMETER microsatellite and ground segment, Planet. Space Sci., 54, 413–427, 2006.
He, Y., Yang, D., Qian, J., and Parrot, M.: Response of the iono-spheric electron density to different types of seismic events, Nat. Hazards Earth Syst. Sci., 11, 2173–2180, doi:10.5194/nhess-11-2173-2011, 2011.
He, Y., Yang, D., Zhu, R., Qian, J., and Parrot M.: Variations of elec-tron density and temperature in ionosphere based on the DEME-TER ISL data, Earthq. Sci., 23, 349–355, 2010.
Hegai, V. V., Kim, V. P., and Nikiforova, L. I.: A possible generation mechanism of acoustic-gravity waves in the ionosphere before strong earthquakes, J. Earthq. Predict. Res., 6, 584–589, 1997. Huba, J. D., Joyce, G., and Fedder, J. A.: Sami2 is
An-other Model of the Ionosphere (SAMI2), A new low-latitude ionosphere model, J. Geophys. Res., 105, 23035–23053, doi:10.1029/2000JA000035, 2000.
Kakinami, Y., Lin, C. H., Liu, J. Y., Kamogawa, M., Watanabe, S., and Parrot, M.: Daytime longitudinal structures of electron density and temperature in the topside ionosphere observed by the Hinotori and DEMETER satellites, J. Geophys. Res., 116, A05316, doi:10.1029/2010JA015632, 2011a.
Kakinami, Y., Watanabe, S., Liu, J. Y., and Balan, N.: Correlation between electron density and temperature in the topside ionosphere, J. Geophys. Res., 116, A12331, doi:10.1029/2011JA016905, 2011b.
Kakinami, Y., Kamogawa, M., Onishi, T., Mochizuki, K., Lebre-ton, J.-P., Watanabe, S., Yamamoto, M.-Y., and Mogi, T.: Vali-dation of electron density and temperature observed by DEME-TER, Adv. Space Res., 52, 1267–1273, 2013.
Kuo, C. L., Huba, J. D., Joyce, G., and Lee, L. C.: Ionosphere plasma bubbles and density variations induced by pre-earthquake rock currents and associated surface charges, J. Geophys. Res., 116, A10317, doi:10.1029/2011JA016628, 2011.
Lebreton, J. P., Stverak, S., Travnicek, P., Mksimovic, M., Klinge, D., Merikallio, S., Lagoutte, D., Poirier, B., Blelly, P. L., Koza-cek, Z., and Salaquarda, M.: The ISL langmuir Probe experiment and its data procession onboard DEMETER:scientific objectives, description and first results, Planet. Space Sci., 54, 472–486, 2006.
Li, L. Y., Yang, J. Y., Cao, J. B., Lu, L., Wu, Y., and Yang, D.: Statistical backgrounds of topside-ionospheric electron density and temperature and their variations during geomagnetic activity, Chinese J. Geophys., 54, 2437–2444, 2011 (in Chinese).
Li, M. and Parrot, M.: “Real time analysis” of the ion density measured by the satellite DEMETER in relation with the seis-mic activity, Nat. Hazards Earth Syst. Sci., 12, 2957–2963, doi:10.5194/nhess-12-2957-2012, 2012.
Lin, C. H., Wang, W., Hagan, M. E., Hsiao, C. C., Immel, T. J., Hsu, M. L., Liu, J. Y., Paxton, L. J., Fang, T. W., and Liu, C. H.: Plausible effect of atmospheric tides on the equatorial ionosphere observed by the FORMOSAT-3/COSMIC: Three-dimensional electron density structures, Geophys. Res. Lett., 34, L11112, doi:10.1029/2007GL029265, 2007a.
Lin, C. H., Hsiao, C. C., Liu J. Y., and Liu, C. H.: Longitudi-nal structure of the equatorial ionosphere: Time evolution of the four-peaked EIA structure, J. Geophys. Res., 112, A12305, doi:10.1029/2007JA012455, 2007b.
Liu, J., Wan, W., Huang, J., Zhang, X., Zhao, S., Ouyang, X., and Zeren, Z.: Electron density perturbation before Chile M8.8 earth-quake, Chinese J. Geophys., 54, 2717–2725, 2011 (in Chinese). Liu, L., Zhao, B., Wan, W., Venkartraman, S., Zhang, M. L., and
Yue, X.: Yearly variations of global plasma densities in the top-side ionosphere at middle and low latitudes, J. Geophys. Res., 112, A07303, doi:10.1029/2007JA012283, 2007.
Molchanov, O. A., Hayakaya, M., and Rafalsky, V. A.: Penetra-tion characteristics of electromagnetic emissions from an under-ground seismic source into the atmosphere, ionosphere,and mag-netosphere, J. Geophys. Res., 100, 1691–1712, 1995.
Nemec, F., Santolík, O., and Parrot, M.: Decrease of intensity of ELF/VLF waves observed in the upper ionosphere close to earthquakes: A statistical study, J. Geophys. Res., 114, A04303, doi:10.1029/2008JA013972, 2009.
Oyama, K. I., Watanabe, S., Su, Y., Takanashi, T., and Hirao, K.: Season, local time, and longitude variations of electron temper-ature at the height of∼600 km in the low latitude region, Adv. Space Res., 18, 269–278, 1996.
Oyama, K. I., Kakinami, Y., Liu, J. Y., Kamogawa, M., andKodama, T.: Reduction of electron temperature in low-latitude ionosphere at 600 km before and after large earthquakes, J. Geophys. Res., 113, A11317, doi:10.1029/2008JA013367, 2008.
Parrot, M., Berthelier, J. J., Lebreton, J. P., Sauvaud, J. A., Santo-lik, O., and Blecki, J.: Examples of unusual ionospheric obser-vations made by the DEMETER satellite over seismic regions, Phys. Chem. Earth, 31, 486–495, 2006.
Parrot, M.: Statistical analysis of automatically detected ion density variations recorded by DEMETER and their relation to seismic activity, Ann. Geophys., 55, 149–155, 2012,
http://www.ann-geophys.net/55/149/2012/.
Pisa, D., Parrot, M., and Santolík, O.: Ionospheric density varia-tions recorded before the 2010 Mw 8.8 earthquake in Chile, J. Geophys. Res., 116, A08309, doi:10.1029/2011JA016611, 2011. Pisa, D., Nemec, F., Parrot, M., and Santolik, O.: Attenuation of electromagnetic waves at the frequency∼1.7 kHz in the upper ionosphere observed by the DEMETER satellite in the vicinity of earthquakes, Ann. Geophys., 55, 157–163, 2012,
http://www.ann-geophys.net/55/157/2012/.
Pulinets, S. A.: Ionospheric precursors of earthquakes;recent ad-vances in theory and practical applications, Atmos. Ocean. Sci., 15, 413–415, 2004.
Ren, Z., Wan, W., Liu, L., Zhao, B., Wei, Y., Yue, X., and Heelis, R. A.: Longitudinal variations of electron temperature and total ion density in the sunset equatorial topside ionosphere, Geophys. Res. Lett., 35, L05018, doi:10.1029/2007GL032998, 2008. Rich, F. J., Sultan, P. J., and Burke, W. J.: The 27-day variations of
plasma densities and temperatures in the topside ionosphere, J. Geophys. Res., 108, 1297, doi:10.1029/2002JA009731, 2003. Sarkar, S., Gwal, A. K., and Parrot, M.: Ionospheric variations
ob-served by the DEMETER satellite in the mid-latitude region dur-ing strong earthquakes, J. Atmos. Sol.-Terr. Phys., 69, 1524– 1540, 2007.
Sarkar, S., Choudhary, S., Sonakia, A., Vishwakarma, A., and Gwal, A. K.: Ionospheric anomalies associated with the Haiti earth-quake of 12 January 2010 observed by DEMETER satellite, Nat. Hazards Earth Syst. Sci., 12, 671–678, doi:10.5194/nhess-12-671-2012, 2012.
Shama, D. K., Bardhan, A., and Rai, J.: Ionospheric electron and ion temperatures response to seismic activity, Ind. J. Radio Space Phys., 42, 18–26, 2013.
Sorokin, V. M., Yaschenko, A. K., and Hayakawa, M.: A perturba-tion of DC electric field caused by light ion adhesion to aerosols during the growth in seismic-related atmospheric radioactivity, Nat. Hazards Earth Syst. Sci., 7, 155–163, doi:10.5194/nhess-7-155-2007, 2007.
Su, Y. Z., Oyama, K. I., Bailey, G. J., Fukao, S., Takahashi, T., and Oya, H.: Longitudinal variations of the topside ionosphere at low latitudes: Satellite measurements and mathematical modelings, J. Geophys. Res., 101, 17191–17205, 1996.
Venkatraman, S. and Heelis, R.: Longitudinal and seasonal varia-tions in nighttime plasma temperatures in the equatorial topside ionosphere during solar maximum, J. Geophys. Res., 104, 2603– 2611, 1999.
Zeng, Z., Zhang, B., Fang, G., Wang, D., and Yin, H.: The analy-sis of ionospheric variations before Wenchuan earthquake with DEMETER data, Chinese J. Geophys., 52, 13–22, 2009 (in Chi-nese).
Zhang, S. R., Holt, J. M., Zalucha, A. M., and Amory-Mazaudier, C.: Midlatitude ionospheric plasma temperature climatology and empirical model based on Saint Santin incoherent scatter radar data from 1966 to 1987, J. Geophys. Res., 109, A11311, doi:10.1029/2004JA010709, 2004.
Zhang, X., Shen, X., Liu, J., Ouyang, X., Qian, J., and Zhao, S.: Analysis of ionospheric plasma perturbations before Wenchuan earthquake, Nat. Hazards Earth Syst. Sci., 9, 1259–1266, doi:10.5194/nhess-9-1259-2009, 2009.
Zhang, X., Shen, X., Liu, J., Ouyang, X., Qian, J., and Zhao, S.: Ionospheric perturbations of electron density before the Wenchuan Earthquake, Int. J. Remote Sens., 31, 3559–3569, 2010a.
Zhang, X., Liu, J., Shen, X., Parrot, M., Qian, J., Ouyang, X., Zhao, S., and Huang, J.: Ionospheric perturbations associated with the M8.6 Sumatra earthquake on 28 March 2005. Chinese J. Geo-phys., 53, 567–575, 2010b (in Chinese).
Zhang, X., Zeren, Z., Parrot, M„ Battiston, R., Qian, J., and Shen, X.: ULF/ELF ionospheric electric field and plasma perturbations related to Chile earthquakes, Adv. Space Res., 47, 991–1000, 2011.
Zhang, X., Chen, H., Liu, J., Shen, X., Miao, Y., Du, X., and Qian, J.: Ground-based and satellite DC-ULF electric field anomalies around Wenchuan M8.0 earthquake, Adv. Space Res., 50, 85–95, 2012a.
Zhang, X., Shen, X., Parrot, M., Zeren, Z., Ouyang, X., Liu, J., Qian, J., Zhao, S., and Miao, Y.: Phenomena of electro-static perturbations before strong earthquakes (2005–2010) ob-served on DEMETER, Nat. Hazards Earth Syst. Sci., 12, 75–83, doi:10.5194/nhess-12-75-2012, 2012b.