Scanning Capillary Microscopy/Mass Spectrometry
for Mapping Spatial Electrochemical Activity of
Electrodes
Alexander D. Modestov, Simcha Srebnik, Ovadia Lev,* and Jenny Gun
Division of Environmental Sciences, Fredy and Nadine Herrmann School of Applied Science, The Hebrew University of Jerusalem, Jerusalem 91904, Israel
A new technique for microscopic imaging of electrochemi-cally active surfaces is introduced. The technique com-bines concepts of probe microscopy and advances in mass spectrometry. The technique is based on a miniature electrochemical flow cell scanner. A liquid feed stream containing a redox component is introduced to the vicinity of the examined location through the annulus of a coaxial capillary set. The incoming reagent interacts with the target location, and the generated product stream is transferred through the inner capillary to an electrospray mass spectrometer, ESI-MS. Thus, a multicomponent, potential-dependent image of the products’ distribution versus the location on the electrode is generated. The use of the technique is demonstrated by scanning the elec-trochemical heterogeneity of model electrodes.
This article introduces a new technique for imaging nonuni-form electrochemical activity distribution of electrode surfaces. The technique is based on a miniature electrochemical flow cell that can be micropositioned above specific locations on the electrode or can scan the surface continuously. A liquid feed stream containing a test substance is introduced to the vicinity of the examined location though the annulus of a coaxial capillary set. The flat end of the inner capillary forms the upper side of a radial flow cell, and the sample surface constitutes the bottom side. The incoming test stream interacts with the target location below the capillary head, and the product stream is transferred through the inner capillary to an electrospray mass spectrometer, ESI-MS. A multicomponent potential-dependent image of the products’ distributions versus location on the electrode is thus generated. Electrochemical oxidation of N,N-dimethyl-p-phenylene-diamine (DPD) is used as a test reaction in our studies.
Imaging spatial electrochemical reactivity poses a long-standing challenge for electrochemists and electroanalysts. The presence of liquid prohibits in-situ imaging by the traditional high vacuum electron microscopes such as SEM and TEM (scanning and transmission electron microscopies, respectively). The fact that the electrode has to be dried before the examination limits the ability to correlate the spatial surface activity with surface morphology. Several electrochemical microscopies were devised in order to overcome this problem. The first generation of probing
tools were based on the micropositioning of a miniature reference or selective electrode in the vicinity of the examined surface. These electrodes scanned the surface and sensed the local current density or concentration change in the vicinity of the sample electrode.1,2 A variant of this technique was accomplished by placing an array of microelectrodes in the vicinity of the examined surface.3-5In this case, a spatial activity image was obtained by reading the signal of the array of the electrodes consecutively via a digital multiplexer rather than by moving the micro-probe along the surface. The introduction of scanning tunneling microscopy (STM)6 paved the way for the evolution of a class of probe microscopies that gave morphological information with atomic-or nanometer-scale resolution. Soon, these devices were used fatomic-or in-situ scanning of electrodes in solvents and electrolytes7and for the imaging of polarized electroactive electrode surfaces.8-10STM and atomic force microscopy had enormous effects on contem-porary chemistry of interfaces and electrochemistry.10,11Probe microscopies have unparalleled resolving power, and they can image surface morphologies and even provide nanoscale informa-tion on the dynamic evoluinforma-tion of solid/liquid interfaces. However, these techniques provide only limited chemical information on the electrolyte side of the interface. Bard and co-workers and a number of other groups12-16developed a set of techniques that are grouped under a common name, scanning electrochemical
* To whom correspondence should be addressed. E-mail: [email protected].
(1) Isaacs, H. S.; Kendig, M. W. Corrosion 1980, 36, 269-274. (2) Rosenfeld, I. L.; Danilov, I. S. Corros. Sci. 1967, 7 129-136.
(3) Lev, O.; Sheintuch, M.; Pismen L. M.; Yarnitzky, C. Nature 1989, 336, 458
-459
(4) Lev, O.; Sheintuch, M.; Pismen L. M.; Yarnitzky, C. Chem. Eng. Sci. 1990, 45, 1339-1344.
(5) Meyer, H.; Drewer, H.; Grundig B.; Camman, K.; Kakerow, R.; Manoli, Y.; Mokwa, W.; Rospert, M. Anal. Chem. 1995, 67, 1164-1170.
(6) Binnig, G.; Rohrer, H. Helv. Phys. Acta 1982, 55, 726-731. (7) Sonnenfeld, R.; Hansma, P. K. Science 1986, 232, 211-216.
(8) Lev, O.; Fan, R.-F.; Bard, A. J. J. Electrochem. Soc. 1988, 135, 783-785. (9) Lustenberger, P.; Roherer, H.; Christoph, R.; Siegenthaler, H. J. Electroanal.
Chem.1988, 243, 225-232.
(10) Wolfgang L.; Walderied, P. In-Situ Local Probe Techniques at Electrochemical Interfaces; IUPAC Publication, Wiley: Weinheim, 1998.
(11) Wiesendanger, R.; Guentherodt, H.-J. Scanning Tunneling Microscopy; Springer-Verlag: Berlin, 1993.
(12) Bard, A. J.; Fan, R.-F.; Kwak, J.; Lev, O. Anal. Chem. 1989, 61, 132-139 (13) Bard, A. J.; Denuault, G.; Lee, C. M.; Mandler, D.; Wipf, D. O. Acc. Chem.
Res.1990, 23, 357-363.
(14) Engstrom, R. C.; Small, B.; Kattan, L. Anal. Chem. 1992, 64, 241-244. (15) Mirkin, M.; Barker, A. L.; Gonsales, M.; Macpherson, J. V.; Slevin, C. J.;
Unwin, P. R. Anal. Chim. Acta 1999, 385, 223-232.
(16) Yasukawa, T.; Kaya, T.; Matsue, T. Electroanalysis 2000, 12, 653-659.
Anal. Chem.2001,73,4229-4240
microscopy, SECM. These techniques allow for the imaging of morphology as well as chemical activity of the interfaces by measuring the current or potential of a microelectrode placed in the vicinity of the studied interface. The signal reflects interaction of redox species in the solution with the probe and the interface beneath it. Lohrengel extended the method for the examination of surfaces that are not immersed in the electrolyte by forming a miniature electrochemical cell below a scanning capillary.17Prior to the introduction of the SECM, the probing electrode was conceived as a passive spectator that had to reflect the ongoing electrochemical activity without affecting it. In contrast, the tip of the SECM participates actively in the electrochemical process by forming a miniature thin layer electrochemical cell between its surface and the examined location. Although in the first generation of microelectrode scanners the Faradaic currents were eliminated altogether and in the STM microscopy they were an undesirable byproduct, the Faradaic current serves as the image-forming signal in the SECM. Often, a redox couple is deliberately introduced to generate the SECM signal. SECM is, in essence, an electrochemi-cal technique and as such, it benefits from the inherent advantages of electrochemical sensors but also suffers from their drawbacks. SECMs are highly sensitive and rather inexpensive but their signal is generated almost exclusively by the most dominant redox species and does not reflect the minor intermediates, products, and byproducts of the electrochemical process.
There is still no instrumental rival to mass spectrometry (MS) for the identification of trace reaction byproducts. An account of the application of mass spectrometry in electrochemistry is given by Bittins-Cattaneu.18A few different approaches for the analysis of electrochemical products by MS were developed, including for example, thermospray,19,20particle beam,21,22ICP,23,24and electro-spray ionization mass spctrometries. The electroelectro-spray interface (ESI) enables determination of nonvolatile and ionic compounds by mass spectrometry. Several reports on the use of ESI-MS for electrochemistry were recently published.25-32Van Berkel studied electrochemical processes inherent to electrospray interface33and used electrochemical cells combined on-line with ESI-MS for investigation of products of electrode reactions,28,34ionization of
neutral analytes,27 and enhanced determination of chemical species.35-37A probe for fast transfer of electrochemical products to ESI-MS was constructed by Cole29,30and used for mechanistic studies of oxidation of polycyclic aromatic hydrocarbons29 and diphenylsulfide.30
In this article, we demonstrate the integration of scanning concepts with mass spectrometry. The configuration of the miniature scanning flow cell of the scanning capillary microscopy mass spectrometer (SCM-MS) is described in the Experimental Section. To understand the role of the many controllable variables in this device, we describe a simple mathematical model for the SCM-MS in the theory section. The electrochemical oxidation of dimethyl-p-phenylenediamine (DPD) is used as a probe reaction, and its primary products and intermediates are described. Detailed account of the identification of the byproducts of DPD oxidation will be presented in a subsequent paper.38Finally, SCM-MS images of model electrodes are presented.
EXPERIMENTAL SECTION
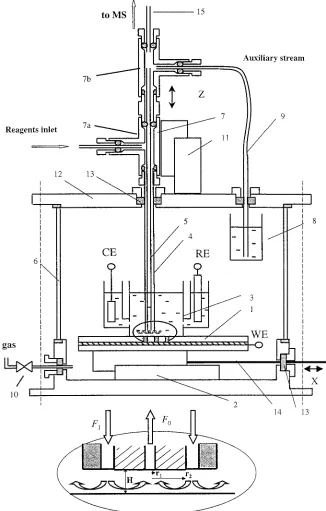
Figure 1 shows a schematic representation of the experimental set up. It comprised a three-compartment electrochemical cell placed in a pressure chamber, a coaxial capillary set, a 2-dimen-sional micropositioning device, and an electrospray ionization (ESI) mass spectrometer.
The sample electrode (1) was placed horizontally on the x stage (2). The bottom opening of the electrochemical cell (3) was pressed to the sample electrode by a set of steel springs. A rubber gasket seal of GC septum (Thermolite septa, Restek, Bellenfonte, PA) was placed between the sample and the cell. The central compartment of the working electrode was connected to the side compartments of the counter and reference electrodes by two 0.5-mm openings. The volume of the central compartment was 4 mL. The cell was filled with approximately 3 mL of electrolyte before starting the experiments. Up to 1 mL of the reagent solution was pumped into the cell during the measurements. A Pt wire counter electrode and 2 M KCl Ag/AgCl reference electrodes were used. All potentials reported below are relative to this reference. The electrolyte in the cell was aqueous 0.1 M trichloroacetic acid (pH 2) from Aldrich (St. Louis, MO). N,N-dimethyl-p-phenylenediamine hemioxalate salt (DPD) (10 mM) from Aldrich in water-methanol solvent containing 0.1 M trichloroacetic acid was pumped through the annulus of the capillary set to the electrode.
A coaxial capillary set (4,5) was used to deliver the reagent solution to the specified location and to transfer the product stream to the interface of the mass spectrometer through the inner capillary. A syringe pump was used to deliver the feed stream to a T-junction (7a) located outside the pressure chamber (6), from which the stream was directed through the annulus between the two capillaries to the examined location. The cross section of the outlet/inlet head of the coaxial capillary set is also shown in the insert in Figure 1. Polishing of the capillary’s end was ac-complished using a flat 3-cm-height mandrel that had a through hole of 0.45 mm diameter drilled perpendicularly to its flat surface. (17) Hassel, A. W.; Lohrengel, M. M. Electrochim Acta 1997, 42, 3327-3333.
(18) Bittins-Cattaneu, B.; Cattaneo, E.; Konigshoven, P.; Vielstich, W. In Elec-troanalytical Chemistry; Bard, A. J., Ed.; Marcel Dekker: New York, 1991. (19) Hambitzer, G.; Heitbaum, J.; Stassen, I. Electroanal. Chem. 1998, 447, 117
-124.
(20) Hambitzer, G.; Heitbaum, J.; Stassen, I. Anal. Chem. 1998, 70, 838-842. (21) Regino, M. C. S.; Brajter-Toth, A. Electroanalysis 1999, 11, 5, 374-379. (22) Regino, M C. S.; Brajter-Toth, A. Anal. Chem. 1997, 69, 5067-5072. (23) Pretty, J. R.; Duckworth, D. C.; Van Berkel, G. J. Anal. Chem. 1998, 70,
1141-1148.
(24) Pretty, J. R.; Blubaugh, E. A.; Caruso, J. A. Anal. Chem. 1993, 65, 3396
-3403.
(25) Bond, A. M.; Colton, R.; D’Agostino, A.; Downard, A. J.; Traeger, J. C. Anal. Chem. 1995, 67, 1691-1695.
(26) Zhou, F.; Van Berkel, G. J. Anal. Chem. 1995, 67, 3643-3649. (27) Van Berkel, G. J.; Quirke, J. M. E.; Tigani, R. A.; Dilley, A. S.; Covey, T. R.
Anal. Chem. 1998, 70, 1544-1554.
(28) Deng, H.; Van Berkel, G. J. Anal. Chem. 1999, 71, 4284-4293. (29) Xu, X.; Lu, W.; Cole, R. B. Anal. Chem. 1996, 68, 4244-4253. (30) Lu, W.; Xu, X.; Cole, R. B. Anal. Chem. 1997, 69, 2478-2484.
(31) De la Mora, J. F.; Van Berkel G. J.; Enke C. G.; Cole R. B.; Martinez-Sanchez M.; Fenn J. B. J. Mass Spectrosc. 2000, 35, 939-952.
(32) Van Berkel, G. J. J. Am. Soc. Mass Spectrosc. 2000, 11, 951-960. (33) Van Berkel, G. J.; Giles, G. E.; Bullock, J. S.; Gray, L. J. Anal. Chem. 1999,
71, 5288-5296.
(34) Deng, H.; Van Berkel, G. J. Electroanalysis 1999, 11, 857-865.
(35) Pretty, J. R.; Deng, H.; Goeringer, D. E.; Van Berkel, G. J. Anal. Chem. 2000, 72, 2066-2074.
(36) Deng, H.; Van Berkel, G. J.; Takano, H.; Gazda, D.; Porter, M. D. Anal. Chem.2000, 72, 2641-2647.
(37) Pretty, J. R.; Van Berkel, G. J. Rapid Comm. Mass Spectrom. 1998, 12, 1644
-1652.
The capillary was placed inside the hole and the mandrel was polished over wet emery paper (600 grit; Buehler, Lake Bluff, IL) on flat glass support. The quality of the polished edges of the capillaries was checked using an optical microscope. The outer capillary of the two-capillary set up (5) was a gas chromatography inactivated fused-silica guard column (0.32-mm i.d., 0.43-mm o.d.; Alltech, Deerfield, IL). The product stream (F0) was pumped, following the interaction with the specified location, upward through the inner capillary (4) by the pressure drop between the
[image:3.612.142.468.42.553.2]within the pressure chamber. The auxiliary capillary (9) was 30 cm long, 50-µm i.d. fused silica (SGE). Dilution of the effluent by the auxiliary stream was required for three reasons: (1) to minimize the delivery time to the mass spectrometer, (2) to enhance solvent evaporation in the ESI interface of the mass spectrometer, and (3) to quench second-order reactions of products in the MS transfer line.
The liquid flow rates and dilution ratio (effluent:methanol) were controlled by setting the pressure in the pressure vessel and by adjusting the length of the auxiliary capillary (9). The pressure in the pressure chamber (6) was controlled by a pressure regulator (10) connected to an argon gas cylinder (typical cell pressure was 2600 kPa). The flow rates in the capillaries were calculated using the Poiseuille equation39
where F0is the flow rate in m3sec-1, P is the pressure drop over the capillary in Pa, r1is the capillary inner radius, L is the capillary length, andµis the viscosity of the liquid in kg(ms)-1. In most cases, we used a water-methanol (1:1 by volume) test solution (F1) in order to prevent clogging of the capillaries by DPD polymerization products. In the calculations of flow rates, we used the viscosity data for a water-methanol system.40
After mixing with the auxiliary liquid, the sample stream was delivered to the ESI interface of the mass spectrometer by a 30-cm-long, 100-µm-i.d. capillary (SGE). Under these experimental conditions, the flow rate of the product stream was∼0.3-0.7µL min-1, depending on the composition of the water-methanol mixture. The methanol flow in the auxiliary capillary was 14µL min-1. The reagent flow rate (F1) was set independently. Unless otherwise stated, F1was set to 4µL min-1.
The present configuration of the SCM-MS allowed only for x-z alignment of the capillary head relative to the electrode, with an accuracy of 5µm. The T-junction set (7a, 7b) was attached to a z translation stage (11), which was mounted on the upper cover (12) of the pressure chamber. The coaxial capillary set was introduced through a rubber septum (13) in the upper cover of the chamber. Thus, the position of the capillary head in the vertical direction (z) was controlled by the z stage. The x location of the capillary set relative to the electrode surface was controlled by the x stage (1). This stage was connected via a steel rod (14) to a micropositioner located outside the chamber. The translation stages and position controllers were from Newport (Irvine, CA). They were operated either manually or under computer control. A PARC 263 potentiostat/galvanostat (Princeton, NJ) was used for potential control of the electrochemical cell. A Metrohm 663 (Herisau, Switzerland) VA rotating disk electrode was used for hydrodynamic voltammetry studies and a Finnigan (San Jose, CA) LCQ ESI mass spectrometer was used for data acquisition.
Preparation of the Working Electrodes. Three types of working electrodes were employed: (1) a flat Pt electrode, (2) a flat electrode consisting of 3 Pt strips separated by an insulator, and (3) a flat Cr/Pt/Cr sandwich electrode embedded in an
insulator. The electrode (2) consisted of 3 vertical Pt foils, each of 0.16-mm thickness, separated by 2 glass slides. Two additional glass slides were placed on each side of the assembly. The platinum strips were connected to a Cu mesh lead through their backside. The whole assembly was glued together using Varian epoxy. After hardening, the assembly was polished using 600-grit emery paper (Buehler, Lake Bluff, IL).
A Cr/Pt/Cr electrode was manufactured by electrochemically coating of 0.16-mm thick Pt foil with a 0.18-mm chromium layer on both sides. Coating was performed at 60°C at a current density of 0.5 A cm-2from an electrolyte solution containing 250 g L-1 CrO3and 2.5 g L-1H2SO4. The coated metal strip was embedded between two glass slides using Varian epoxy. The electrode set was flat-polished using emery paper.
THEORY
Rigorous theories exist for straight channel flow cells41-47and hydrodynamic models of wall jet electrodes.48-51 The flow con-figuration in our setup is considerably simpler, and a first-order approximation does not require intensive hydrodynamic calcula-tions. The flow pattern in the electrochemical flow cell used in this research can be described by the following conceptual picture. A liquid stream with the test compound emanates from the annular channel and impinges on the flat sample electrode. The flow then splits into two parts. The major stream (in region I) is driven to the volume of the cell. This stream does not contribute to the signal in the MS, and for this reason, it is not considered further. A second, minor part of the incoming stream flows down and inward to the electrochemical flow cell. This region (II) influences the observed MS signal. The stream then flows through a radial converging flow cell below the walls of the inner capillary (region III). Then the stream lines are diverted upward to the inner capillary below the opening of the inner capillary (region IV). A fifth region includes an upward laminar flow in the transfer line, which is very important when consecutive chemical reactions are analyzed but can be neglected for pure electrochemical reactions. The relative contribution of the three active regions to the MS signal depends on the geometry and flow rates involved. For the flow rates involved in the current research, it can be shown by experimental, as well as theoretical, considerations that region III dominates the observed signal.
Region II is located between the outer radius of the inner capillary and a stagnation point where the radial flow changes from inward to an outward direction. The outer radius of region II depends on the split ratio, F1/F0; with large split ratios, it approaches the radius of the inner capillary, and with small ones (approaching 1), region II covers the whole annulus. The ratio
(39) McCabe, W. L.; Smith, J. C.; Harriott, P. Unit Operations in Chemical Engineering, 5th ed.; McGraw-Hill: New York, 1993.
(40) CRC Handbook of Chemistry and Physics, 81st ed.; Lide, D. R., Ed.; CRC Press: Boca Raton, 2000; pp 8-69.
(41) Newman, J. S. Electrochemical Systems, Prentice Hall: Englewood Cliffs, NJ, 1973.
(42) Lin C. S.; Denton, E. B.; Gaskill, H. S.; Putnam, G. L. Ind. Eng. Chem. 1951, 43, 2136-2145.
(43) Ross, T. K.; Wragg, A. A. Electrochim. Acta 1965, 10, 1093. (44) Tobias, C. W.; Hickman, R. G. Z. Phys. Chem. 1965, 229, 145. (45) Gerischer, H.; Mattes, I.; Broun, R. J. Electroanal. Chem. 1965, 10, 553
-567.
(46) Braun, R. J. Electroanal. Chem. 1968, 19, 23-35.
between the sample areas below regions I and II can be approximated by the split ratio, indicating that the width of region II is only 2-3 micrometers for the split ratio (5-10 respectively) used in the current study. Indeed, a 2-fold change of F1had an insignificant effect on the observed conversion, which shows that the contribution of region II can be neglected for the current configuration. We confine our model to a situation in which the inner channel of the inner capillary is much smaller, as compared to its outer radius (r1,r2), which is obeyed in our setup, and thus, conversion in region IV can be neglected. Region III is also divided into two subregions: an inlet region where a laminar fluid flow develops gradually and a well-developed laminar flow section. Schlichting52 discusses the flow in the inlet length (∆r) of a straight channel and shows that∆r)0.04HRe, where H is the height of the flow channel, and Re is the Reynolds number referred to the width of the channel. Since Re is of the order of 1 in our studies, ∆r is negligibly small, and we assume laminar flow throughout region III.
The velocity field in region III is r- and z-dependent. The velocity obeys a parabolic dependence on the z coordinate with a no-slip condition at the sample and capillary boundaries. The flow rate in the radial flow cell is constant, and therefore, the radial linear velocity is inversely proportional to the radial position. We assume that the concentration of the reactant at the entrance to the flow cell (C0) is uniform in the vertical (z) direction. We neglect diffusion in the radial (r) direction, because the radial Peclet number41at the entrance to the flow cell is much larger than 1 (Pe)vr2/D∼10-100, where v is the averaged linear velocity in
the flow cell, D is the diffusion coefficient of reactantA, and r2is
the outer radius of the inner capillary). We consider only diffusion-controlled conditions; thus, C)0 at the electrode surface. Finally, we neglect consecutive chemical reactions, although we shall demonstrate that chemical reactions do play an important role in DPD electrooxidation. Thus, our convection diffusion equation is
where u(r,z) is the radial laminar velocity profile defined by
Eq 2 is subject to the following boundary conditions:
It is convenient to rewrite the governing equations in terms of dimensionless variablesχ)C/C0,ξ)r/r2,ζ)z/r2,R )πr2D/
4F0, andδ)H/r2.
The boundary conditions in dimensionless form are
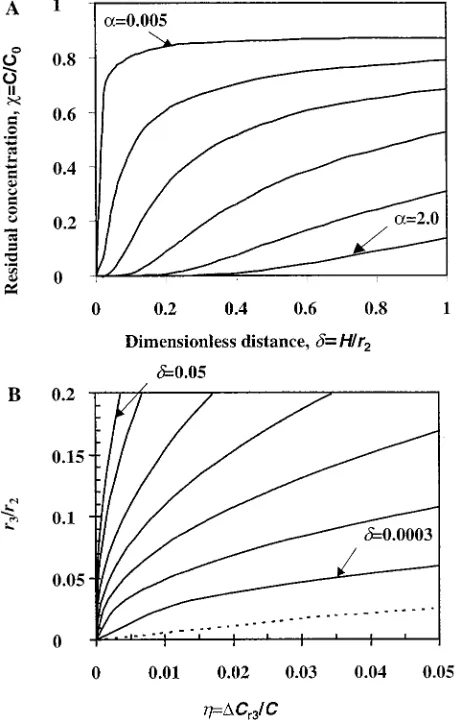
The z-averaged concentration of reactantAentering the inner capillary as a function ofδfor different values ofRand for r1, r2was solved by a finite difference scheme and is shown in Figure 2A. The different curves are analogous to the approach curves of the SECM; that is, they describe the change in the signal of the reactant versus the distance between the capillary head and the conductive sample. AsRis increased, for example, by decreasing the flow rate or by increasing the diffusion coefficient, the conversion is increased. In all cases, we observe that as the thickness (H) of the flow cell is decreased, the conversion is increased, despite the fact that the flow rate and the active surface area remain constant.
Theoretical Spatial Resolution of the SCM-MS. A practical quest of any new microscope is its ultimate resolution. In other words, what is the minimal inactive (or active) spot that can be detected in an otherwise active (or inactive) electrode? The practical resolution of the SCM-MS depends largely on the performance of the mass spectrometer and its interface, which depends on the target compound and its concentration. We limit the current discussion to the prediction of a minimal radius of an inactive spot (r3) that can be determined by the SCM-MS as a function of a given uncertainty of measurements by the mass spectrometer, η. η is defined here as the minimal change of concentration of species A that can be reliably detected by the mass spectrometer
where C is the average concentration of A detected over a homogeneous active surface, and∆Cr3is the change of the average
concentration of A when the capillary head is moved from the homogeneous active surface to an inactive spot of radius r3that is located directly below the center of capillary head. η is determined mostly by signal noise and drift.
We solved the spatial resolution problem with the current model, although for small wall thickness, the inlet section (region II) becomes important and will somewhat decrease the attainable resolution. Figure 2B depicts the attainable spatial resolution (r3/ r2) of the SCM-MS as a function of the dimensionless distance (δ )H/r2) and the uncertainty level of the MS (η) for the operating conditions of our studies (R ) 0.005). For example, for an uncertainty level ofη)0.04, the SCM should distinguish a spot of less than∼5% of the outer diameter of the inner capillary. Thus, a resolution of less than 10 micrometers should be attainable even with the current setup. However, we find that for a largerR(e.g., smaller flow rate), the maximal resolving power increases sig-nificantly. For example, forR )0.25 (dashed line) andη)0.01, (52) Schlichting, H. Boundary-Layer Theory, 6th ed; McGraw-Hill Book
Com-pany: New York, 1968
∂(Cu)
∂r )D
∂2C
∂z2 (2)
u(r,z))(4F0/πrH)(z/H-(z/H) 2
) (3)
C)C0at r)r2 (4)
C)0 at z)0 (5)
∂C/∂z)0 at z)H (6)
1 Rδ
(
ζ δ-
(
ζ δ
)
2
)
∂(χ/ξ)∂ξ )
∂2χ
∂ζ2 (7)
χ)0 atζ)0, the reactive surface (8)
∂χ/∂ζ)0 atζ)δ; the capillary wall (9)
χ)1 atξ)1, the entrance to the flow cell (10)
η)∆Cr
the minimal detectable spot is less than 0.5% of the thickness of the inner capillary when the surface is scanned at a dimensionless distance, H/r2 e 0.005. This implies that a 100-nm level of resolution is practically feasible with an optimized version of the current set up. We anticipate that other modes of discontinuous operation, such as stopped flow, will increase the spatial resolution considerably, similar to the way that discontinuous operation schemes increase the analytical detection limit, as compared to linear cyclic voltammetry.
RESULTS AND DISCUSSION
Electrochemistry of Dimethyl-p-phenylenediamine. The chemistry of phenylenediamines and their oxidation pathways have been studied since the beginning of the 20th century.53-57
However, the electrochemistry of these compounds is rather complex as a result of consecutive reactions between oxidized and unoxidized phenylenediamine moieties. The electrochemical oxidation yields diimines as well as stable free radical cations.58-68 Diimine is easily hydrolyzed, thereby increasing the variety of electrooxidation byproducts.58-60SECM studies employing DPD reagent were also reported.69,70In a subsequent paper, we shall describe the electrochemical oxidation pathways of dimethyl-p-phenylenediamine (DPD) and the identification of its oxidation byproducts by mass spectrometry. In this paper, we shall outline only the major byproducts that are observed during the electro-chemical oxidation of DPD under the conditions that will be used for the generation of the approach curves and the surface imaging studies.
Figure 3 shows voltammetry of 10-mM DPD dissolved in aqueous 0.1 M Cl3CCOOH electrolyte (pH 2.0) at Pt (curve 1) and Cr (curve 2) rotating disk electrodes. The voltammetry curve reveals only one anodic 2-electron wave, in agreement with earlier studies.61,62,66Information provided by the voltammetry study is somewhat oversimplistic, because it provides only a partial picture of the complexity of this reaction and its byproducts.
Flow Characteristics in the Flow Cell Scanner. Figure 4 shows the dependence of the concentration of DPD (CDPD) in the effluent of the flow cell on the feed-stream flow rate (F1). An
(53) Kenneth Mees, C. E. The Theory of the Photographic Process; Macmillan Co: New York, 1944.
(54) Michaelis, L. J. Am. Chem. Soc. 1931, 53, 2953-2963.
(55) Michaelis, L.; Schubert, M. P.; Granick, S. J. Am. Chem. Soc. 1939, 61, 1981-1992.
(56) Michaelis, L.; Hill, E. S. J. Am. Chem. Soc. 1933, 55, 1481-1494. (57) Fieser, L. F. J. Am. Chem. Soc. 1930, 52, 4915-4940.
(58) Tong, L. K. J. J. Phys. Chem. 1954, 58, 1090-1097. (59) Willstatter, R.; Piccard, J. Berichte. 1908, 41, 1458-1475.
(60) Tong, L. K. J.; Liang, K.; Ruby, W. R. J. Electroanal. Chem. 1967, 13, 245
-262.
(61) Mark, H. B.; Anson, F. C. Anal. Chem. 1963, 35, 722-724. (62) Lee, H. Y.; Adams, R. N. Anal. Chem. 1962, 34, 1587-1590.
(63) Lelievre, D.; Plichon, V.; Dosal, M. A. J. Electroanal. Chem. 1977, 78, 301
-306.
(64) Lelievre, D.; Henriet, A.; Plichon, V. J. Electroanal. Chem. 1977, 78, 281
-300.
(65) Aoki, K.; Tokudara, K.; Matsuda, H. J. Electroanal. Chem. 1977, 79, 49
-78.
(66) Piette, L. H.; Ludwig, P.; Adams, R. N. Anal. Chem. 1962, 34, 916-920 (67) Aoki, K.; Tokudara, K.; Matsuda, H. J. Electroanal. Chem. 1977, 76, 217
-233.
(68) Aoki, K.; Matsuda, H. J. Electroanal. Chem. 1978, 94, 157-163. (69) Unwin, P. R.; Bard, A. J. J. Phys. Chem. 1991, 95, 7814-7824.
(70) Martin, R. D.; Unwin, P. R. J. Chem. Soc., Faraday Trans. 1998, 94, 753
[image:6.612.317.558.39.200.2]-759. Figure 2. (A) Theoretical approach curves: relative residual
[image:6.612.59.289.42.403.2]concentration at the entrance to the inner capillary as a function of dimensionless distance between the SCM capillary head and the sample. Curves correspond toR )0.005, 0.06, 0.2, 0.5, 1.0, and 2.0. (B) Theoretical resolution: minimal dimensionless inactive radius of a circular spot that can be resolved by the mass spectrometer having a resolutionη for R ) 0.005; solid curves correspond to dimensionless distancesδ)0.05, 0.025, 0.01, 0.005, 0.002, 0.001, and 0.0003; dashed curve corresponds toR )0.25 andδ)0.005.
aqueous electrolyte feed containing 10 mM DPD was used. The capillary head was placed approximately 10µm above the surface of the flat Pt electrode, and the applied pressure drop was P) 2.6 105Pa. The measurements were performed under open circuit conditions; therefore, no chemical transformation of DPD was observed. This curve was used to find the conditions for which the flow through the electrochemical flow cell (F0) originates exclusively from the feed stream that comes through the outer capillary (F1of Figure 1). Under these conditions, the influence of the composition of the bulk electrolyte can be neglected. The flow rate in the inner capillary was set to F0)0.7µL min-1by pressure regulation. The liquid in the cell and in the feed stream was aqueous 0.1 M trichloroacetic acid. Two nearly linear sections of the DPD concentration-feed flow rate curve are observed in Figure 4. For F1<0.5µL min-1, almost all of the flow from the annulus is drawn into the flow cell and to the transfer line. A supplementary flow (F0- F1) originates from the bulk of the electrochemical cell. Under these conditions, the concentration of DPD in the effluent is given by
For F1 > 1 µL min-1, the concentration of DPD in the inner transfer line reaches saturation (CDPD)CDPD,0). The excess flow (F1-F0) is driven through the outer opening between the walls
of the outer capillary and the sample electrode, thus preventing penetration of liquid from the bulk to the flow cell. In view of Figure 4, we used F1)4µL min-1in subsequent studies.
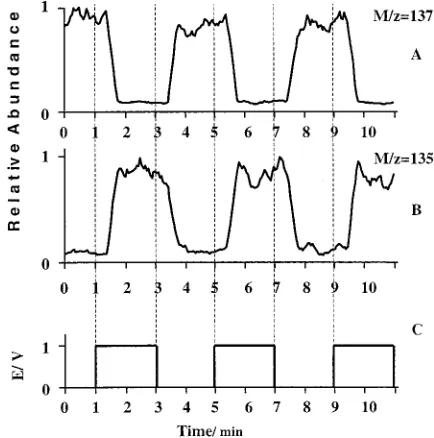
The retention time in the flow cell, transfer line, and ESI interface of the MS was determined by application of a potential step between 0.0 V and 1.0 V to a flat Pt sample electrode. According to the voltammeteric curve 1 shown in Figure 3, for E )0.0 V, DPD is exclusively in its reduced state, while E)1.0 V corresponds to diffusion-limited oxidation current. Diagram C in Figure 5 shows a sequence of potential steps applied to the Pt electrode. Diagrams A and B show the time-dependence of the
normalized effluent concentration of DPD (m/z)137) and the primary product of DPD oxidation, phenylenediimine (m/z)135). Figure 5, shows that the application of the potential step (E)1.0 V) sharply increases the concentration of the phenylenediimine, but the concentration of DPD decreases correspondingly. The concentrations start to change after a delay time of∼25 s. This delay time corresponds to the retention time in the transfer line, which is in agreement with flow calculations. An additional 15-s interval is required to reach the half-height of the concentration step change because of backmixing in the transfer line. This rather long delay time sets the limits of this setup to studies of reactions involving relatively long-living intermediates. However, shorter retention times are possible with a shorter transfer line.
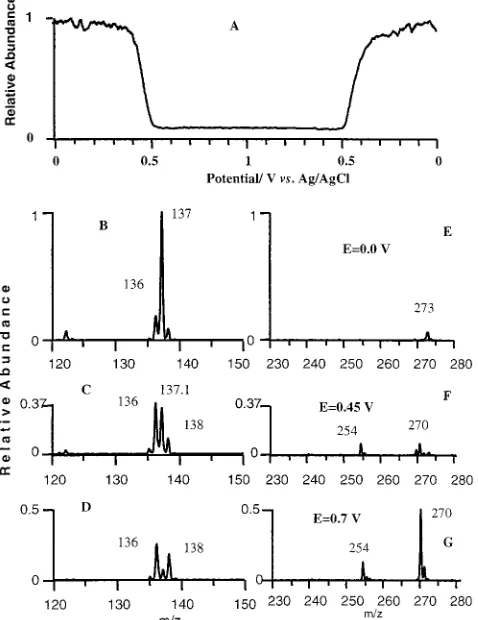
[image:7.612.56.295.39.197.2]Monitoring of DPD and Its Oxidation Products by Mass Spectrometry during Potential Scan. Figures 6 and 7 show mass spectrometry studies of the electrooxidation products of DPD when the electrode potential was swept linearly with time. The potential scan rate was 1 mV s-1, carried out from 0.0 to 1.0 V and back. In these experiments, 10 mM DPD in a 1:1 (v:v) methanol:water mixture containing 0.1 M trichloroacetic acid (pH 2) was supplied to the flat Pt electrode surface through the outer capillary. The capillary head was positioned 10 µm above the electrode surface. Diagram A in Figure 6 shows the potential dependence of the relative abundance of DPD (m/z)137) in the effluent. The time course of the product evolution curve was transformed to the corresponding potential scale using a 40-s delay time on the basis of the potential step change studies. The concentration of DPD starts to decrease at E)0.4 V and reaches its minimal value at E)0.5 V, which is in agreement with the voltammogram shown in Figure 3, curve “1”. On the backward, cathodic scan, from E)1.0 V to E)0.0 V, the concentration of DPD follows the pattern observed in the anodic scan. The Figure 4. Dependence of the concentration of DPD in the effluent
of the flow cell on the feed flow rate. The capillary head was fixed at 10 µm above a Pt substrate (at open circuit). Aqueous 0.1 M trichloroacetic acid solution was used in the cell and in the feed. The feed stream contained 10 mM DPD. The electrochemical cell did not contain DPD. MS spectra were recorded using the following set-tings: capacity of the ion trap, 5 107ions; number of microscans, 10. This enabled recording 10-20 spectra/min.
CDPD)CDPD,0F1/F0 (12)
[image:7.612.328.545.40.259.2]reversibility implies that stationary conditions are, indeed, main-tained during the potential scan.
The spectra windows corresponding to the m/z ranges 120 -150 and 230-280 measured at E)0.0 V, E)0.45 V, and E)0.7 V, are shown in diagrams B-D and E-G of Figure 6, respectively. These mass windows correspond to monomer and dimer products. The peaks of the spectra were normalized to the abundance of the m/z)137 peak at E)0.0 V. This presentation gives the relative abundance of the respective ions in the effluent normalized to the concentration of DPD in the feed. The most pronounced peaks at E)0.0 V correspond to m/z)137 and 273. The m/z) 137 peak corresponds to the protonated molecule of DPD. The m/z)273 peak is attributed to the proton-bound dimer of DPD, because this peak correlates very well with the DPD abundance throughout the potential range and during different flow condi-tions. Near the formal potential (E)0.45 V), the 137 and 273 m/z peaks had reduced abundance, and those at 136, 138, 254, and 270 became more dominant. This trend was increased at higher potentials. At E)0.7, the DPD peaks almost disappear and the products’ peaks become dominant.
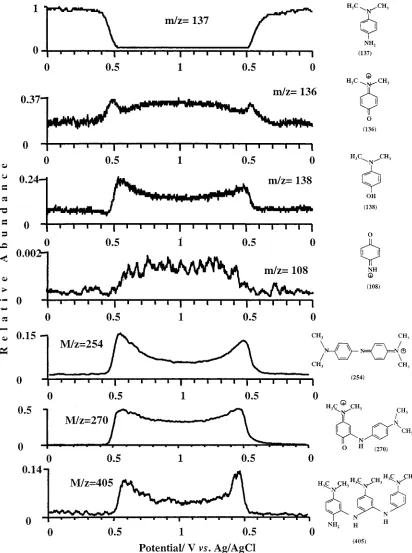
[image:8.612.56.295.44.354.2]The potential dependence of the formation of the compounds characterized by m/z 138, 136, 108, 254, 270, and 405 is shown in
Figure 7 and the structure of the compounds is shown in the corresponding diagrams. The peaks’ heights are normalized to the maximal height of the peak of DPD (m/z)137) at E)0.0 V. Peak assignments will be described elsewhere.38
Approach Curves and Surface Imaging. SCM-MS Approach Curves.The distance-signal curve is one of the most revealing tools in probe microscopies. In addition to the ability to tune the scanning distance in order to attain optimal spatial resolution, it provides additional information about the nature of the examined surface. This is true for all probe microscopies (e.g., STM, AFM, and NSOM), as well as the positive or negative feedback modes of SECM.71
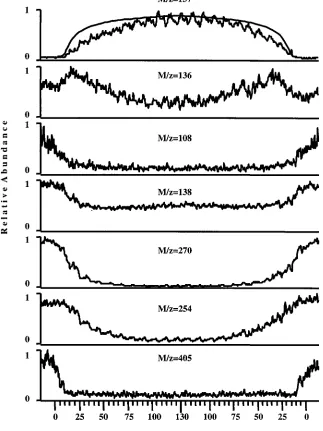
Figure 8 depicts concentration-distance dependence of several key products of DPD oxidation. The electrode potential was held at E)1.0 V during this experiment. The capillary head was first placed on the flat Pt electrode and then moved stepwise upward in the z direction. DPD concentration increased as the electrode moved away from the surface, but the concentrations of the oxidation products decreased. At a distance of z)130µm from the surface, the scan direction was reversed and the capillary head approached the electrode. The concentration-distance curves of all of the compounds were symmetric relative to the reversal point, showing good reversibility.
The difference between the concentration-distance curves for the various compounds is very pronounced. In general, a higher molecular weight compound results in a steeper approach curve. The characteristic distance at which the abundance of the compound reaches 50% of its ultimate abundance is denoted by the symbol h1/2. For DPD (m/z)137) and for quinonemonoimine (m/z)136), h1/2is 50µm; for the dimer (m/z)270), h1/2)20 µm; and for the trimer (m/z)405), h1/2)10µm. Despite the fact that we did not model reactions in-series, we can explain the observed dependence of h1/2on the oxidation products in view of the numerical results of the diffusion-limited case. Figure 2A shows the steep dependence of the conversion of CA on the thickness of the thin layer cell. The conversion is also a positive function of the redox potential in the product stream. Figure 2 implies that when the capillary head approaches the electrode surface, higher conversion and, thus, higher redox potential in the effluent is obtained. Since the dimers, trimers, and even more so, higher oligomers are more-oxidized species, they are formed at higher redox potentials, which corresponds to closer spacing between the dual capillary head and the electrode.
The distance-concentration curve for DPD was compared with the numerical solution for DPD depletion as a function of distance, eq 7. The first diagram of Figure 8 compares the experimental DPD approach curve with DPD depletion according to the numerical solution, calculated using the following values of parameters: D)5 10-6cm2s-1; F0)0.4µL min-1; r2)142µm; and r1 ) 12.5 µm. The smooth curve in Figure 8 shows the theoretical prediction of DPD depletion. The experimental conver-sion is somewhat higher than the theoretical prediction for the high conversion portion of the curve (small distances between probe and surface). This is expected because the theoretical model assumes diffusion-controlled conditions without subsequent chemi-cal reactions. Figures 6 and 7 show that the chemichemi-cal reactions of DPD with its oxidation products, yielding the Wurster red cation
(71) Kwak, K.; Bard, A. J. Anal. Chem. 1989, 61, 1221-1227. Figure 6. Mass spectra corresponding to the m/z range of
radical, dimers, and oligomers, are substantial during the elec-trooxidation of DPD.
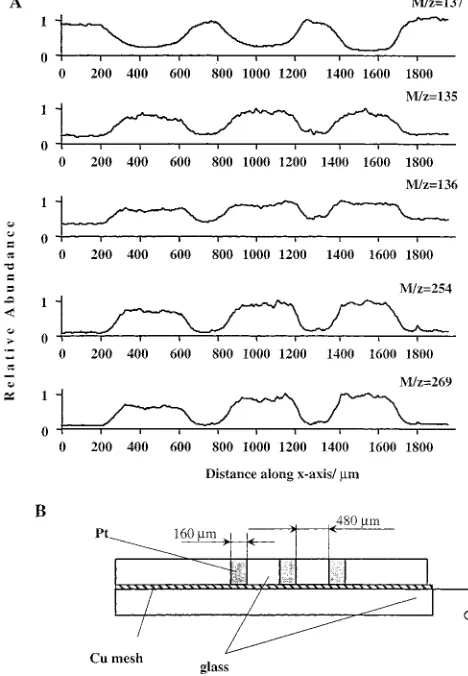
Scanning of Heterogeneous Model Electrodes. Figure 9 A shows the dependence of the concentration of DPD (m/z)137) and the product ions, m/z 135, 136, 254, and 269 on the position of the capillary head versus the 3-strip Pt electrode, which is shown in the frame B. The potential of the Pt strip electrode was
[image:9.612.99.511.39.592.2]which is manifested in a decrease of DPD concentration and a build-up of the product ions. In addition to the ability to discriminate between electroactive and inactive surfaces, the curves show that tracing the more oxidized species, corresponding to the dimers, somewhat increases the resolving power of the SCM-MS. This feature agrees well with the steeper dependence of the approach curves corresponding to higher molecular weight products of Figure 8 (e.g. m/z 254, as compared to 136).
Another example of a one-dimensional study of the electro-catalytical properties of the composite electrode is shown in Figure 10. The sample electrode consisted of a three-layer Cr/Pt/Cr electrode shown in Figure 10, frame E. This example demon-strates the ability of the SCM-MS to resolve different conductive
surfaces on the basis of their different electrocatalytic activity. This is a unique feature of the SECM.13Figure 3, curves 1 and 2, shows that the current-potential dependence of DPD oxidation at Pt and Cr electrodes differs substantially. The anodic current reaches a plateau at E∼0.5 V for the Pt electrode, but for the Cr electrode, the current reaches saturation only at∼E)0.9 V. Thus, at E) 0.7 V, DPD oxidation at the Cr electrode is negligible, as compared to the current measured at the same potential at the Pt electrode. We used this attribute to distinguish between the regions of different electrochemical activity, corresponding to chromium and platinum strips, in the sample electrode.
[image:10.612.147.470.46.477.2]The dependence of the concentrations of DPD, m/z)137, and the compound characterized by m/z)269 on the position of the capillary head over the Cr/Pt/Cr electrode was measured at two electrode potentials, E)0.7 V and E)0.85 V. The 1-D image of the Cr/Pt/Cr electrode at E)0.7 reveals an∼220-µm dip in DPD concentration and a commensurate peak of the ion m/z)269. As expected, the characteristic features on the curve (dip for DPD, and peak for the ion m/z ) 269) are wider than the actual thickness of the Pt strip (∼160µm), because a fairly thick inner capillary (o.d., 285µm) was used in these studies. The chromium coating did not contribute significantly to the oxidation of DPD at this potential; however, at E)0.85 V, DPD oxidation currents at the Cr and Pt electrodes became comparable (Figure 3). Thus, scanning the Cr/Pt/Cr electrode at 0.85 V revealed a different size of electrochemically active area. The width of the DPD depletion region measured at half-height is∼600µm. This value is also somewhat higher than the 520-µm thickness of the sandwich electrode.
CONCLUSIONS
A new method for studying the nonuniform electrochemical activity of electrodes is proposed. The method enables studies of local electrochemical activity by monitoring the changes of the concentration of a test substance and its products at specific locations by mass spectrometry. Unlike existing imaging methods, this probe microscopy can provide subtle details of trace products, byproducts, and reaction intermediates that are generated at specific locations near electroactive surfaces. Even electrochemi-cally and optielectrochemi-cally inactive intermediates and byproducts can be monitored at specific locations near a heterogeneous electrode. Currently, the spatial resolving power of our instrument is far from optimal, but the theoretical resolving power of this instrument lies in the submicrometer domain, which will allow studies of pitting corrosion and biological imaging.
[image:11.612.321.556.42.381.2]We believe that the spatial resolution can be improved significantly in future versions of this instrument. The theoretical calculations support this conclusion. Moreover, both atmospheric-pressure-interfaced mass spectrometry and scanning probe mi-croscopy are booming areas of research, and as such, fast Figure 9. A, dependence of the concentration of DPD (m/z)137)
and its oxidation products (m/z135, 136, and 254) on the location relative to a 3-Pt strip electrode shown in the inset. The capillary head was held at 20µm distance from the surface of the electrode. It was moved stepwise perpendicular to the Pt strips (1 step/30 s; each step, 10µm). The electrode potential wasE)0.8 V; the electrolyte in the cell was 0.1 M trichloroacetic acid in 1:4 water:methanol mixture. The test liquid was 10 mM DPD in 0.1 M trichloroacetic acid in water: methanol mixture. The flow rates wereF0)0.5µL min-1andF1) 4µL min-1. B, Schematic representation of the three-strip Pt test electrode.
[image:11.612.55.289.44.382.2]development in both fields (and particularly the commercializa-tionof affordable and sensitive mass spectrometers) is expected. Future advances in both fields will substantially increase the spatial resolving power of SCM-MS instruments.
This paper centered on the electrochemical application of SCM-MS, but we hope that the integration of scanning concepts and mass spectrometry will benefit other fields involving studies of
nonhomogeneous spatial distribution of chemical concentrations or activity.
ACKNOWLEDGMENT
This research was sponsored by the Israel Science Foundation. Received for review November 21, 2000. Accepted June 14, 2001.