R E S E A R C H
Open Access
Transcriptomic analysis reveals differential
gene expression, alternative splicing, and
novel exons during mouse trophoblast
stem cell differentiation
Rahim Ullah
1, Ambreen Naz
1, Hafiza Sara Akram
1, Zakir Ullah
2, Muhammad Tariq
1, Aziz Mithani
1*and Amir Faisal
1*Abstract
Background:Differentiation of mouse trophoblast stem cells (TSCs) to trophoblast giant cells (TGCs) has been widely used as a model system to study placental development and function. While several differentially expressed genes, including regulators of TSC differentiation, have been identified, a comprehensive analysis of the global expression of genes and splice variants in the two cell types has not been reported.
Results:Here, we report ~ 7800 differentially expressed genes in TGCs compared to TSCs which include regulators of the cell cycle, apoptosis, cytoskeleton, cell mobility, embryo implantation, metabolism, and various signaling pathways. We show that several mitotic proteins, including Aurora A kinase, were downregulated in TGCs and that the activity of Aurora A kinase is required for the maintenance of TSCs. We also identify hitherto undiscovered, cell-type specific alternative splicing events in 31 genes in the two cell cell-types. Finally, we also report 19 novel exons in 12 genes which are expressed in both TSCs and TGCs.
Conclusions:Overall, our results uncover several potential regulators of TSC differentiation and TGC function, thereby providing a valuable resource for developmental and molecular biologists interested in the study of stem cell differentiation and embryonic development.
Keywords:Trophoblast stem cells, Trophoblast giant cells, Placental development, RNA-seq, Stem cell differentiation, Alternative splicing, Differential expression
Background
Cellular differentiation is one of the key processes in mammalian development through which complex cell types and tissues form during embryogenesis. At the blastocyst stage of embryonic development, a single layer of polarized epithelial cells, called trophectoderm, is differentiated and segregated from the inner cell mass [1]. Trophectoderm exclusively gives rise to the placenta,
whereas the inner cell mass produces the rest of the embryo [2,3].
Mouse trophoblast stem cells (TSCs) are derived from the polar trophectoderm of the blastocyst [1] and have been widely used to study placental development [4–6]. TSCs differentiate into large, polyploid trophoblast giant cells (TGCs), which express specific sets of marker genes not found in TSCs [7, 8]. The differentiation of TSCs into TGCs is regulated by a number of factors including cytokines, hormones, protein kinases, transcription fac-tors, proteases, and membrane proteins [9–16]. Removal of fibroblast growth factor 4 (FGF4) from TSC culture
© The Author(s). 2020Open AccessThis article is licensed under a Creative Commons Attribution 4.0 International License, which permits use, sharing, adaptation, distribution and reproduction in any medium or format, as long as you give appropriate credit to the original author(s) and the source, provide a link to the Creative Commons licence, and indicate if changes were made. The images or other third party material in this article are included in the article's Creative Commons licence, unless indicated otherwise in a credit line to the material. If material is not included in the article's Creative Commons licence and your intended use is not permitted by statutory regulation or exceeds the permitted use, you will need to obtain permission directly from the copyright holder. To view a copy of this licence, visithttp://creativecommons.org/licenses/by/4.0/. The Creative Commons Public Domain Dedication waiver (http://creativecommons.org/publicdomain/zero/1.0/) applies to the data made available in this article, unless otherwise stated in a credit line to the data.
* Correspondence:[email protected];[email protected]
1Department of Biology, Syed Babar Ali School of Science and Engineering, Lahore University of Management Sciences, Lahore, Pakistan
media, for example, causes them to differentiate into polyploid TGCs. FGF4 deprivation of TSCs results in downregulation of Cdk1 and Chk1, two kinases critical for cell cycle regulation. This leads to the terminal differentiation of TSCs to TGCs and paves the way for the acquisition of polyploidy without triggering apop-tosis. The process of TSC differentiation is facilitated by the upregulation of CDK specific inhibitors, p57 and p21. While p57 localizes in the nucleus and inhibits TGCs from undergoing mitosis by inhibiting CDK1, p21 is localized to the cytoplasm and prevents TGCs from undergoing apoptosis [15–17]. Suppression of p21 and p57 expression by Chk1 prevents the premature differ-entiation of TSCs into TGCs. Treatment of TSCs with CDK1 inhibitor (RO3306), retinoic acid, or estrogen di-ethylstilbestrol (DES) also promote their differentiation into TGCs [15, 18, 19]. Similarly, hypoxic stress can induce irreversible differentiation of mouse TSCs, even in the presence of FGF4 in the culture medium [5]. Although several factors have been identified which can trigger differentiation of TSCs into TGCs, a broader understanding of the underlying molecular mechanisms leading to TSC differentiation remains elusive.
Human choriocarcinoma cell line BeWo provides another in vitro model of cytotrophoblast differentiation. In response to certain stimuli (e.g., elevated cAMP levels), BeWo cells fuse to form a syncytium, a phenomenon that mimics the fusion of cytotrophoblast cells to form syncy-tiotrophoblast. Interestingly, while CDK1 inhibition triggers differentiation of TSCs to TGCs, its inhibition in BeWo cells triggers the process of cell fusion pointing to both similarities and differences in the two systems [20]. While there is no comprehensive study that deciphers the molecular basis of mouse TSC differentiation, the fusion of BeWo cells has been studied in detail focusing on transcriptomic and epigenomic analysis using RNA seq, genome-wide DNA methylation, and ChIP seq data, re-spectively. The RNA-seq analysis during fusion of BeWo cells revealed alterations in the expression of∼3000 genes, enriched for syncytialization, cell differentiation, morpho-genesis, blood vessel and placental labyrinth development, and steroid hormone response. Similarly, genome-wide DNA methylation analysis using RRBS (reduced represen-tation bisulfite sequencing) determined altered methylation of CpGs associated with cell lineage commitment and differentiation. ChIP-seq analysis revealed the associ-ation of syncytializassoci-ation with transcriptionally active marks among genes that are upregulated [21]. Consid-ering the importance of trophoblast differentiation in mammalian development, it is imperative to perform similar studies in the mouse TSC/TGC system which can result in the identification of key regulators of the differentiation process in a physiological context that may be over-shadowed in the BeWo cancer cell line.
In this study, we examined the gene expression profile of undifferentiated TSCs and differentiated TGCs through next-generation sequencing to determine differentially expressed genes and delineate the mechanism of differen-tiation. Our results have revealed the differential expres-sion of nearly 7800 genes in TSCs/TGCs, including some which were previously known and have been used as markers of differentiation. We have also identified differ-ential alternative splicing and expression of novel exons in both cell types. In particular, differences in alternative splicing in 31 genes and expression of 19 novel exons in 12 different genes in TSCs and TGCs were identified. These findings will enhance the understanding of placen-tal development in mammals at the molecular level and provide a useful resource to the scientific community interested in studying placental biology.
Methods
TSC culture and differentiation into TGCs
TSCs isolated from C57BL/6 laboratory mice were cultured in PMEF-conditioned medium (RPMI) supplemented with 10% ES-FBS (Invitrogen), 1% Antibiotic-Antimycotic (Invi-trogen), 25 ng/ml FGF4 (Sigma), 1μg/ml Heparin (Sigma), 0.1 mM 2-Mercaptoethanol (Sigma), and 1 mM sodium pyruvate (Sigma) at 37 °C in a humidified chamber with 5% CO2as described elsewhere [15,22]. The differentiation of TSCs into polyploid TGCs was induced by growing the cells in RPMI medium supplemented only with 10% FBS and 1% Antibiotic-Antimycotic. For the best differentiation, TSCs were kept in differentiation medium for 4 days. For subculturing, TSCs were detached from the plates with 0.05% trypsin (Sigma-Aldrich) for 5–10 min. Trypsin was inactivated by addition of culture medium to the flasks; cells were centrifuged and resuspended in culture medium and replated at the desired density.
Immunofluorescence staining and confocal microscopy
the penultimate wash), and mounted on the slides using Fluoromount™. Images were taken using a confocal micro-scope (Nikon Model C2+).
Flow cytometry
For FACS analysis, TSCs were cultured in T-25 flasks at a density of 0.1 million for undifferentiated control cells and 1 million for differentiation into TGCs. Cells were collected by trypsinization, washed with 1X PBS (con-taining 1% FBS), and fixed with 75% ice-cold ethanol. Fixed cells were treated with 0.5% RNase A (Invitrogen) to digest RNA and stained with propidium iodide solu-tion (10μg/ml, Invitrogen) for 30 min at 37 °C. The sam-ples were then analyzed on BD FACS Calibur (Becton Dickinson).
Total RNA isolation for global transcriptome analysis
For differential gene expression analysis, TSCs were cultured at a density of 0.2 million for undifferentiated control cells and 2 million for differentiation into TGCs cells in T75 flasks for 4 days. Cells were trypsinized and harvested by centrifugation at 1500 rpm and washed with PBS. Total RNA was extracted from 2 million TSCs and TGCs in three independent experiments using RNeasy Plus Mini Kit (Qiagen) according to the manu-facturer’s protocol. The quality of RNA was measured by running the total RNA on gels and by measuring the 260/280 and 260/230 absorbance ratios. Once the quality of the samples and differentiation were con-firmed, samples were shipped on dry ice to BGI Genom-ics, Hong Kong. Four gigabases of RNA-Seq data was received for each sample (Table S1). The quality controls for each of the six samples were also obtained.
Bioinformatics analysis of RNA-Seq data
RNA-Seq data of TSCs and TGCs was aligned to mouse reference genome MmGRCm38 downloaded from Ensembl using TopHat for downstream analysis. Bioinformatics ana-lysis was performed for the detection of differentially expressed genes and differentially expressed exons, and for the identification of novel exons. Analysis of differential gene expression analysis was carried out using a python script and R packages. The read sequences in the BAM file were first converted into count tables by htseq-count [23]. The resulting tables were then processed by two R packages (EdgeR and DESeq2) for the identification of differentially expressed genes [24,25]. The differential expression (upreg-ulation or downreg(upreg-ulation) was calculated as fold change and presented as log2 of the fold change (Additional files1
and2). Differential expression of exons relative to the over-all expression of the respective genes was detected using JunctionSeq, a Bioconductor package used for differential exon and splice-junction operation in transcriptome data [26]. For the detection of novel exons/genes, we used
AUGUSTUS, a web-based server for prediction of unanno-tated exons [27]. Exons that did not overlap with any of the known exons of respective genes in the Ensembl or GEN-CODE comprehensive transcript database were considered to be novel.
Classification and ontology of differentially expressed genes
Differentially expressed genes were manually grouped into various functionally distinct protein families (genes with > 2-fold difference). For classification into signaling pathways, the Protein Analysis Through Evolutionary Relationships (PANTHER v.15.0) Classification System was used [28]. The gene ontology (GO) analysis of differ-entially expressed genes was performed in the categories of biological process, molecular function, and cellular component using gene ontology resource [29,30].
Experimental validation of differentially expressed genes and exons
Validation of differential expression of the identified genes and exons was carried out through real-time PCR with cDNA made from TSCs and TGCs. To avoid any traces of DNA in the total RNA, samples were DNase treated using Turbo DNase Kit (Ambion, USA). DNase was later inactivated according to the kit protocol. First-strand synthesis was carried out with SuperScript III RT Kit (Invitrogen) and oligodT, in accordance with the manufacturer’s protocol. Quantitative PCR was then performed to quantify the mRNA levels of differentially regulated genes and exons. Actin was used as an internal control for all the experiments. The primers were designed with Primer-Blast and synthesized by Macro-gen, Korea (Table S5) [31]. The PCR reactions (20μl each; performed in triplicate) contained 10μl of 2X SYBER Green PCR Master Mix (Life Technologies, UK), 0.2μl each of the forward (20 pmol) and reverse (20 pmol) primers, and 100 ng cDNA template. The qPCR was performed on Applied Biosystem 7500/7500 Fast Real-Time PCR system (CA, USA). Thermal cycling was performed using machine pre-set two-step cycling protocol. It consisted of 95 °C for 10 min, followed by 40 cycles of 95 °C for 15 s and 60 °C for 1 min.
Data were collected and analyzed by the 7500 real-time PCR System analysis software and exported to Microsoft Excel for final calculations. We used a com-parative CT (threshold cycle) to calculate the relative quantification of gene expression.
ΔCT = CT target−CT reference.
where CT reference is the mean value of Actin and CT target is the CT-mean value for the investigated gene (each sample was run in triplets).
Statistical analysis
The statistical analysis was performed using GraphPad Prism. Two-sided, unpaired t test was performed for each gene and P values < 0.05 were deemed signifi-cant. The level of significance is shown using asterisk (*). *P< 0.05, **P< 0.01, ***P< 0.001, and ****P< 0.0001.
Experimental validation of novel exons
For validation of novel exons, RNA samples and cDNA were prepared as described above. cDNA was subjected to polymerase chain reaction (PCR) amplification using primers targeting novel exons. Each reaction mixture of 20μl contained 100 ng template cDNA, 0.2μl of each forward (20 pmol) and reverse (20 pmol) primers, 2μl 10 X PCR buffer with (NH4)2SO4, 2μl 25 mM MgCl2, 0.2μl of 0.5 unit Taq DNA polymerase (Thermo Scientific), 1μl 10 mM dNTPs (Invitrogen), and 13.4μl PCR water. PCR was carried out in Veriti 96-Well Thermal Cycler (Thermo Fisher Scientific). Amplification was carried out using initial denaturation at 95 °C for 5 min followed by 40 cycles of 95 °C for 1 min, 60 °C for 20–30 s, 72 °C for 20–40 s, and a final extension at 72 °C for 7 min. The PCR product was subsequently resolved on 2% agarose gel and images were taken using ChemiDoc system (BioRad).
Immunoblotting
Immunoblotting was performed from 4 days undifferen-tiated TSCs and differenundifferen-tiated TGCs as described previ-ously [32]. Briefly, cells were lysed with Triton lysis buffer (50 mM NaCl, 20 mM Tris pH 7.5, 1 mM EDTA, 1% Triton X100, 50 mM NaF, protease inhibitors and phosphatase inhibitors) on ice. Cell lysates were cleared by centrifugation and protein concentration was mea-sured by Bradford reagent. Equal amounts of proteins were resolved by SDS-PAGE and transferred onto nitro-cellulose membranes. Membranes were blocked and incubated overnight with primary antibodies (Aurora A; Cell Signaling, Borealin; Novus Biologicals and Tubulin; Santa Cruz). The next day, membranes were washed and incubated with HRP-labeled anti-mouse or anti-rabbit (Abcam) antibodies for 1 h at room temperature. Membranes were washed and developed with ECL on BioRad Chemidoc.
Results
Differentiation of trophoblast stem cells into trophoblast giant cells
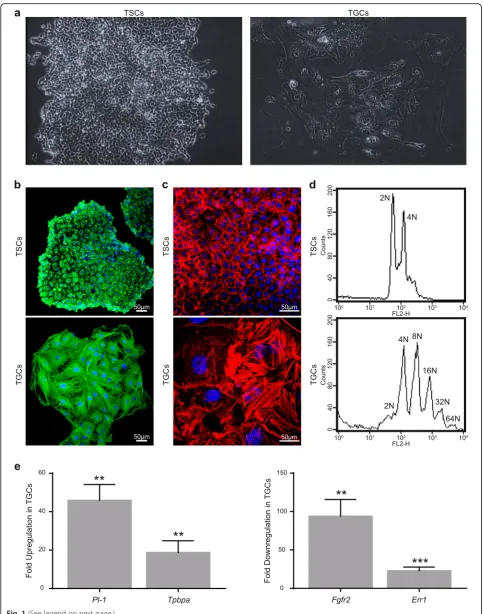
Trophoblast stem cells with diploid genomes are smaller in size and form compact colonies. Once the differenti-ation of TSCs was induced by removing FGF4 from the medium, the cells became progressively larger with very heterogeneous shape, size, and ploidy level (Fig. 1), as described previously [15]. For RNA-Seq analysis, both
TSCs and TGCs populations were confirmed according to various literature-based cytological and molecular criteria [7, 15, 33] (Fig. 1a–d). Morphological changes
associated with the differentiation of TSCs to TGCs, including increased cell size and rearrangement of actin and microtubule cytoskeletons, were seen in TGCs (Fig. 1a–c). Similarly, TGCs were polyploid with multiple
copies of genome ranging from 4N to as high as 64N [34] (Fig. 1d). At the molecular level, the expression of TGC-specific markers, placental lactogen-1 (Pl-1), and trophoblast-specific protein alpha (Tpbpa) were markedly upregulated in TGCs as compared to TSCs. Conversely, TSC-specific markers, estrogen-related receptor alpha (Err1) and fibroblast growth factor receptor 2 (Fgfr2), were downregulated in TGCs compared to TSCs (Fig. 1e). All these data confirm that we had a bona fide population of TSCs and TGCs for our subsequent experiments.
Genome-wide differential gene expression in TSCs and TGCs
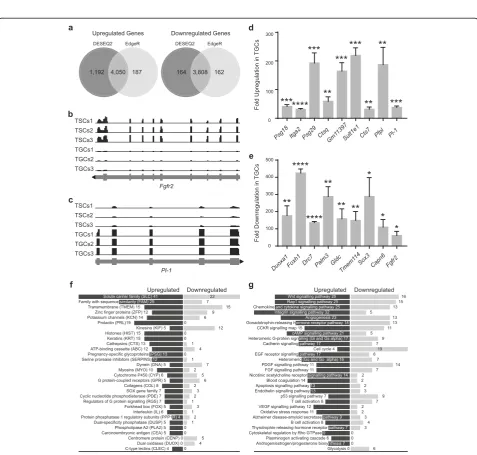
Significant changes in the expression of 9214 and 8207 genes were identified using DESeq2 and EdgeR, respect-ively, with a false discovery rate of < 0.05 (7858 overlap-ping genes identified by both the packages; Fig. S1). These represent approximately 20% and 18% of the total genes in the mouse genome with nucleotide sequence data [35]. Among the genes downregulated in TGCs, a total of 3972 and 3970 genes were identified using DESeq2 and EdgeR, respectively, with 3808 overlapping genes. Similarly, the number of upregulated genes identi-fied by DESeq2 and EdgeR were 5242 and 4237, respect-ively, with 4050 genes identified by both R packages (Fig. 2a). Several genes known to be differentially regu-lated in TGCs were identified in our analysis (Table S2) thereby validating both the differentiation of TSCs and the analysis of differential gene expression. Read cover-ages for fibroblast growth factor receptor 2 (Fgfr2) and placental lactogen-1 (Pl-1) are shown as examples of genes downregulated and upregulated in TGCs, respect-ively (Fig.2b, c).
Validation of differentially regulated genes
Next, we validated the expression of some of the top differentially regulated genes through real-time PCR. Eight different genes from each of the top 15 upregu-lated and downreguupregu-lated genes in TGCs were analyzed. The expression of Psg18, Itga2, Psg29, Ctsq, Gm11397,
(See figure on previous page.)
Fig. 1Differentiation and characterization of mouse trophoblast cells.aRepresentative bright-field images of undifferentiated and differentiated trophoblast cells.bImmunofluorescence imaging of TSCs and TGCs stained with alpha-tubulin. Cells were fixed with paraformaldehyde and stained with alpha-tubulin and Alexa Flour 488-conjugated secondary antibodies. DAPI was used for nuclear (DNA) staining (blue).cImmunofluorescence imaging of TSCs and TGCs for actin. Cells were fixed with paraformaldehyde and stained with Texas red phalloidin and DAPI.dInduction of polyploidy in differentiated TGCs. TSCs and TGCs were fixed, stained with propidium iodide, and analyzed through FACS.emRNA expression analysis of TSC and TGC specific markers before and after differentiation. Expression levels of TGC-specific markers,Pl-1andTpbpa(left), and TSC-specific markersErr1and
Fgfr2(right) were analyzed through real-time PCR. Error bars represent SEM for 3 independent biological replicates.
the expression pattern of cell-type-specific markers further validated the reliability of our RNA-seq data.
Classification of the differentially expressed genes
Analysis of differential expression (at least 2-fold difference) of genes encoding functionally distinct protein families revealed solute carrier family (SLC) proteins to be the most affected with 41 upregulated and 22 downregulated genes in TGCs (Fig.2f). The next largest group of proteins was the family with sequence similarity (FAM; 25 upregulated and 7 downregulated genes) followed by transmembrane (TMEM) and zinc finger proteins (ZFP) families. A large number of genes encoding for prolactins (PRL), histones (HIST), keratins (KRT), and pregnancy-specific glycopro-teins (PSG) were exclusively upregulated in TGCs. No genes encoding members of these protein families were downregulated, implicating their TGC-specific roles (Fig. 2f). Regulated expression of proteins belonging to these groups is critical for the normal function of TGCs and healthy outcome of pregnancy. Targeted deletion of type I keratins, K18 and K19 (2.33- and 3-fold increase in TGCs) in mice, for example, results in fragile TGCs that cause embryonic lethality [36]. Similarly, the lethality of K8 knockout (type II keratin with 3-fold increase in TGCs) embryos results from failure of TGCs barrier function [37]. Other keratins with even higher expression in TGCs include K13 (9-fold), K14 (7.2-fold), K36 (6.6-fold), K37 (5-fold), K25 (4-(5-fold), K16 (4.15-(5-fold), and K15 (4.11-fold). Whether these keratins are also as critical in TGC function and embryonic development remains to be determined.
Differentiation of mouse TSCs into TGCs is associated with changes in activities of different cellular pathways and increased ploidy level. Grouping of differentially expressed genes (at least 2-fold change) according to their roles in various pathways revealed almost exclusive expression of components of some of the key cellular pathways in one or the other cell type (Fig. 2g). Genes encoding components of integrin signaling, for example, were overwhelmingly upregulated in TGCs (32 upregu-lated versus 5 downreguupregu-lated genes). Expression of genes involved in cytoskeletal regulation by Rho GTPase, plasminogen activating cascade, and androgen/estrogen/ progesterone biosynthesis was exclusively upregulated in TGCs (9, 6, and 7 upregulated genes respectively, versus downregulation of none). Activation of pathways in trophoblast cells involving these upregulated genes is critical for the successful blastocyst invasion and implant-ation into the endometrium [38–40]. Regulated expression of integrins, for example, is critical for implantation; anomalies in integrin expression, therefore, can result in placental diseases including preeclampsia [41]. Some other important pathways that showed domination of upregu-lated genes in TGCs include cAMP signaling, cadherin signaling, EGF receptor signaling, nicotine acetylcholine
receptor signaling, blood coagulation, endothelin signal-ing, VEGF signalsignal-ing, and oxidative stress response. On the contrary, genes involved in the glycolytic pathway and cell cycle regulation were exclusively or mostly downregulated in TGCs indicating their trophoblast stem cell-specific functions (Fig.2g).
Gene ontology enrichment analysis of differentially expressed genes
To determine the functionality of differentially expressed genes (with at least 2-fold change), gene ontology (GO) analysis was performed. Significantly enriched GO terms (Fisher’s exact test, FDR-adjusted p value < 0.05) were obtained from the enrichment of differentially expressed genes into biological process, molecular function, and cellular component categories (Additional files3,4,5,6,
7 and 8). The total number of GO terms obtained for upregulated and downregulated differentially expressed genes were 748 and 849, respectively. For the upregulated genes, significantly enriched GO terms (classified by fold enrichment value) in the category of biological process were regulation of lactation, TGC differentiation, cellular re-sponse to VEGF stimulus, maternal placenta development, and female pregnancy (Fig. S2A, Additional file3). The top significantly enriched GO terms in the category of molecu-lar function were prolactin receptor binding, cell adhesion mediator activity, and calcium-dependent phospholipid binding (Fig. S2B, Additional file 4). The cellular compo-nent category included integrin complex, euchromatin, and protein complexes involved in cell adhesion (Fig. S2C, Additional file5). The enrichment of GO terms for upregu-lated genes, therefore, reflects processes, molecular func-tions, and cellular components that are involved in TGC function and implantation.
For the downregulated genes, the top significantly enriched GO terms in the biological process category were centrosome separation, regulation of smooth muscle cell chemotaxis, and regulation of attachment of spindle micro-tubules to the kinetochore (Fig. S2A, Additional file6); the molecular function category included DNA replication ori-gin binding, damaged DNA binding, and DNA-dependent ATPase activity (Fig. S2B, Additional file 7) and for the cellular component category, Ndc80 complex, NMS com-plex, and chromosome passenger complex were present (Fig. S2C, Additional file 8). Enrichment of most of these terms indicates reduced processes, molecular functions, and cellular components involved in cell division.
Validation of Aurora A kinase as a regulator of mouse TSC differentiation
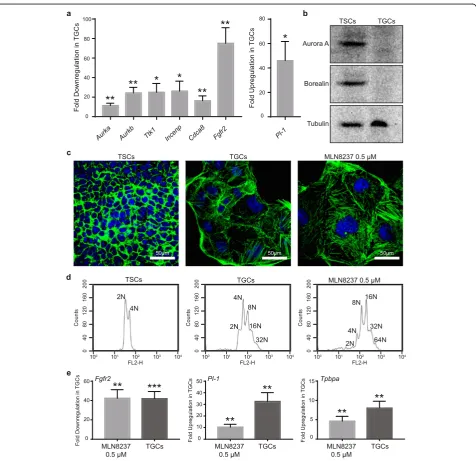
Incenp, andCdca8) were selected for validation through real-time PCR. The proteins encoded by these genes are involved in initiation and progression through mitosis and include components of the chromosomal passenger complex (CPC). As expected, the expression of all five selected genes, Aurka, Aurkb, Ttk1, Incenp, and Cdca8
was significantly downregulated in the differentiated TGCs (Fig. 3a). Furthermore, the expression of Aurora
A (Aurka) and Borealin (Cdca8) proteins was also sig-nificantly reduced in TGCs compared to TSCs (Fig.3b).
Aurora A kinase is required for embryonic stem cell (ESC) self-renewal and pluripotency and its downregula-tion leads to differentiadownregula-tion of ESCs [42]. Reduced Aur-ora A expression in TGCs prompted us to hypothesize that Aurora A may also be required for self-renewal of TSCs and its inhibition may result in their differentiation
into TGCs. We, therefore, probed the role of Aurora A in the differentiation of TSCs through inhibition of Aurora A activity. Treatment of TSCs for 3 days with Aurora A-specific inhibitor, MLN8237 (0.5μM), in-duced differentiation in the presence of FGF4 as demonstrated by the increase in cell and nuclear size as well as induction of polyploidy (Fig. 3c, d). At the molecular level, MLN8237-induced differentiation was confirmed through a significant increase in expression of TGC-specific markers, Pl-1 and Tpbpa, and de-crease in expression of TSC-specific marker Fgfr2 in TGCs (Fig. 3e). Results from a phenotypic chemical genetic screen in our lab show that several Aurora A-specific (MLN8237, MLN8054, and MK-8745), Aurora B-specific (AZD1152 and GSK1070916), and pan-Aurora in-hibitors (VX-680, PHA739358, CCT137690, AMG-900, SNS-314, and CYC116) induce TSC differentiation as deter-mined by the increased nuclear size (Table S3 and Fig. S3; manuscript for the complete screen in preparation). A simi-lar kinase inhibitor screen recently identified that several Aurora kinase inhibitors (including CCT137690, MLN8237, AT9283, and TC-A-2317) reduce CDX2 (a stem cell marker) expression in TSCs, thereby inducing their differen-tiation [43]. Thus, we conclude that Aurora A is required for maintaining the stemness of TSCs and inhibition of its activity results in their differentiation.
Differential expression of exons in TSCs and TGCs
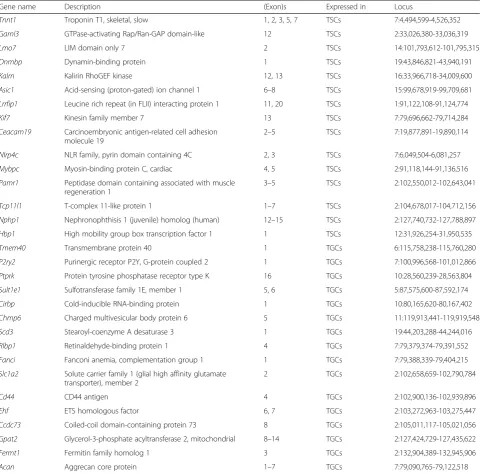
Transcript variants resulting from differential expression of exon(s) may play a role in trophoblast stem cell differ-entiation or function by encoding functionally distinct protein isoforms in TSCs and TGCs. We, therefore, analyzed the RNA-seq data for transcript variants and identified that exons in 31 genes were differentially expressed in these two cell types (Methods; Table 1). Specific expression of one or more exons in 15 genes was seen in TSCs while one or more exon(s) in 16 other genes were found to be specifically expressed in TGCs (Table1). Read coverage of five different exons (exons 1, 2, 3, 5, and 7) inTnnt1 gene, for example, was seen only in TSCs (Fig.4). Exons 4 and 6, on the contrary, had no read coverage in both TSCs and TGCs (Fig. 4a). TSC-specific expression of exons in theTnnt1 gene was con-firmed by PCR amplification of cDNA region covering exons 2 to 7 (122 bp) using specific primers (Fig. 4b, c). Moreover, the amplification of TSC-specific exons of
Tnnt1 gene using real-time PCR showed significant downregulation of expression in TGCs (P≤0.01; Fig.4d), thereby validating their differential expression in the two cell types. Similar validation of cell type-specific expres-sion of exons in nine different genes was done through cDNA amplification from both cell types with real-time PCR (Fig. S4). The expression of specific exons (Table1) in Garnl3, Lrrfip1, Lmo7, Dnmbp, Kalrn, and Asic1
genes was significantly downregulated whereas the expression of some exons inTmem40,P2ry2, and Ptprk
genes was significantly upregulated in TGCs compared to TSCs (Fig. S4b and c). The differential expression of
Pl-1 and Fgfr2 in the same experiment confirmed the differentiation at the molecular level (Fig. S4b and c).
Identification of novel exons in trophoblast cells
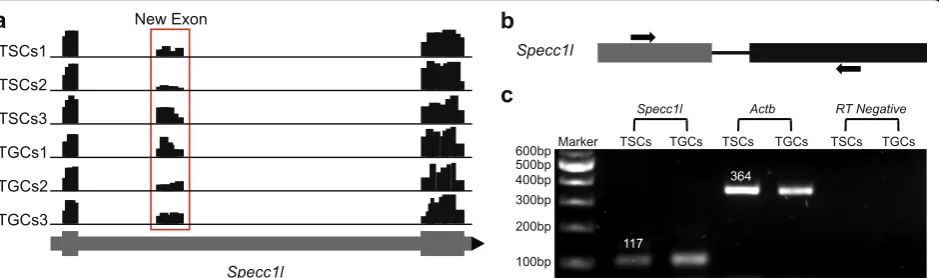
Due to the paucity of available data for trophoblast cells at a single base resolution, we also sought to identify the presence of novel exons in the mouse genome using the RNA-seq data. We found a total of 19 novel exons in 12 different genes for which no annotation was present in the Ensembl genome or GENCODE Comprehensive database (Methods; Table 2). The expression of ten of these novel exons was validated through PCR amplifica-tion of cDNA prepared from TSCs and TGCs (Fig. 5
and S5). Most of the novel exons had read coverage over the mapped region of the mouse genome in both undif-ferentiated TSCs and difundif-ferentiated TGCs suggesting that expression of these exons might be trophectoderm specific. The novel exon detected inSpecc1lgene, for ex-ample, had read coverage in all the replicates of both TSCs and TGCs (Fig.5a).
On the other hand, novel exon identified in the sil1
gene showed read coverage only in the three replicates of TGCs (Fig. S5a). For PCR amplification of the novel exons from the cDNA, two different strategies were used for primer designing. Some exons were validated using forward and reverse primer designed in different exons while others were validated using the primer pairs designed within a single novel exon (Fig. S5b). For validation of the novel exon identified in Specc1l gene, forward and reverse primers were designed in the reported and the newly identified exons, respectively (Fig. 5b). The resulting amplification of a 117 bp PCR product confirmed the expression of new exon and that no intronic region was amplified (Fig. 5c). The PCR amplification using specific primers also validated the TGC-specific expression of novel exon detected in the
Sil1 gene in accordance with the read coverage data of IGV. The read coverage, primer designs, and PCR ampli-fication for eight more genes are shown in Supplemen-tary Fig. 5. Amplification of actin with reverse and forward primers in two different exons (364 bp product size without introns) ruled out any false positives from the genomic DNA contamination in cDNA from both TSCs and TGCs. Finally, new gene models predicted by AUGUSTUS [27] were built for all the genes in which novel exons were identified (Fig. S6).
Discussion
genes that have not been previously implicated in TSC differentiation or TGC function. We also discovered differential alternative splicing and expression of novel exons in the two cell types which may be specific for the trophectoderm lineage. Genes encoding components of various signaling pathways and cellular processes were among those that were identified to be differentially regu-lated in the two cell types. For example, mitotic proteins Aurora A kinase (Aurka) and components of the chromo-somal passenger complex (CPC), Aurkb, Ttk1, Incenp,
Cdca8, and Birc5 were significantly downregulated in
TGCs. Since Aurora A and CPC complex regulate key mi-totic events, from mimi-totic entry to chromosome alignment and cytokinesis [44], their downregulation may be respon-sible for preventing mitotic cell division and promoting differentiation in TSCs. Indeed, the inhibition of Aurora kinases with small-molecule inhibitors targeting only Aur-ora A (MLN8237) or both AurAur-ora A and B (CCT137690) induced differentiation of TSCs (Fig. 3, Table S3 and Fig. S3). A recent kinase inhibitor screen for inducers of TSC differentiation also identified Aurora kinase inhibitors in-cluding CCT137690 [43]. CDK1 activity is required for Table 1Genes with differentially expressed exons in TSCs (15 genes) or TGCs (16 genes) are shown. The number of differentially expressed exons and the respective gene loci are also shown
Gene name Description (Exon)s Expressed in Locus
Tnnt1 Troponin T1, skeletal, slow 1, 2, 3, 5, 7 TSCs 7:4,494,599-4,526,352
Garnl3 GTPase-activating Rap/Ran-GAP domain-like 12 TSCs 2:33,026,380-33,036,319
Lmo7 LIM domain only 7 2 TSCs 14:101,793,612-101,795,315
Dnmbp Dynamin-binding protein 1 TSCs 19:43,846,821-43,940,191
Kalrn Kalirin RhoGEF kinase 12, 13 TSCs 16:33,966,718-34,009,600
Asic1 Acid-sensing (proton-gated) ion channel 1 6–8 TSCs 15:99,678,919-99,709,681
Lrrfip1 Leucine rich repeat (in FLII) interacting protein 1 11, 20 TSCs 1:91,122,108-91,124,774
Kif7 Kinesin family member 7 13 TSCs 7:79,696,662-79,714,284
Ceacam19 Carcinoembryonic antigen-related cell adhesion molecule 19
2–5 TSCs 7:19,877,891-19,890,114
Nlrp4c NLR family, pyrin domain containing 4C 2, 3 TSCs 7:6,049,504-6,081,257
Mybpc Myosin-binding protein C, cardiac 4, 5 TSCs 2:91,118,144-91,136,516
Pamr1 Peptidase domain containing associated with muscle regeneration 1
3–5 TSCs 2:102,550,012-102,643,041
Tcp11l1 T-complex 11-like protein 1 1–7 TSCs 2:104,678,017-104,712,156
Nphp1 Nephronophthisis 1 (juvenile) homolog (human) 12–15 TSCs 2:127,740,732-127,788,897
Hbp1 High mobility group box transcription factor 1 1 TSCs 12:31,926,254-31,950,535
Tmem40 Transmembrane protein 40 1 TGCs 6:115,758,238-115,760,280
P2ry2 Purinergic receptor P2Y, G-protein coupled 2 1 TGCs 7:100,996,568-101,012,866
Ptprk Protein tyrosine phosphatase receptor type K 16 TGCs 10:28,560,239-28,563,804
Sult1e1 Sulfotransferase family 1E, member 1 5, 6 TGCs 5:87,575,600-87,592,174
Cirbp Cold-inducible RNA-binding protein 1 TGCs 10:80,165,620-80,167,402
Chmp6 Charged multivesicular body protein 6 5 TGCs 11:119,913,441-119,919,548
Scd3 Stearoyl-coenzyme A desaturase 3 1 TGCs 19:44,203,288-44,244,016
Rlbp1 Retinaldehyde-binding protein 1 4 TGCs 7:79,379,374-79,391,552
Fanci Fanconi anemia, complementation group 1 1 TGCs 7:79,388,339-79,404,215
Slc1a2 Solute carrier family 1 (glial high affinity glutamate transporter), member 2
2 TGCs 2:102,658,659-102,790,784
Cd44 CD44 antigen 4 TGCs 2:102,900,136-102,939,896
Ehf ETS homologous factor 6, 7 TGCs 2:103,272,963-103,275,447
Ccdc73 Coiled-coil domain-containing protein 73 8 TGCs 2:105,011,117-105,021,056
Gpat2 Glycerol-3-phosphate acyltransferase 2, mitochondrial 8–14 TGCs 2:127,424,729-127,435,622
Fermt1 Fermitin family homolog 1 3 TGCs 2:132,904,389-132,945,906
activation of Aurora A during G2/M transition [45]. Unlike mitotic cells, TGCs do not undergo G2/M transition and do not have CDK1 activity [15]. Thus, it is quite conceiv-able that TGCs will not need Aurora A activity and expres-sion. In total, 19 genes involved in cell cycle regulation
were downregulated in TGCs compared to only 4 that were upregulated. Two of the upregulated genes involved in the cell cycle are Ccne2 and Cdk6. During differentiation of TSCs,Ccne2andCdk6might facilitate the transition into S phase and assembly of pre-replication complexes on DNA Fig. 4Experimental validation of differentially expressed exons inTnnt1gene.aIGV snapshot of differentially expressed exons identified inTnnt1
gene. Read coverage of differentially expressed exons 1, 2, 3, 5, and 7 inTnnt1gene are shown in all 3 replicates of TSCs and TGCs. Reference gene track is shown at the bottom (gray line) with bars representing the corresponding exons and arrowhead (black) showing the orientation of the gene.bPrimer design strategy used for the amplification of differentially expressed exons inTnnt1gene. Boxes represent differentially expressed exons (black) in TSCs and exons with no expression (dark gray) in both TSCs and TGCs. Forward primer (top arrow) spanned exons 2 and 3 while reverse primer (bottom arrow) was in exon 7. Connecting line (black) between the boxes represents the intronic region.cDifferential amplification ofTnnt1gene in TSCs and TGCs. Specific exons inTnnt1gene and actin were amplified from TSCs and TGCs through PCR. Gel image of the PCR-amplified products ofTnnt1gene and the positive control (actin) from TSCs and TGCs is shown. PCR amplification from RT-negative (without reverse transcriptase) samples with actin primers represents the RT-negative control.dmRNA expression analysis of differentially expressed exons inTnnt1gene by quantitative real-time PCR. Error bars represent SEM of 3 independent biological replicates.
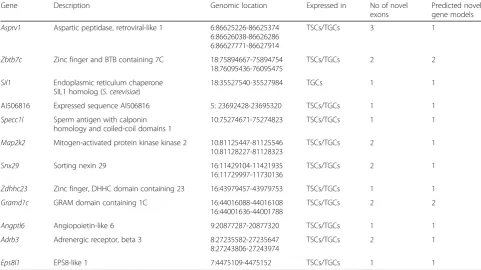
Table 2Genomic location, number of novel exon(s) identified in each gene, and number of novel predicted gene models are shown in the table
Gene Description Genomic location Expressed in No of novel
exons
Predicted novel gene models
Asprv1 Aspartic peptidase, retroviral-like 1 6:86625226-86625374 6:86626038-86626286 6:86627771-86627914
TSCs/TGCs 3 1
Zbtb7c Zinc finger and BTB containing 7C 18:75894667-75894754 18:76095436-76095475
TSCs/TGCs 2 2
Sil1 Endoplasmic reticulum chaperone SIL1 homolog (S.cerevisiae)
18:35527540-35527984 TGCs 1 1
Ai506816 Expressed sequence AI506816 5: 23692428-23695320 TSCs/TGCs 1 1
Specc1l Sperm antigen with calponin homology and coiled-coil domains 1
10:75274671-75274823 TSCs/TGCs 1 1
Map2k2 Mitogen-activated protein kinase kinase 2 10:81125447-81125546 10:81128227-81128323
TSCs/TGCs 2 1
Snx29 Sorting nexin 29 16:11429104-11421935
16:11729997-11730136
TSCs/TGCs 2 1
Zdhhc23 Zinc finger, DHHC domain containing 23 16:43979457-43979753 TSCs/TGCs 1 1
Gramd1c GRAM domain containing 1C 16:44016088-44016108 16:44001636-44001788
TSCs/TGCs 2 2
Angptl6 Angiopoietin-like 6 9:20877287-20877320 TSCs/TGCs 1 1
Adrb3 Adrenergic receptor, beta 3 8:27235582-27235647 8:27243806-27243974
TSCs/TGCs 2 1
for re-replication [46,47]. This finding is in agreement with recent gene expression profiling of human trophoblast differentiation using microarrays, where several cell cycle-related genes were downregulated in syncytiotrophoblasts [48] and supports the observation that TGCs do not undergo a conventional mitotic cell cycle. Some of the genes (e.g., Cdc6,Cdc20, and Ccnb2) were downregulated in both systems.
Sox3, a member of the SOX family of transcription factors that make cell fate decisions during development [49], was downregulated in TGCs. Since TGCs are terminally differentiated, downregulation of Sox3will be a logical step for them. Previous studies have identified thatSox21, another downregulated SOX family member in TGCs, is highly expressed in TSCs and is implicated in their differentiation into TGCs [50]. Another tran-scription factor, Stox1, was upregulated in TGCs (2.93-fold increase); its loss of function is associated with preeclampsia in a large cohort of Dutch females indicat-ing the significance of the elevated expression in TGCs [51]. Six genes involved in the glycolytic pathway were downregulated in TGCs compared to none in the TSCs; this corroborates the reported higher metabolic activity of undifferentiated cytotrophoblasts as compared to differentiated syncytiotrophoblasts [52]. Similarly, FGF4 has been shown to maintain stemness in TSCs by decreas-ing the mitochondrial electron transport chain and increas-ing aerobic glycolysis at all oxygen concentration [53].
Placental syncytiotrophoblasts require members of the ATP-binding cassette (ABC) and solute carrier (SLC) transport families for the transport of nutrients and hormones [54]. Altered expression of a large num-ber of transporters from both these families in TGCs compared to TSCs reflects a change in the functional
properties of two cell types. Some gene families, with a direct link to TGC function, were exclusively expressed in TGCs. For example, genes encoding for prolactins (PRL), involved in maintenance of pregnancy, keratins (KRT), involved in cytoskeletal remodeling of tropho-blasts, and pregnancy-specific glycoproteins (PSG), involved in immune and metabolic regulation during pregnancy, were all expressed predominantly in TGCs [55–57]. Likewise, an increase in the expression of 15 genes encoding histone proteins in TGCs represents an increased histone demand for a polyploid genome in TGCs. Expression of histone variants at the expense of conventional histones in TGCs has been shown to be responsible for a loosely arranged chromatin structure in TGCs [58]. Instead, we found an increase in the expression of most conventional histone and a decrease in the expression of most histone variants in TGCs. Further studies are needed to reconcile this difference.
formation [63] was expressed at elevated levels in TGCs. Similarly, we discovered that genes encoding 13 different cathepsin proteases, some of which are known to promote trophoblast differentiation and invasion [64], were upregulated in TGCs.
Differentiation into TGCs is associated with the reorganization of the actin cytoskeleton and large focal ad-hesion formation [65]. We also found extensive rearrange-ments of the actin cytoskeleton in the form of stress fiber formation in TGCs (Fig. S7). This is supported by the up-regulation of several myosin genes and regulators of Rho GTPases in TGCs, two key protein families involved in stress fiber formation. Expression of LIM domain kinase 1 (Limk1), involved in the regulation of actin microfilament and control of microtubule dynamics [66], was also upreg-ulated by 3.5-folds. LIMK1 downregulation is associated with preeclampsia [67]; its upregulation in TGCs, there-fore, could regulate extensive cytoskeletal rearrangements upon differentiation and thereby may have a role in im-plantation. Genes encoding tubulin proteins (Tubb1 and
Tubal3) and proteins involved in tubulin polymerization were upregulated in TGCs. For example, genes encoding microtubule stabilizing proteins, microtubule-associated protein 1B (Map1b) [68], stabilizer of axonemal microtu-bules 1 (Saxo1) [69], tubulin polymerization promoting protein family member 3 (Tppp3) [70], and tektin family members (Tekt2, Tekt3, andTekt4) [71] were all upregu-lated in TGCs. Uterine TPPP3 expression is reported to play an important role in embryo implantation through the TGF beta pathway [72]. Expression of Capn6 gene encoding another microtubule-stabilizing protein [73], however, was downregulated in TGCs. Genes for micro-tubule destabilizing stathmin-like proteins (Stmn3 and
Stmn4) were also upregulated in TGCs; increased expres-sion of stathmin is associated with trophoblast migration and differentiation [74]. The upregulation of both micro-tubule stabilizing and destabilizing proteins indicates the highly dynamic nature of microtubules during and after differentiation and is consistent with TGC function. Inhib-ition of microtubule dynamics with microtubule depoly-merizing drug, colchicine, does inhibit differentiation of trophoblasts [75]. Remodeling of the microtubule and actin cytoskeleton together with the exclusive upregula-tion of 15 genes from the largest intermediate filament protein family (keratins) indicates a major role cytoskel-eton plays in differentiation and function of mouse trophoblasts.
RNA-seq analysis in this study revealed three times more differentially expressed genes associated with the differentiation of mouse trophoblast cells as compared to the fusion of BeWo cells [21, 76]. TGCs are distinct from fused BeWo cells in several ways. For example, unlike fused BeWo cells, TGCs continue to synthesize DNA after differentiation and attain a higher level of
polyploidy. They have a modified cell cycle in which cells do not go through the M-phase, which is required for cell division. BeWo cells, on the contrary, do not undergo genome duplication through DNA synthesis [77]. Moreover, TGCs are derived from developmentally normal TSCs while BeWo is a cancer cell line and hence is likely to have an altered gene expression profile. Differential expression from either of these studies may not be a complete representation of molecular events controlling trophoblast differentiation during placenta formation. We did, however, observe evolutionarily con-served expression patterns for 229 upregulated and 176 downregulated genes (not less than 1.5-fold) during dif-ferentiation of mouse trophoblasts (at 4 days) and fusion of BeWo cells (at 3 days) (Table S4). For example,Cdk1
is downregulated both during differentiation of TSCs (− 2.27) and fusion of BeWo cells (−1.6). The function of
Cdk1 is also conserved as its inhibition induces both, the differentiation in TSCs and the fusion in BeWo cells [15,
20]. Other examples of genes with similar expression pat-tern in both systems include several upregulated (Cd68,
Basp1,Cyp11a1,Egfr,Nostrin,Cdkn1a,Gata3) and down-regulated (Plk1, Ccnb1,Cdk18,Gata6,Hmgb2,Myoz1and
Bmp4) genes (Table S4) [21,76].
ablation of these exons in TSCs or TGCs can be used to determine any specific role they may play in differenti-ation of TSCs into TGCs.
RNA-seq data also revealed 19 previously unannotated exons in 12 different genes. One of the genes in which two novel exons are identified is Map2k2. Map2k2 (mitogen-activated protein kinase kinase 2) has been re-ported to play a role in the formation of multinucleated TGCs during placentation [84]. Expression of putative novel exons could generate novel splice variants encod-ing proteins with TSC- or TGC-specific functions. The identification of novel exons, not present in the current annotations of mouse genes, highlights the weakness of existing mouse gene catalogs and thereby will help in filling the gap in the mouse transcriptome.
Conclusions
In conclusion, our data points to transcriptional diversity and differential transcriptome in mouse TSCs and TGCs that was not known previously. Differential expression of some of these genes indicates a shift in the functional properties of TGCs as they differentiate from TSCs. Func-tional validation of these genes will not only enhance our understanding of mammalian development but could also lead to finding ways to treat placental abnormalities and diseases which often lead to premature childbirth.
Supplementary information
Supplementary informationaccompanies this paper athttps://doi.org/10. 1186/s13287-020-01848-8.
Additional file 1.
Additional file 2.
Additional file 3.
Additional file 4.
Additional file 5.
Additional file 6.
Additional file 7.
Additional file 8.
Additional file 9: Figure S1.Venn diagram showing the number of differentially regulated genes identified as significant by DESEQ2 and EdgeR in TGCs compared to TSCs. The overlap shows the number of differentially regulated genes identified both by DESEQ2 and EdgeR.
Additional file 10: Figure S2.Gene Ontology enrichment analysis of differentially expressed genes in TGCs in the Biological Processa, Molecular functionband Cellular componentccategories. The selected 10 GO terms in each category were over-represented by > 2-fold enrich-ment value, with FDR values < 0.05. Fold enrichenrich-ment values are given with each GO term on X-axis.
Additional file 11: Figure S3.Differentiation phenotype induced by the Aurora inhibitors in TSCs. TSCs were treated with 1μM concentration of Aurora inhibitors (identified in the primary chemical genetic screen; Table S3 and unpublished data) in 96-well plates for 72 h. Cells were fixed with paraformaldehyde and stained with phalloidin (green) and DAPI (blue). Images were taken at 60x magnification.
Additional file 12: Figure S4.Experimental validation of differentially expressed exons in 9 selected genes.aIGV snapshots of the selected
differentially expressed exons. Read coverage for TG-specific exons in
Tmem40,P2ry2andPtprkgenes and TS-specific exons inGarnl3,Lrrfip,
Lmo7,Dnmbp,KalrnandAsic1genes are shown in all three replicates. Ref-erence gene track is shown at the bottom (gray line) with bars represent-ing the correspondrepresent-ing exons and arrowhead (black) showing the orientation of the gene.bThe primer pair design strategy for the amplifi-cation of differentially expressed exons. Primer pairs for the amplifiamplifi-cation of differentially expressed exons inTmem40,Ptprk,Lrrfip,Asic1,Garnl3and
Lmo7were designed in different exons while inDnmbp,P2ry2 and Kalrn, the primer pairs were designed only in differentially expressed exons. Rectangles represent differentially expressed (black) and non-differentially expressed (dark gray) exons while arrows (black) represent forward (top) and reverse (bottom) primers. The two exons are separated by the in-tronic region (black line).cmRNA expression analysis of differentially expressed exons in TSCs and TGCs by quantitative real-time PCR. Actin was employed as an internal control for all genes. Error bars represent SEM of 3 independent biological replicates.
Additional file 13: Figure S5.Experimental validation of novel exon identified in 8 selected genes.aIGV snapshot of the identified novel exons showing read coverage in all 3 replicates of TSCs (red) and TGCs (blue). Reference gene track is shown at the bottom (blue) with bars representing the corresponding exons and arrowhead (black) showing the orientation of the gene. Novel exons are enclosed by red boxes.b The primer pair design strategy for the amplification of novel exons. Primer pairs for the amplification of novel exons inAsprv1,Zbtb7c,Eps8l1,
Snx29andGramd1cwere designed in different exons while inSil1,
Ai506816andMap2k2, the primer pairs were designed only in novel identified exons. Rectangles represent novel (red) and known (blue) exons while arrows (black) represent forward (top) and reverse (bottom) primers. The two exons are separated from each other by a line (black)
representing intronic region.cPCR amplification of novel exons from TSCs and TGCs. Agarose gel image of the PCR amplified products of novel exon in 9 genes. Amplification of actin from RT+ and RT- (with and without reverse transcriptase) represents positive and negative controls, respectively.
Additional file 14: Figure S6.Novel gene models predicted by AUGUSTUS. Gene models were built for all 14 different genes, showing existing exons (dark blue) and novel exons (red).
Additional file 15: Figure S7.Cytoskeleton staining in TSCs and TGCs with phalloidin, which stains actin (green) and alpha-tubulin (red). Nuclei were stained with DAPI (blue).
Additional file 16: Table S1.After sequencing, the raw reads were filtered. Data filtering included removing adaptor sequences, contamination and low-quality reads from raw reads. The table shows statistical results after data treatment.Table S2.The given log fold change values for each gene were detected by EdgeR. Positive values represent fold upregulation while negative values represent fold down-regulation. References for the reported differential expression is also shown.Table S3.Inhibition of Aurora kinases induces differentiation phenotype (increased nuclear size) in TSCs. Fold increase in nuclear size of TSCs after treatment with 1μM concentration of various Aurora kinase inhibitors (A-specific, Aurora B-specific and pan-Aurora inhibitors) for 72 h in the primary and secondary screens. Relative nuclear size was calculated from the DAPI stained cells in 96-well plates (3 images per well).Table S4.Common differentially expressed genes (upregulated and downregu-lated) identified in 4 days differentiated TGCs RNA-seq data and 3 days fused BeWo RNA-seq data.Table S5.Primers used for experimental val-idation of differentially expressed genes, differentially expressed exons and novel identified exons [7,15,16,33,85–93].
Abbreviations
bp:Base pair; BSA: Bovine serum albumin; cDNA: Complementary deoxyribonucleic acid; DAPI: (4′,6-diamidino-2-phenylindole);
dNTP: Deoxynucleotide triphosphate; EDTA: Ethylene-diamine-tetra-acetic acid; ERR1: Estrogen-related receptor alpha; ES-FBS: Embryonic stem cell fetal bovine serum; FACS: Fluorescence activated cell sorting; FGF4: Fibroblast growth factor 4; FGFR2: Fibroblast growth factor receptor 2;
MgCl2: Magnesium chloride; mRNA: Messenger ribonucleic acid;
PCR: Polymerase chain reaction; PL-1: Placental lactogen-1; PMEF: Primary mouse embryonic fibroblast; RNA: Ribonucleic acid; RT: Reverse transcriptase; Taq:Thermus aquaticus; TGCs: Trophoblast giant cells; TPBPA: Trophoblast-specific protein alpha; TSCs: Trophoblast stem cells
Acknowledgements
We thank Dr. Safee Ullah Chaudhary and Dr. Muhammad Shoaib for carefully reading the manuscript and providing useful insights.
Authors’contributions
AF, AM, and MT conceived and designed the study with RU providing additional input. RU and HSA performed all the experiments. AN, RU, AM, and AF analyzed the data. RU and AF wrote the manuscript. AM, ZU, and MT helped with writing and review of the manuscript. AF supervised the whole study. The authors read and approved the final manuscript.
Funding
We thank the Higher Education Commission (HEC) of Pakistan for funding in the form of National Research Program for Universities (NRPU), grant number 20-2734, and LUMS Faculty Initiative Fund (FIF-444).
Availability of data and materials
The RNA-seq data files from this study have been submitted to the NCBI Se-quence Read Archive (SRA; http://www.ncbi.nlm.nih.gov/sra) under accession number SRP274148.
Ethics approval and consent to participate Not applicable.
Consent for publication Not applicable.
Competing interests
The authors declare no competing interests.
Author details 1
Department of Biology, Syed Babar Ali School of Science and Engineering, Lahore University of Management Sciences, Lahore, Pakistan.2Virginia Commonwealth University, Richmond, USA.
Received: 9 March 2020 Revised: 15 July 2020 Accepted: 22 July 2020
References
1. Roberts RM, Fisher SJ. Trophoblast stem cells. Biol Reprod. 2011;84(3): 412–21.
2. Kunath T, Strumpf D, Rossant J. Early trophoblast determination and stem cell maintenance in the mouse—a review. Placenta. 2004;25:S32–S8. 3. Cross J. How to make a placenta: mechanisms of trophoblast cell
differentiation in mice–a review. Placenta. 2005;26:S3–9.
4. Tanaka S, Kunath T, Hadjantonakis A-K, Nagy A, Rossant J. Promotion of trophoblast stem cell proliferation by FGF4. Science. 1998;282(5396):2072–5. 5. Yang Y, Arenas-Hernandez M, Gomez-Lopez N, Dai J, Parker GC,
Puscheck EE, et al. Hypoxic stress forces irreversible differentiation of a majority of mouse trophoblast stem cells despite FGF4. Biol Reprod. 2016;95(5):110 1-10.
6. Roy S, Kundu TK. Gene regulatory networks and epigenetic modifications in cell differentiation. IUBMB Life. 2014;66(2):100–9.
7. Simmons DG, Fortier AL, Cross JC. Diverse subtypes and developmental origins of trophoblast giant cells in the mouse placenta. Dev Biol. 2007; 304(2):567–78.
8. Hu D, Cross JC. Development and function of trophoblast giant cells in the rodent placenta. Int J Dev Biol. 2009;54(2–3):341–54.
9. Red-Horse K, Zhou Y, Genbacev O, Prakobphol A, Foulk R, McMaster M, et al. Trophoblast differentiation during embryo implantation and formation of the maternal-fetal interface. J Clin Invest. 2004;114(6):744–54.
10. Roberts RM, Ezashi T, Das P. Trophoblast gene expression: transcription factors in the specification of early trophoblast. Reprod Biol Endocrinol. 2004;2(1):47.
11. Gauster M, Moser G, Orendi K, Huppertz B. Factors involved in regulating trophoblast fusion: potential role in the development of preeclampsia. Placenta. 2009;30:49–54.
12. Guzeloglu-Kayisli O, Kayisli UA, Taylor HS, editors. The role of growth factors and cytokines during implantation: endocrine and paracrine interactions. Seminars in reproductive medicine; 2009: NIH Public Access.
13. Kent LN, Konno T, Soares MJ. Phosphatidylinositol 3 kinase modulation of trophoblast cell differentiation. BMC Dev Biol. 2010;10(1):97.
14. Malhotra SS, Banerjee P, Gupta SK. Regulation of trophoblast differentiation during embryo implantation and placentation: implications in pregnancy complications. Journal of Reproductive Health and Medicine. 2016;2:S26–36. 15. Ullah Z, Kohn MJ, Yagi R, Vassilev LT, DePamphilis ML. Differentiation of
trophoblast stem cells into giant cells is triggered by p57/Kip2 inhibition of CDK1 activity. Genes Dev. 2008;22(21):3024–36.
16. Ullah Z, de Renty C, DePamphilis ML. Checkpoint kinase-1 prevents cell cycle exit linked to terminal cell differentiation. Mole Cellular Biol. 2011:MCB. 05723–11.
17. Ullah Z, Lee CY, DePamphilis ML. Cip/Kip cyclin-dependent protein kinase inhibitors and the road to polyploidy. Cell Div. 2009;4(1):10.
18. Tremblay GB, Kunath T, Bergeron D, Lapointe L, Champigny C, Bader J-A, et al. Diethylstilbestrol regulates trophoblast stem cell differentiation as a ligand of orphan nuclear receptor ERRβ. Genes Dev. 2001;15(7):833–8. 19. Yan J, Tanaka S, Oda M, Makino T, Ohgane J, Shiota K. Retinoic acid
promotes differentiation of trophoblast stem cells to a giant cell fate. Dev Biol. 2001;235(2):422–32.
20. Ullah R, Dar S, Ahmad T, de Renty C, Usman M, DePamphilis ML, et al. CDK1 inhibition facilitates formation of syncytiotrophoblasts and expression of human chorionic gonadotropin. Placenta. 2018;66:57–64.
21. Shankar K, Kang P, Zhong Y, Borengasser SJ, Wingfield C, Saben J, et al. Transcriptomic and epigenomic landscapes during cell fusion in BeWo trophoblast cells. Placenta. 2015;36(12):1342–51.
22. Ullah Z, de Renty C, DePamphilis ML. Propagation and differentiation of mouse trophoblast stem cells. Sigma. 1804;1635:500ML.
23. Anders S, Pyl PT, Huber W. HTSeq—a Python framework to work with high-throughput sequencing data. Bioinformatics. 2015;31(2):166–9.
24. Robinson MD, McCarthy DJ, Smyth GK. edgeR: a Bioconductor package for differential expression analysis of digital gene expression data.
Bioinformatics. 2010;26(1):139–40.
25. Love MI, Huber W, Anders S. Moderated estimation of fold change and dispersion for RNA-seq data with DESeq2. Genome Biol. 2014;15(12):550. 26. Hartley SW, Mullikin JC. Detection and visualization of differential splicing in
RNA-Seq data with JunctionSeq. Nucleic Acids Res. 2016;44(15):e127-e. 27. Stanke M, Morgenstern B. AUGUSTUS: a web server for gene prediction in
eukaryotes that allows user-defined constraints. Nucleic Acids Research. 2005;33(suppl_2):W465–W7.
28. Thomas PD, Campbell MJ, Kejariwal A, Mi H, Karlak B, Daverman R, et al. PANTHER: a library of protein families and subfamilies indexed by function. Genome Res. 2003;13(9):2129–41.
29. Ashburner M, Ball CA, Blake JA, Botstein D, Butler H, Cherry JM, et al. Gene ontology: tool for the unification of biology. Nat Genet. 2000;25(1):25–9. 30. Consortium GO. The gene ontology resource: 20 years and still GOing
strong. Nucleic Acids Res. 2019;47(D1):D330–D8.
31. Ye J, Coulouris G, Zaretskaya I, Cutcutache I, Rozen S, Madden TL. Primer-BLAST: a tool to design target-specific primers for polymerase chain reaction. BMC Bioinformatics. 2012;13(1):134.
32. Manzoor S, Bilal A, Khan S, Ullah R, Iftikhar S, Emwas A-H, et al. Identification and characterization of SSE15206, a microtubule depolymerizing agent that overcomes multidrug resistance. Sci Rep. 2018;8(1):3305.
33. Maruyama Y, Matsubara S, Kimura AP. Mouse prolyl oligopeptidase plays a role in trophoblast stem cell differentiation into trophoblast giant cell and spongiotrophoblast. Placenta. 2017;53:8–15.
34. Ullah Z, Lee CY, Lilly MA, DePamphilis ML. Developmentally programmed endoreduplication in animals. Cell Cycle. 2009;8(10):1501–9.
35. Bult CJ, Eppig JT, Blake JA, Kadin JA, Richardson JE, Group MGD. Mouse genome database 2016. Nucleic Acids Res. 2015;44(D1):D840–D7. 36. Hesse M, Franz T, Tamai Y, Taketo MM, Magin TM. Targeted deletion of
keratins 18 and 19 leads to trophoblast fragility and early embryonic lethality. EMBO J. 2000;19(19):5060–70.
38. Wang J, Mayernik L, Armant DR. Trophoblast adhesion of the peri-implantation mouse blastocyst is regulated by integrin signaling that targets phospholipase C. Dev Biol. 2007;302(1):143–53.
39. Halasz M, Szekeres-Bartho J. The role of progesterone in implantation and trophoblast invasion. J Reprod Immunol. 2013;97(1):43–50.
40. Grewal S, Carver JG, Ridley AJ, Mardon HJ. Implantation of the human embryo requires Rac1-dependent endometrial stromal cell migration. Proc Natl Acad Sci. 2008;105(42):16189–94.
41. Merviel P, Challier J-C, Carbillon L, Foidart J-M, Uzan S. The role of integrins in human embryo implantation. Fetal Diagn Ther. 2001;16(6):364–71. 42. Lee D-F, Su J, Ang Y-S, Carvajal-Vergara X, Mulero-Navarro S, Pereira CF,
et al. Regulation of embryonic and induced pluripotency by aurora kinase-p53 signaling. Cell Stem Cell. 2012;11(2):179–94.
43. Lee CQ, Bailey A, Lopez-Tello J, Sferruzzi-Perri AN, Okkenhaug K, Moffett A, et al. Inhibition of Phosphoinositide-3-kinase signaling promotes the stem cell state of trophoblast. Stem Cells. 2019;37(10):1307–18.
44. Carmena M, Wheelock M, Funabiki H, Earnshaw WC. The chromosomal passenger complex (CPC): from easy rider to the godfather of mitosis. Nat Rev Mol Cell Biol. 2012;13(12):789.
45. Van Horn RD, Chu S, Fan L, Yin T, Du J, Beckmann R, et al. Cdk1 activity is required for mitotic activation of aurora A during G2/M transition of human cells. J Biol Chem. 2010;285(28):21849–57.
46. Caldon CE, Musgrove EA. Distinct and redundant functions of cyclin E1 and cyclin E2 in development and cancer. Cell Div. 2010;5(1):2.
47. Tigan A, Bellutti F, Kollmann K, Tebb G, Sexl V. CDK6—a review of the past and a glimpse into the future: from cell-cycle control to transcriptional regulation. Oncogene. 2016;35(24):3083.
48. Jiang S-W, Zhou W, Wang J, Little LM, Leaphart L, Jay J, et al. Gene expression patterns associated with human placental trophoblast differentiation. Clin Chim Acta. 2019;495:637–45.
49. Sarkar A, Hochedlinger K. The sox family of transcription factors: versatile regulators of stem and progenitor cell fate. Cell Stem Cell. 2013;12(1):15–30.
50. Zita MM, Soncin F, Natale D, Pizzo D, Parast M. Gene expression profiling reveals a novel regulatory role for Sox21 protein in mouse trophoblast stem cell differentiation. J Biol Chem. 2015;290(50):30152–62.
51. van Dijk M, Mulders J, Poutsma A, Könst AA, Lachmeijer AM, Dekker GA, et al. Maternal segregation of the Dutch preeclampsia locus at 10q22 with a new member of the winged helix gene family. Nat Genet. 2005;37(5):514–9. 52. Kolahi KS, Valent AM, Thornburg KL. Cytotrophoblast, not
syncytiotrophoblast, dominates glycolysis and oxidative phosphorylation in human term placenta. Sci Rep. 2017;7:42941.
53. Xie Y, Zhou S, Jiang Z, Dai J, Puscheck EE, Lee I, et al. Hypoxic stress induces, but cannot sustain trophoblast stem cell differentiation to labyrinthine placenta due to mitochondrial insufficiency. Stem Cell Res. 2014;13(3):478–91.
54. Walker N, Filis P, Soffientini U, Bellingham M, O’Shaughnessy PJ, Fowler PA. Placental transporter localization and expression in the human: the importance of species, sex, and gestational age differences. Biol Reprod. 2017;96(4):733–42.
55. Soares MJ, Konno T, Alam SK. The prolactin family: effectors of pregnancy-dependent adaptations. Trends Endocrinol Metabolism. 2007;18(3):114–21. 56. Gauster M, Blaschitz A, Siwetz M, Huppertz B. Keratins in the human
trophoblast; 2013.
57. Wynne F, Ball M, McLellan AS, Dockery P, Zimmermann W, Moore T. Mouse pregnancy-specific glycoproteins: tissue-specific expression and evidence of association with maternal vasculature. Reproduction. 2006;131(4):721–32. 58. Hayakawa K, Terada K, Takahashi T, Oana H, Washizu M, Tanaka S.
Nucleosomes of polyploid trophoblast giant cells mostly consist of histone variants and form a loose chromatin structure. Sci Rep. 2018;8(1):5811. 59. Silva JF, Serakides R. Intrauterine trophoblast migration: a comparative view
of humans and rodents. Cell Adhes Migr. 2016;10(1–2):88–110. 60. El-Hashash AH, Warburton D, Kimber SJ. Genes and signals regulating
murine trophoblast cell development. Mech Dev. 2010;127(1–2):1–20. 61. Fisher SJ. Why is placentation abnormal in preeclampsia? Am J Obstet
Gynecol. 2015;213(4):S115–S22.
62. da Cunha Castro EC, Popek E. Abnormalities of placenta implantation. Apmis. 2018;126(7):613–20.
63. Kai F, Fawcett JP, Duncan R. Synaptopodin-2 induces assembly of peripheral actin bundles and immature focal adhesions to promote lamellipodia formation and prostate cancer cell migration. Oncotarget. 2015;6(13):11162.
64. Screen M, Dean W, Cross JC, Hemberger M. Cathepsin proteases have distinct roles in trophoblast function and vascular remodelling. Development. 2008;135(19):3311–20.
65. Parast MM, Aeder S, Sutherland AE. Trophoblast giant-cell
differentiation involves changes in cytoskeleton and cell motility. Dev Biol. 2001;230(1):43–60.
66. Prunier C, Prudent R, Kapur R, Sadoul K, Lafanechère L. LIM kinases: cofilin and beyond. Oncotarget. 2017;8(25):41749.
67. Zhou Y, Yuge A, Rajah AM, Unek G, Rinaudo PF, Maltepe E. LIMK1 regulates human trophoblast invasion/differentiation and is down-regulated in preeclampsia. Am J Pathol. 2014;184(12):3321–31.
68. Tögel M, Wiche G, Propst F. Novel features of the light chain of microtubule-associated protein MAP1B: microtubule stabilization, self interaction, actin filament binding, and regulation by the heavy chain. J Cell Biol. 1998;143(3):695–707. 69. Dacheux D, Roger B, Bosc C, Landrein N, Roche E, Chansel L, et al. Human
FAM154A (SAXO1) is a microtubule-stabilizing protein specific to cilia and related structures. J Cell Sci. 2015;128(7):1294–307.
70. Vincze O, Tökési N, Oláh J, Hlavanda E, Zotter Á, Horváth I, et al. Tubulin polymerization promoting proteins (TPPPs): members of a new family with distinct structures and functions. Biochemistry. 2006;45(46):13818–26. 71. Lyle K, Kumar P, Wittmann T. SnapShot: microtubule regulators II. Cell. 2009;
136(3):566 e1.
72. Shukla V, Popli P, Kaushal JB, Gupta K, Dwivedi A. Uterine TPPP3 plays important role in embryo implantation via modulation ofβ-catenin. Biol Reprod. 2018;99(5):982–99.
73. Tonami K, Kurihara Y, Aburatani H, Uchijima Y, Asano T, Kurihara H. Calpain 6 is involved in microtubule stabilization and cytoskeletal organization. Mol Cell Biol. 2007;27(7):2548–61.
74. Yoshie M, Kashima H, Bessho T, Takeichi M, Isaka K, Tamura K. Expression of stathmin, a microtubule regulatory protein, is associated with the migration and differentiation of cultured early trophoblasts. Hum Reprod. 2008;23(12): 2766–74.
75. Douglas GC, King BF. Colchicine inhibits human trophoblast differentiation in vitro. Placenta. 1993;14(2):187–201.
76. Zheng R, Li Y, Sun H, Lu X, Sun B-F, Wang R, et al. Deep RNA sequencing analysis of syncytialization-related genes during BeWo cell fusion. Reproduction (Cambridge, England). 2016.
77. Kudo Y, Boyd C, Kimura H, Cook P, Redman C, Sargent I. Quantifying the syncytialisation of human placental trophoblast BeWo cells grown in vitro. Biochimica et Biophysica Acta (BBA)-Molecular Cell Res 2003;1640(1):25–31. 78. Liu H, He L, Tang L. Alternative splicing regulation and cell lineage
differentiation. Curr Stem Cell Res Therapy. 2012;7(6):400–6. 79. Kelemen O, Convertini P, Zhang Z, Wen Y, Shen M, Falaleeva M, et al.
Function of alternative splicing. Gene. 2013;514(1):1–30.
80. Kuroda T, Yasuda S, Nakashima H, Takada N, Matsuyama S, Kusakawa S, et al. Identification of a gene encoding slow skeletal muscle troponin T as a novel marker for immortalization of retinal pigment epithelial cells. Sci Rep. 2017;7(1):1–12. 81. Wei B, Jin J-P. TNNT1, TNNT2, and TNNT3: isoform genes, regulation, and
structure–function relationships. Gene. 2016;582(1):1–13.
82. Zhang Q, Huang D, Zhang Z, Feng Y, Fu M, Wei M, et al. High expression of TMEM40 contributes to progressive features of tongue squamous cell carcinoma. Oncol Rep. 2019;41(1):154–64.
83. Liu M, Inoue K, Leng T, Zhou A, Guo S, Xiong Z-G. ASIC1 promotes differentiation of neuroblastoma by negatively regulating Notch signaling pathway. Oncotarget. 2017;8(5):8283.
84. Nadeau V, Guillemette S, Bélanger L-F, Jacob O, Roy S, Charron J. Map2k1 and Map2k2 genes contribute to the normal development of syncytiotrophoblasts during placentation. Development. 2009;136(8):1363–74.
85. Chakraborty S, Ain R. NOSTRIN: a novel modulator of trophoblast giant cell differentiation. Stem Cell Res. 2018;31:135–46.
86. de Renty C, DePamphilis ML, Ullah Z. Cytoplasmic localization of p21 protects trophoblast giant cells from DNA damage induced apoptosis. PLoS One. 2014;9(5):e97434.
87. Kuckenberg P, Buhl S, Woynecki T, van Fürden B, Tolkunova E, Seiffe F, et al. The transcription factor TCFAP2C/AP-2γcooperates with CDX2 to maintain trophectoderm formation. Mol Cell Biol. 2010;30(13):3310–20.
88. Zhu G, Fei T, Li Z, Yan X, Chen Y-G. Activin regulates self-renewal and differentiation of trophoblast stem cells by down-regulating the X chromosome gene Bcor. J Biol Chem. 2015;290(36):22019–29.
90. Russ AP, Wattler S, Colledge WH, Aparicio SA, Carlton MB, Pearce JJ, et al. Eomesodermin is required for mouse trophoblast development and mesoderm formation. Nature. 2000;404(6773):95.
91. Luo J, Sladek R, Bader J-A, Matthyssen A, Rossant J, Giguere V. Placental abnormalities in mouse embryos lacking the orphan nuclear receptor ERR-β. Nature. 1997;388(6644):778.
92. Strumpf D, Mao C-A, Yamanaka Y, Ralston A, Chawengsaksophak K, Beck F, et al. Cdx2 is required for correct cell fate specification and differentiation of trophectoderm in the mouse blastocyst. Development. 2005;132(9):2093–102. 93. Zita MM, Soncin F, Natale D, Pizzo D, Parast M. Gene expression profiling
reveals a novel regulatory role for Sox21 in mouse trophoblast stem cell differentiation. J Biol Chem. 2015:jbc. M115. 659094.
Publisher’s Note