Evaluation of no-till sowing performance under various residue
management methods in wheat cropping in south of Fars province,
Iran
M. Roozbeh
1*, A. Khani
2(1. Agricultural Engineering Research Department, Darab Agricultural Rresearch Station. Fars Agricultural and Natural Resources Research and Education Center, Darab, Fars Province, P.O.Box. AREEO, Iran.
2. Soil and Water Department, Darab Agricultural Rresearch Station. Fars Agricultural and Natural Resources Research and Education Center, Darab, Fars Province, P.O.Box. AREEO, Iran.)
Abstract:Heavy crop residue on the soil surface impedes no-till sowing performance and subsequent crop production in conservation tillage systems and therefore limit its adoption by farmers. Therefore, a field study was conducted to determine the effects of various residue management methods on no-till sowing performance. The experimental design was a randomized complete block in five replications. The residue management systems were in four levels of leaving (R.M1), removing (R.M2), shredding (R.M3) and disking (R.M4). No-till sowing performance index was developed based on principal component analysis (PCA) to group and identify the most effective indicators of sowing performance. The results showed that various residue management methods had a significant effect on sowing depth, speed of emergence, effective field capacity, and depth uniformity. The minimum and maximum sowing depth were observed for the R.M1 and R.M4 treatments, respectively. The findings revealed that the speed of emergence and depth uniformity were higher under R.M2 and R.M3 as compared to R.M1 and R.M4 treatments. PCA results indicated that depth uniformity, the speed of emergence and planting depth were the key variables for evaluating no-till sowing performance.
Keywords: direct drilling, sowing performance, residue management, wheat
Citation: Roozbeh, M., and A. Khani. 2020. Evaluation of no-till sowing performance under various residue management methods in wheat cropping in south of Fars province, Iran. Agricultural Engineering International: CIGR Journal, 22(1):92 –99.
1 Introduction
In the last few years, the economic and environmental implications of conventional tillage, such as wind erosion, inverting soil layers, soil moisture loss and greenhouse gas (carbon) emission have led to the examination of no-tillage
Received date: 2019-04-17 Accepted date: 2019-11-08 *Corresponding author: Majid. Roozbeh, Ph.D., Agricultural Engineering Research Department, Darab Agricultural Research Station. Fars Agricultural and Natural Resources Research and Education Center, AREEO, Iran. Tel: +989171343596.Email: [email protected].
crop residue, which hinder the operation of no-till machine. The standing stubbles of height up to 30-40 cm do not affect the sowing performance of seed drills, but rows of long, loose straw left after combine harvesting cause frequent choking between furrow openers and the frame of the no-till drill (Singh and Singh, 1995). Børresen (1999) reported decreased yields where straw was left on the soil surface, especially in a humid climate. Since, planter performance can be evaluated in terms of parameters such as sowing depth, uniformity sowing depth, emergence rate and plant population, Swan et al. (1994) observed that surface residue decreased planting depth and uniformity of the plant spacing and increased the number of seeds placed closer to the surface. Maintaining in a uniform seeding depth is critical to achieve high speed of emergence (Chen et al., 2002; Stocktone et al., 1996). Loeppky et al. (1989) investigated the effect of seeding depth on winter wheat growth and development. They found that increase in seeding depth as small as 17 mm resulted in a significantly delayed plant emergence. Moreover, Siemens et al. (2004) discussed the problems associated with drill performance when seeding into heavy concentrations of residue and the research efforts to overcome these issues.
The major limitation of hoe-type planters is their propensity to plug in heavy residue, causing reductions in field capacity, and large piles of residue to form behind the drill that covers the seed row and suppress seedling growth. Disc-type seeding tends to have poor seed placement because the openers push residue into the seed furrow or ride on the top of the residue and place on the soil surface. Equipment modifications to overcome these problems included increasing the spacing between openers by increasing row spacing or adding toolbars, use of various row cleaning devices and attachments such as coulters to cut through the residue ahead of the furrow openers. Despite these efforts, a consensus indicates that there is a lack of reliable, optimally performing seeding equipment for sowing into residue densities exceeding 2.5 to more than 4.5 t ha-1 (Siemens et al., 2004; Slattery and Riley,
1996; Erbach et al., 1983). Given the limitations of design modifications of a no-till sowing, another approach is to manage the size, condition, and distribution of crop residue in a way that effectively drills performance can be obtained. Rasmussen et al. (1997) reported that 30- to 40- cm tall standing stubble decreased grain yield of winter wheat 13%, compared to crops planted into stubble that had been finely chopped. Siemens and Wilkins (2006) found that stand establishment was over 30% greater in the baled treatment (removing the residue by baling) as compared to the high residue concentration and the disked treatments. No-till handbooks intended for growers often emphasized the importance of residue management for successful drill performance, stand establishment, and crop production in conservation tillage systems (Smith et al., 2000; Green and Poisson, 1999).
However, limited published information is available in Iran about the effectiveness of residue management in heavy crop residue or its impact on no-till sowing performance and crop production. To improve no-till system performance, a better understanding of residue management and its impact on seeding machine performance and subsequent crop production is needed. Thus, the objective of this study was to investigate the effects of different residue management methods on no-till sowing performance in terms of effective field capacity, planting depth, speed of emergence, and depth uniformity. In addition, we used principal component analysis (PCA) to identify the most effective indicators for evaluating no-till sowing performance in Darab of Fars province, one of the main wheat-corn growing areas in the south region of Iran
2 Materials and methods
2.1 Site description and experimental design
about 265 mm, most of which occur during the winter. During the growing season, the minimum and maximum air temperatures were 15.8°C and 29.9°C, respectively. The soil texture was loam (17.95% clay, 41.75% silt, 40.3% sand) down to a depth 40 cm. Soil organic matter was 6.5 g kg-1 at the 0-20 cm depth. Saturated paste extract electrical conductivity (EC) and pH were 0.62 dSm-1 and 7.91, respectively. The experimental design was a randomized complete block with four treatments and five replications. The residue management systems included leaving (R.M1), removing the residue by bailing (R.M2), shredding (R.M3) and disking (R.M4) of corn residues. Plots were 3 m wide by 30 m long to accommodate one pass of the no-till planter. The average initial aboveground residue concentration was 11.4 t ha-1 on the study site.
2.2 Crop management
The field was covered with residues of the previous crop (irrigated corn). A flail shredder was used in the shredded treatment (R.M3) and an offset disk harrow was used in R.M4 treatment. For the baled treatment (R.M2), residue size and concentration were determined by collecting the aboveground dry matter after baling. In the disked treatment (R.M4), because it was difficult to separate surface residue from incorporated residue accurately, residue densities were estimated by assuming that disking would incorporate 55% of the crop residue initially on the soil surface (Shelton et al., 2000). All plots were seeded with winter wheat (Chamran variety) with a 2.80 m wide, 17.5 cm row spacing, no-till planter manufactured by Pierobon, TD, Argentina. The planter equipped with the double-disk opener, ripple coulter, and inclined press wheel. The soil was fertilized with urea and triple superphosphate. 30 kg N ha-1 and 90 kg P2O5 ha-1 were applied at planting and 60 kg and 80 kg N ha-1 of urea were applied in the tillering and stem elongation stages, respectively. During the wheat growing season, weeds were controlled using Axial (1.5 L ha-1) and Bromicide MA (1L ha-1). The Irrigation was carried out at 50% depletion of available water determined gravimetrically in the top 30 cm
of soil.
2.3 Measurements and data analysis
2.3.1 Crop residue condition
To characterize the size and concentration of residue on the soil surface before seeding, a 1 m2 quadrant was used to collect surface residue before seeding trial. The quadrant was randomly placed on the soil surface, and standing and flat or on-ground residues confined. Measurements were made at four random locations in each plot. Residues collected were taken to the laboratory, oven-dried at 60° C for 72 h and weighed to determine the dry matter mass of surface residue per hectare (Chen et al., 2004).
2.3.2 Residue cover
Residue cover was determined after planting using the line-transect method, which measures the proportion of ground cover along a continuous strip (Wysocki, 1989). On each plot, three replications of line transect measurements were completed to estimate residue cover percent after planting.
2.3.3 Effective field capacity and speed of emergence The effective field capacity (EFC), theoretical field capacity (TFC), and field efficiency (e) was calculated by recording the time consumed for actual work and the time lots of other miscellaneous activity such as turning the adjustment under field operating conditions. The theoretical field capacity is calculated as follows:
TFC= W×S/10 (1) and the effective field capacity was calculated using the following equation
EFC=TFC×e (2) Where: W= machine working width (m), S= machine forward speed (km h-1), TFC= theoretical field capacity (ha h-1), e= field efficiency (decimal), and EFC= effective field capacity (ha h-1)
The speed of emergence was calculated by: (Tessier et al., 1991)
(plants m-1 per day), Ni the number of newly emerged seedlings counted per day di and L the length of the row counted (m) in each plot. Plant counts were made in a 2 m long staked row at four random locations on each plot at 2, 4, 6, 8, 10, and 12 days after the first seedling emergence and weekly after that until a stable count was obtained. 2.3.4 Seeding depth
The seeding depth of wheat was determined by measuring the CFL (chlorophyll-free length, from the seed remnants to the onset of the green stem) of the seedlings (Tessier et al., 1991). After the final plant count was completed, five wheat seedlings were uprooted from each row that was used for plant counting, and their CFL were measured. The uniformity of seeding depth was characterized by the seed scatter index (SSI) represented by the standard deviation of measured seeding depths (Tessier et al., 1991).
2.3.5 Crop yield
Grain yield was determined by harvesting 14 rows from each 17 row in the middle of each plot with a plot combine.
2.3.6 Data analysis
Analysis of variance (ANOVA) was performed using the SAS statistical software package (SAS Institute, 1994). Means between treatments were compared with Duncan,s multiple range tests at a 0.05 level of significance. The PCA method was employed as a data reduction tool for evaluating no-till sowing performance index (SAS Institute, 1994). The total variance of each factor was defined as eigenvalue (Swan and Sandilands, 1995). Within each PC with eigenvalues ≥ 1 (Brejda et al., 2000) and those that explained at least 5% of the variation in the data (Wander and Bollero, 1999) were retained. The indexes of no-till sowing performance from each factor were selected based on the correlation coefficients or factor loadings between performance indexes and each factor (Sharma, 1996; Johnson and Wichern, 1992).
3 Results and discussion
Crop residue condition and surface residue cover
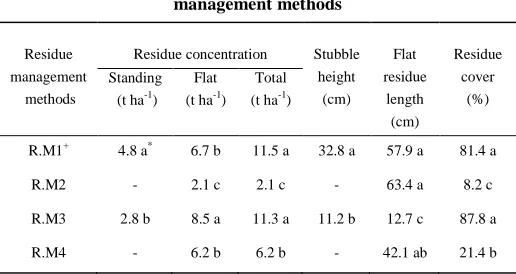
The residue density and sizing results for the different residue management methods are presented in Table 1. The average initial aboveground residue density was 11.4 t ha-1. The maximum concentration of residue was observed in the R.M3 treatment (11.5 t ha-1), while the minimum residue density occurred in R.M2 (2.1 t ha-1). The baling operation removed over 78% of the residue with the remaining 2.20 t ha-1 of residue on-ground.
Table 1 Residue size and density as affected by different residue management methods
Residue management
methods
Residue concentration Stubble height
(cm) Flat residue
length (cm)
Residue cover
(%) Standing
(t ha-1) Flat (t ha-1)
Total (t ha-1)
R.M1+ 4.8 a* 6.7 b 11.5 a 32.8 a 57.9 a 81.4 a
R.M2 - 2.1 c 2.1 c - 63.4 a 8.2 c
R.M3 2.8 b 8.5 a 11.3 a 11.2 b 12.7 c 87.8 a
R.M4 - 6.2 b 6.2 b - 42.1 ab 21.4 b
Note: R.M1: leaving, R.M2: removing, R.M3: chopping, R.M4: disking of corn residues; *Values with the same lower case letter in each column are not significantly different (P<0.05 ).
It is below the reported 2.5 to 4.5 t ha-1 limit for unimpeded no-till sowing performance (Siemens et al., 2004; Slattery and Riley, 1996). The results revealed that the flat or on-ground residue concentration in the R.M1 and R.M3 treatment averaged 6.5 and 8.7 t ha-1, respectively (Table 1). Relative to R.M1, R.M3 treatment was more effective in the reduction of the residue length (71.2%), indicating that the shredding mechanism was effective in reducing length (Table 1). Nearly 88% of the 8.7 t ha-1 of flat or on-ground residue was less than 13 cm in length and fairly evenly spread (Table 1). The percent average residue cover was lowest for R.M2 treatment, and no significant difference was found between R.M3 and R.M1 treatments with highest residue cover. The disking operation (R.M4) left no standing stubble and incorporated some of the aboveground residue (Table 1).
3.2 Effective field capacity (EFC)
on the no-till planter forward speed and effective field capacity (Table 2).
Table 2 Analysis of variance for forwarding speed, effective field capacity, sowing depth, seed scatter index, speed of emergence
and crop yield as affected by different residue management methods
Note: R.M: Residue management methods, FS: Forward speed, EFC: Effective field capacity, SD: Sowing depth, SSI: Seed scatter index, SE: Speed of emergence, Y: Yield, ** and *: Significant at p˂0.01 and p˂0.05, ns: non-significant
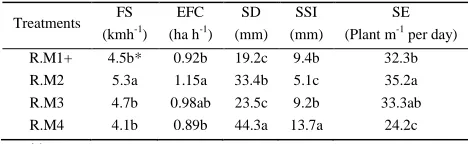
The R.M1 and R.M3 treatments relative to R.M2 treatment led to a significant forward speed reduction by 21.8% and 14.5% during the seeding operation, respectively (Table 3). The decrease in forwarding speed may be attributed to the heavy concentrations of residue (flat and standing) on the soil surface in R.M1 and R.M3 treatments (Table 1), although, shorter straw flowed more easily around the opener in R.M3 and plugging problems were not encountered. The results also indicated that the maximum E.F.C occurred in the R.M2 treatment (1.15 ha h
-1
), and seeding operation in the leaving, shredding and disking of corn residue treatments (R.M1, R.M3, R.M4) reduced EFC by 20%, 14.8%, and 22.6% compared to R.M2, respectively.
Table 3 Means of sowing performance indexes as affected by different crop residue methods
Note: R.M1: leaving, R.M2: removing, R.M3: chopping, R.M4: disking of corn
residues
FS: Forward speed, EFC: Effective field capacity, SD: Sowing depth, SSI: Seed scatter index, SE: Speed of emergence.
*Values with the same lower case letter in each column are not significantly different (P<0.05 ).
Previous studies indicated that seeding into heavy residue could affect forward speed and consequently effective field capacity (Siemens et al., 2004; Wilkins et al., 1992). However, the time per hectare required was increased from 0.66 h to 1.09, 1.02, and 1.12 h in no-till sowing on R.M1, R.M3, and R.M4 corn residue treatments as compared T2, which was coincided with the result reported by others (Bueno et al., 2007).
3.3 Sowing and crop performance
3.3.1 Seeding depth
In both years, comparison of average seeding depth for residue management systems indicated that the seeds were placed the shallowest in the R.M1 treatment and the deepest in the R.M4 treatment (Figure 1). The R.M1 and R.M3 treatments relative to R.M2 treatment led to a significant seeding depth reduction by 42.5% and 29.6%, respectively (Table 3).
The seedbed of the R.M4 plots was more pulverized by closely spaced disks (Smith et al., 2002), while the R.M1 and R.M3 plots had a firm seedbed. The loose soil with lower surface residue allows the furrow opener to work at a more depth (Table 1, 3). The finding also revealed that R.M4 promoted the greatest SSI from the mean seeding depth, while R.M2 promoted the lowest SSI (Table 3). The seed scatter obtained in R.M1 was similar to the SSI obtained with R.M3 treatment. The soil loosening status in the R.M4 and high concentration of on-ground residue in the R.M1 and R.M3 might have played a major role in this perspective (Table 1, 3).
Figure 1 Seeding depth as affected by different residue management methods
c
b
b
a
c
b
c
a
0 10 20 30 40 50
R.M1 R.M2 R.M3 R.M4
Se
edi
ng
de
pt
h
(m
m
)
Residue management methods
2014 2015
Source Mean squares
FS EFC SD SSI SE Y Year 1.64 0.1ns 822.64* 23.56ns 388.56ns 13510458.8
Error 0.93 0.009 42.158 337.23 2.516 211197.7
R.M 3.87* 0.135* 578.99** 647.33** 87.50* 956379.5*
Year Error 0.893 0.035 55.07 135.9 11.39 102090.8
CV (%) 15.3 18.2 16.7 14.7 10.72 15.6
Treatments FS (kmh-1)
EFC (ha h-1)
SD (mm)
SSI (mm)
SE (Plant m-1 per day) R.M1+ 4.5b* 0.92b 19.2c 9.4b 32.3b
3.3.2. Speed of emergence
Analysis of data on emergence speed indicated that residue management methods had significant effects on this factor (Table 2). The R.M2 showed the fast emergence of wheat seed (35.2 Plant m-1 d-1), followed by the R.M3 treatment, while R.M4 treatment had the slowest emergence speed (24.2 Plant m-1 d-1) (Table 3). The decrease in emergence speed can be probably attributed to the higher SSI in the R.M4 treatment (Table 3). Moreover, the presence of incorporated residue in the seedbed layer of R.M4 might have promoted a poorer soil-seed contact (Chen et al., 2004; Janell et al., 1993). Relative to R.M1, R.M3 treatment was more effective in increasing emergence speed, although there was no significant difference between them in this study. The proper effect of shredding may because stubble prevented favorable seed placement and emergence. This result is in agreement with the findings by Bueno et al. (2007).
3.3.3 Crop yield
Different residue management methods had a significant effect on grain wheat yield (Table 2). Removing residue treatment (R.M2) provided the highest SE, lowest SSI and the highest yield of all the treatments (Figure 2). Crop yield was over 9% greater in the R.M2 treatment as compared to the high residue concentration within R.M1 treatment. A favorable effect of shredding on no-till sowing performance and subsequent wheat yield was observed as compared with non-shredded treatment. On average, an 8.5% increase was found for wheat yield in R.M3 as compared to the R.M1 treatment (Figure 2).
Figure 2 Wheat yield as affected by different residue management methods
The increase in crop yield can be probably attributed to the reduction of Physical effects of residue on seed scatter, emergence speed and stand establishment. The yield in the disked treatment (R.M4) was the lowest yield as compared to other treatments and significantly lower than the R.M2 and R.M3 treatments (Figure 2). Lower yield in the R.M4 was presumably due to high soil loosening and subsequent high seed depth and reduction of stand establishment.
3.4 Principal component analysis (PCA)
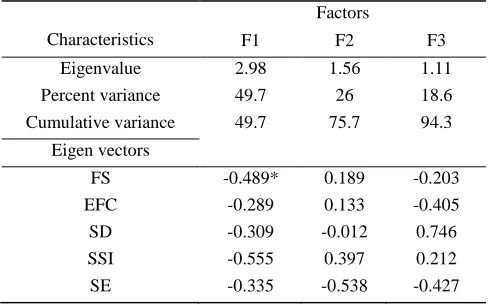
PCA was performed using the five sowing performance indexes. Each of the first three factors had eigenvalues >1 and were retained for interpretation (Table 4).
Table 4 Factor analysis results for sowing performance indexes
Characteristics
Factors
F1 F2 F3
Eigenvalue 2.98 1.56 1.11 Percent variance 49.7 26 18.6 Cumulative variance 49.7 75.7 94.3
Eigen vectors
FS -0.489* 0.189 -0.203
EFC -0.289 0.133 -0.405
SD -0.309 -0.012 0.746
SSI -0.555 0.397 0.212
SE -0.335 -0.538 -0.427 Note: *Factor loadings, FS: Forward speed, EFC: Effective field capacity, SD:
Sowing depth, SSI: Seed scatter index, SE: Speed of emergence, Similarly, SD was selected as representative from factor 3 with the highest weight. Thus, the most effective indicators selected were SSI, SE and SD (Table 4).
The first-three principal components explained cumulative sample variance of 94.3%. The first and the most important factor, which explained 49.7% of the variation, had high loading for variable of S.S.I (-0.555). Factor 2 had high loading from S.E and collectively explained 26% of the sample variance.
4 conclusions
The results of this experiment on a loam soil in Iran show that various residue management methods can have a significant effect on no-till sowing performance indexes. Particularly, the chopped straw residue on or near the soil surface (R.M3) enhanced effective field capacity, speed of
b a a b
0 1000 2000 3000 4000 5000 6000 7000
R.M1 R.M2 R.M3 R.M4
Y
ie
ld
(
kg
h
a
-1)
emergence and grain yield compared to leaving and disking the residue treatments. The reducing residue concentration to less than 2.5 t ha-1 by baling residue (R.M2), resulted in significant increases in speed of emergence and grain yield as compared to treatment where the residue was left on the soil surface (R.M1). The PCA identified three sowing performance indexes (SSI, SE and SD) as the most effective indicators a loam soil in Iran.
Reference
Børresen, T. 1999. The effect of straw management and reduced tillage on soil properties and crop yields of spring-sown cereals on two loam soils in Norway. Soil & Tillage Research, 51(1-2): 91-102.
Brejda, J.J., T.B. Moorman, D.L. Karten, and T.H. Dao. 2000. Identification of regional soil quality factors and indicators. I. Central and Southern High Plains. Soil Science Society of America Journal, 64 (6): 2115-2124.
Bueno, J., C. Amiama, and J.L. Hernanz. 2007. No-tillage drilling of Italian rye-grass (Lolium multiflorum L.): crop residue effects, yields and economic benefits. Soil & Tillage Research, 95 (1-2): 61-68.
Carter, M.R. 1994. A review of conservation tillage strategies for humid temperate regions. Soil & Tillage Research, 31 (4): 289-301.
Chen, Y., S. Tessier, and B. Irvine, 2004. Drill and crop performances as affected by different drill configurations for no-till seeding. Soil & Tillage Research, 77 (2): 147-155.
Chen, Y., D. Lobb, C. Cavers, S. Tessier, D. Caron, and F. Monero. 2002. Straw incorporation through tillage practices under heavy clay soil conditions., Final report submitted to Covering New Ground Program. Manitoba, Canada.
Erbach, D.C., J.E. Morrison, and D.E. Wilkins. 1983. Equipment modification and innovation for conservation tillage. Journal of Soil and Water Conservation, 38(3): 182-185.
Green, M., and D. Poisson. 1999. Residue management for successful direct seeding. Agdex 570-4. Edmonton, AB, Canada: Alberta Agriculture, Food and Rural Development, 8 July .
Janelle, L., S. Tessier, and C. Lague. 1993. Seeding tool design for no-tillage conditions in north-east. ASAE paper No. 93-1561. Johnson, R.A., and D.W. Wiehern. 1992. In Applied Statistical
Multivariate Analysis, 3rd ed. Englewood Cliffs. Texas, NJ: Prentice Hall Inc.
Loeppky, H., G.P. Lafond, and D.B. Fowler. 1989. Seeding depth in
relation to plant development, winter survival, and yield of no-till winter wheat. Agronomy Journal, 81(2) 125-129.
Rasmussen, P.E., R.W. Rickman, and B.L. Klepper. 1997. Residue and fertility effects on yield on no-till wheat. Agronomy Journal, 89 (4): 563-567.
SAS Institute. 1994. SAS User’ s Guide. Cary, NC.: SAS Institute. Sharma, S. 1996. Applied Multivariate Techniques. NY. John Wiley
and Sons. New York Chichester Brisbane, Toronto Singapore. Shelton, D., J. Smith, and P. Jasa. 2000. Estimating residue cover. In
Conservation Tillage Systems and Management, 2ed, ch. 5. 35-46. Ames, IA: Midwest Plan Service, Iowa State University. Siemens, M.C., and D.E. Wilkins. 2006. Effect of residue
management methods on no-till drill performance. Applied Engineering Agriculture, 25 (1): 51-60.
Siemens, M.C., D.E. Wilkins, and R.F. Correa. 2004. Development and evaluation of residue management wheel for hoe type no-till drill. Transaction of the ASAE, 47(2): 397-404.
Singh, B., and T. P. Singh. 1995. Development and performance evaluation of zero-till fertilizer cum seed drill. Journal of Agricultural Engineering, 32 (1-4): 13-23.
Slattery, M.G. 1998. A study of the balance of tine pattern factors for operating in wheat stubble. SEAg Paper No. 98/044. Barton, Australian Capital Territory: SAEAg.
Slattery, M.G., and T. Riley. 1996. The influence of tine parameters on stubble handling ability. SEAg Paper No. 96/017. Barton, Australian Capital Territory: SEAg.
Smith, J.A., R.G. Wilson, G.D. Binford, and C.D. Yonts. 2002. Tillage systems for improved emergence and yield of sugar beets. Applied Engineering in Agriculture, 18(6): 667- 672. Smith, J., V. Hofman, and R. Taylor. 2000. Residue management oat
harvest. In Conservation Tillage Systems and Management, 2ed, ch. 4. 29-34. Ames, IA : Midwest Plan Service, Iowa State University.
Stockton, R.D., E.G. Krenzer Jr, J. Solie, and M.E. Payton. 1996. Stand establishment of winter wheat in Oklahoma: a survey. Journal of Production Agriculture, 9 (4): 571–575.
Swan, A. R. H., and M. Sandilands. 1995. Introduction to Geological Data Analysis, Oxford ; Cambridge, Mass., USA : Blackwell Science London, Wiley-Blackwell; 1 ed, 1-464.
Swan, J.B., R.L. Higgs, T. B. Bailey, N. C. Wollenhaupt, W. H. Paulson, and A.E. Peterson. 1994. Surface residue in row treatment effects on long-term no tillage and continuous corn. Agronomy Journal, 86 (4): 711-718.
Wander, M.M., and G.A. Bollero. 1999. Soil quality assessment of tillage impacts in Illinois. Soil Science Society of America Journal, 63 (4): 961-971.
Wilkins, D.E., P.E. Rasmussen, S.L. Albert, and W.L. Payne. 1998. Sustainable tillage and cropping systems for the Columbia Plateau. In Proc. Workshop on Sustainable Tillage System, 75-83. Aburn, AL, 8-10 July.
Wilkins, D.E., F.E. Bolton, and K.A. Saxton. 1992. Evaluating seeders for conservation tillage production of peas. Applied Engineering in Agriculture, 8(2): 165-170
Wysocki., D. 1989. Measuring residue cover. In Pacific Northwest Conservation Tillage Handbook. Residue Management No. 9. Cooperative Extension, eds. R. Veseth, and D. Wysocki, ch. 3, 1-2. Pullman, WA: Washington State University.
Zentner, R.P., G.P. Lafound, D.A. Derksen, and C.A. Campbell. 2002. Tillage method and crop diversification effect on economic returns and riskiness of cropping systems in a Thin Black Chernozem of the Canadian Prairies. Soil & Tillage Research, 67 (1): 9-21.