T
TW
WO
O-
-P
PH
H
AS
A
SE
E
SA
S
AM
MP
PL
LI
IN
NG
G
F
FO
OR
R
ST
S
TR
RA
AT
TI
IF
FI
IC
CA
AT
TI
IO
O
N:
N
:
A
A
PP
P
PL
LI
IC
CA
AT
TI
IO
ON
N
T
TO
O
S
SO
OF
FT
TW
WA
AR
RE
E
I
IN
ND
DU
US
ST
TR
RY
Y
D. A. Agunbiade, S. O. Folorunso, K.-K. A. Abdullah, P. I. Ogunyinka
Department of Mathematical Sciences, Olabisi Onabanjo University, Ago-Iwoye, Nigeria
Corresponding Author: P. I. Ogunyinka, [email protected]
ABSTRACT: Many authors have applied Two-Phase Sampling for Stratification (TFSS) to different areas of specialization. It was observed that such application is yet to be extended to the software industry. This research applied TFSS to the comparison of the two software types, Free and Open Source Software (FOSS) and Proprietary Software (PS). The estimated FOSS mean (4.5749) compared to PS mean (3.6390) revealed that FOSS is more rated than PS. The minimum estimated variance in FOSS (0.0046) over PS (0.0484) showed that FOSS is efficient than PS. The relative efficiency further confirmed that FOSS is 1052.17% efficient over PS. FOSS user rating has higher precision with Coefficient of Variation (CV) of 0.0148 as against PS user rating CV of 0.0605. It was, finally, concluded that FOSS is efficiently rated than PS by the software users.
KEYWORDS: Two-phase Sampling for Stratification, User rating, Free-and-Open-Source Software, Proprietary Software.
1.
INTRODUCTIONGenerally, two-phase sampling procedure is used when it is necessary to make use of auxiliary information to improve the precision of an estimate. The first phase sample is used to estimate the population parameter of the auxiliary variable while the second phase sample is used to obtain the required information on the variable of the interest and the auxiliary variable. Two-phase sampling is a powerful and cost effective technique. Neyman ([Ney38]) was first to coin two-phase sampling. Hidiroglou ([Hid01]) unified the estimation procedures for nested and non-nested two-phase sampling methods using an optimal regression approach. Rao ([Rao73]) studied two-phase sampling in relation to stratification and analytical surveys. In two-phase sampling for stratification (TPSS), information for stratification is obtained at the first phase, this information is then used to select stratified sample from first phase sample. The second phase random sample is selected from each stratum. Cochran ([Coc77]) presented the basic results of two phase sampling including the regression estimators. TPSS has been applied by many authors to estimate the parameters of some concerned population parameters. Chojnacky ([Cho98]) has estimated
forest inventory required parameters with TPSS. Similarly, Shaw et al. ([SBO08]) used TPSS to estimate forest soil carbon and Nitrogen stocks for monitoring long-term site productivity and carbon stock changes. In this research, efforts is made to use TPSS to estimate the population total of software rating and compare the efficiency of Free and Open Source Software (FOSS) and Proprietary Software (PS) based on software rating.
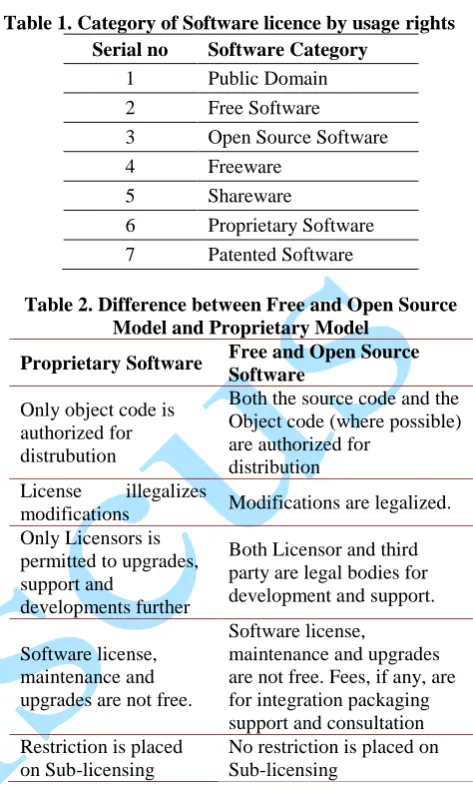
Computer software is the collection of instructions that make the user to interact with the computer hardware. Computer software may be classified in accordance to the usage right licence. Tristan Muller ([Mul11]) used software licences to classify software into seven categories as presented in table 1.
Public domain software (category 1) are software which rights have expired, however, they are not classified as Free nor Open Source Software. Wikipedia ([***16a, ***16b]) respectively established that criticism has been extended to Freeware (Category 4) and Patented software (category 7) by the Free Software Foundation Community. This research recognises Free Software (category 2) and Open Source Software (category 3) as Free-and-Open-Source Software (FOSS) while Shareware (category 5) and Proprietary Software (category 6) as Proprietary software (PS). Wolfgang (2009) presented the difference between the open source software and proprietary software as presented in table 2 below.
2. GENERAL INFORMATION
2.1 Two-Phase Sampling for Stratification
Stratification is a way of utilising the auxiliary information to improve the precision of an estimator. The information on the auxiliary variable needed for stratification may not be available. The technique of two-phase sampling is then used to collect the information of an auxiliary variable for stratification at first phase sampling and stratum weights are estimated. This research uses the term Two-phase sampling for stratification as against the term Double Sampling for Stratification as used by many authors in the field. It is worth mentioning that these two terms have the same meaning. In Two-Phase Sampling for Stratification (TPSS), an initial large sample size is selected from the population of units by simple random sampling without replacement (SRSWOR). Stratification of selected units is then carried out on the basis of the information on collected at the first phase. The number of sample units , falling in stratum is noted as:
(1)
for number of strata. It is assumed that is so large. Let
(2)
be the sample stratum weight which is the proportion of the initial sample units falling in the stratum . is an unbiased estimator of (population stratum weight). Secondly, a simple random subsample of size for is drawn in each stratum from first phase sample units falling in stratum . is proportion of terrestrial sample points per stratum and it is fixed in advance. The character of interest whose population mean is to be estimated is observed on all the units selected at the second phase. The unbiased estimator of is
(3)
for
(4)
Rao (1973) established the variance of as
(5)
For is the population variance. Similarly, this
variance can be expressed as
(6)
The unbiased estimator of is established by Rao (1973) as:
′( 1) ′ =1 ′ =1 2 2 (7)
Similarly, the TPSS estimator of the population total is provided by Sharon Lohr ([Loh10]) as:
(8)
The corresponding variance is also computed conditionally as:
′ 2 (9)
2.2 Optimum Allocation of and
Cochran ([Coc77]) established that TPSS with optimum allocation has higher gain over proportional allocation and other allocation methods. This research uses optimum allocation in TPSS. Optimum allocation is used to determine the values of and that minimize the variance of the estimator for a given cost of survey.
Given the cost function:
(10)
for:
Cost of classification per unit at first phase Cost of obtaining information from a unit in stratum ; and
Total survey cost.
Okafor ([Oka02]) presented the optimum values of and that minimize as
(11)
=1 2 2 (12)
while the optimum variance is presented as
=1 2122 2 (13)
(14)
Okafor ([Oka02]) clarifies that the values of these parameter and invlove unknown population parameters , and . Values of these parameters can be estimated from a pilot or past survey. Everitt ([Eve06]) defined “Pilot Survey” as a small scale investigation carried out before the main survey proper.
2.3 Coefficient of Variation (C.V.)
The statistical precision or accuracy of an estimator could be measured with the Coefficient of Variation
Sharon Lohr ([Loh10]) identifies the
Coefficient of Variation of an estimator as the measure of relative variability. It is mathematically presented as
(15)
Where Sample mean
Standard Error of the estimator
The estimated could as well be explained when expressed in percentage.
(16)
In this research, equation (16) will be utilized to compute the coefficient of variation of FOSS and PS. Subsequently, these will be compared.
2.4 Percentage Relative Efficiency (RE)
This is another statistical tool that can be used to measure the efficiency of one estimator over another. If estimator is confirmed to have minimum variance or mean square error (MSE) over another estimator . Then the percentage relative efficiency of estimator over estimator
is expressed as:
(17)
Similarly, the percentage relative efficiency of FOSS to PS measures the efficiency of FOSS to PS, if the variation within FOSS is minimal over the variation of PS. Then the percentage relative efficiency is expressed as:
(18)
However, if the internal variation of PS is minimal over the internal variation of FOSS, then the percentage relative efficiency of PS over FOSS is expressed as:
(19)
2.5 Data Collection and Analysis
This research obtains the sample mean and its estimated variance using TPSS for FOSS and PS. In each case, auxiliary and study variables will be required. This research visits the FOSS online repository, www.sourceforge.net, and the PS repository, www.download.com (redirected to www.download.cnet.com). For every software on these two online repositories, there is a number of download and average user ratings (between 1 star and 5 stars inclusively). Though, sourceforge.net provides an additional yardstick of software rating as software ease, features, design and support but software star rating is used in this research because it is the only rating tools common to both repositories. This research assumes that software user rating will be internally homogenous (similar) within each software category. This research takes the average users rating as the study variable and the category of the software as the auxiliary variable for stratifying the software at the first phase.
Primary data were collected on the two software
repositories, sourceforge.net and
www.download.com. An optimum sample size of software using simple random sampling without replacement to select member of the first phase sample
2.6. Estimation of Parameters for FOSS and PS
A pilot survey was conducted for the estimation of the population stratum variance and the population stratum weight . These estimates for both FOSS and PS are shown in table 3. The population Variance for FOSS is estimated as and the population variance for the PS is estimated as
.
This research collected data from the online repositories of FOSS and PS with attached cost of data collection. The total cost of the survey is considered as . It costs
to collect data about each
software at the first phase sampling and costs
for to collect data
about each software at the second phase software sampling from each stratum. These costs are applicable to the sampling conducted for both FOSS and PS. Sampling in FOSS has the optimum first phase sample size when the population size is . Similarly, this research collected primary data on the online repository for PS on www.download.com. Sampling in PS experienced the optimum first phase sample size when the population size is .
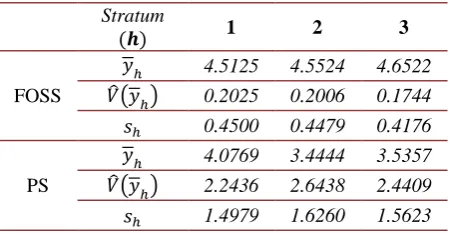
The first phase sampling optimum stratum size , second phase sampling optimum stratum size , the stratum weights and the optimum proportion of the terrestrial sample points per stratum for both FOSS and PS are shown in table 4. The estimated stratum mean, variance and standard deviation are presented in table 5. The sample variance of the study variable for FOSS is obtained as and for PS is obtained as . Table 6 displays the estimated population mean and total for two-phase sampling for stratification for the FOSS and PS ratings. Finally, the optimum variances of the estimated mean and total for FOSS and PS are compared in table 7. It is observed that the minimum variance of the is attained in FOSS.
2.7. Computation of Relative Efficiency
The relative efficiency of FOSS to PS is computed as:
(20)
(21)
FOSS is approximately 1052% efficiently rated than PS.
3. TABLES ACHIEVEMENT
Table 1. Category of Software licence by usage rights Serial no Software Category
1 Public Domain 2 Free Software
3 Open Source Software 4 Freeware
5 Shareware
6 Proprietary Software 7 Patented Software
Table 2. Difference between Free and Open Source Model and Proprietary Model
Proprietary Software Free and Open Source Software
Only object code is authorized for distrubution
Both the source code and the Object code (where possible) are authorized for
distribution License illegalizes
modifications Modifications are legalized. Only Licensors is
permitted to upgrades, support and
developments further
Both Licensor and third party are legal bodies for development and support.
Software license, maintenance and upgrades are not free.
Software license,
maintenance and upgrades are not free. Fees, if any, are for integration packaging support and consultation Restriction is placed
on Sub-licensing
No restriction is placed on Sub-licensing
Table 3. Estimated stratum variance and Weight obtained from the Pilot Survey on FOSS and PS
Stratum
1 2 3
FOSS
0.1733 0.1165 0.2029
0.2394 0.2911 0.1879
PS
1.5489 1.1765 0.9813
0.3855 0.2849 0.3296
Table 4. Estimates of correponding stratum sizes and weight for FOSS and PS
Stratum
1 2 3 Total
FOSS
78 123 99 300
16 21 23 60
0.2106 0.1727 0.2279
0.26 0.41 0.33
PS
57 90 73 220
13 18 14 45
0.2338 0.2038 0.1861
Table 5. Estimates for the stratum mean and variance for FOSS and PS
Stratum
1 2 3
FOSS
4.5125 4.5524 4.6522 0.2025 0.2006 0.1744 0.4500 0.4479 0.4176
PS
4.0769 3.4444 3.5357 2.2436 2.6438 2.4409 1.4979 1.6260 1.5623
Table 6. Estimates for the population mean, corresponding variance and total for FOSS and PS
FOSS 4.5749 0.0046 117462
PS 3.6390 0.0484 201099
Table 7. Computation of the coefficient of variation
Interpretation
FOSS 4.5749 0.0678 0.0148 High Precision PS 3.6390 0.2200 0.0605 Low Precision
4. CONCLUSIONS
This research aims at exposing samplers to the implementation of TPSS in the estimation of parameters in the software industry. Optimum allocation in TPSS was used in obtaining the optimum sample size at the first phase and all strata at the second phase. Two-phase sampling for stratification was applied on the average users rating on each sampled software collected from the FOSS and PS. Hence, estimating the mean of the average user rating, the total user rating and the corresponding variances for the two types of software. Table 7 shows that FOSS has estimated mean of 4.5749 while PS has an estimated mean of 3.6390. Hence, FOSS is averagely rated higher than PS. Comparing the estimated variances of the two-phase sampling for stratification, it is established that FOSS has optimum variance of 0.0046 when compared to PS with optimum variance of 0.0484, hence, FOSS is efficient over PS based on the users rating. The coefficient of variation shows that FOSS (0.0148) has higher precision (quality) of users rating over PS (0.0605). Finally, equation 21 shows that FOSS users’ rating is 1052.17% efficient over PS rating. This research has applied TPSS to compare FOSS and PS. FOSS is highly rated, efficient and has high rating quality over PS. Two-phase Sampling for stratification is a statistical method used for sampling with estimation of parameter(s). This research has demonstrated to samplers how TPSS can be used to estimate parameters in software industry and how to identify the most efficient software.
5. REFERENCES
[Cho98] D. C. Chojnacky - Double Sampling for Stratification: A forest inventory Application in the interior west, USDA Forest Service Res. Pap. RMRS-RP-7, 1998.
[Coc77] W.G. Cochran - Sampling Technique. 3rd Edition, John Willey and sons Inc., New York, 1977.
[Eve06] B. S. Everitt - The Cambridge dictionary of Statistics, 3rd Edition, Cambridge University Press, New York, 2006.
[Gok03] A. Gok - Open Source versus Proprietary Software: An Economic Perspective
http://open.bilgi.edu.tr/freedays_2004/pa pers/Abdullah_Gok.pdf (2003).
[Hid01] M. A. Hidiroglou - Double Sampling. Survey Methodology 27, Pp. 143-154, 2001. [Lei09] W. Leister - Free and Open source software (FOSS) Part II. Norsk Regnesentral. Retrieved from
www.nr.no, 2009.
[Loh10] S. L. Lohr - Sampling Design and Analysis. Second Edition. Brooks/Cole Cengage Learning, 2010.
[Mul11] T. Muller - How to choose an free and open source Integrated Library System. International digital Library perspective. 27, 57-78, 2011.
[Ney38] J. Neyman - Contribution to the theory of Sampling Human Populations, Journal of the American Statistical Association. 33, 101-116, 1938.
[Oka02] F. C. Okafor - Sample Survey theory with Applications. Afro-Orbis publication Ltd., 2002.
[Rao73] J. N. K. Rao - On Double Sampling for Stratification and Analytical Surveys, Biometrika. 60, 125-133, 1973.
[SBO08] C. H. Shaw, J. R. Boyle, A. Y. Omule - Estimating Forest Soil Carbon and Nitrogen Stocks with Double sampling for Stratification. SSSAJ 72, 2008.
[***16a] Wikipedia - Freeware.Retrieved from http://en.wikipedia.org/wiki/Freeware, 2016.
[***16b] Wikipedia - Software Patents and Free Software,