Issues
ISSN: 2146-4138
available at http: www.econjournals.com
International Journal of Economics and Financial Issues, 2016, 6(2), 682-687.
Evaluation of the Quality of Governance in African Countries
using Aggregate Indicators
Zuzana Novotná
1, Petra Šánová
2*, Adriana Laputková
31Department of Statistics, Faculty of Economics and Management, Czech University of Life Sciences Prague, Kamýcká 129,
Prague 6 - Suchdol, Czerch Republic, 2Department of Trade and Finance, Faculty of Economics and Management, Czech University
of Life Sciences Prague, Kamýcká 129, Prague 6 - Suchdol, Czerch Republic, 3Department of Languages, Faculty of Economics and
Management, Czech University of Life Sciences Prague, Kamýcká 129, Prague 6 - Suchdol, Czerch Republic. *Email: [email protected]
ABSTRACT
The paper focuses on evaluation of the quality of governance in 53 African countries. The quality of governance is evaluated using factors such as government effectiveness, control of corruption, rule of law, which are monitored in each African country individually for the period between 2004 and 2010. In order to assess the quality of governance as well as the relative position of each African country, the ratio aggregation method was used in its simple form. The results of the analysis show substantial disparities among African countries. Somalia, Zimbabwe and Equatorial Guinea reach the worst results, with considerably high levels of corruption. The results of the analysis of each country are presented using a coloured map of Africa.
Keywords: Quality of Governance, Government Effectiveness, Control of Corruption, Rule of Law, Africa, Aggregate Indicator, Ratio Method
JEL Classifications: H75, K00
1. INTRODUCTION
Africa is a continent with specific problems differentiating this part
of the world from other regions. Low economic performance ranks most of African countries among the poorest. On the other hand, African resources and unexploited opportunities offer a potential
for a considerable economic development (Tomsík et al., 2015).
The quality of a country’s governance is known to be affecting the
operation of financial and capital markets through its influences on the availability of external financing, cost of funding, market valuations, and quality of investments (Chen et al., 2009; Hooper et al., 2009; Chiou et al., 2010). Good governance is the form of
institutions that establish a predictable, impartial, and consistently enforced set of rules for investors. It is crucial for the sustained and rapid growth in per capita incomes of poor countries (Knack
and Keefer, 1997). Moreover, the impact of good governance
appears to be progressive, with the worst neutral effects on the distribution of incomes within countries, and some evidence of
egalitarian effects on income distributions (Knack, 1999). La Porta
et al. (2002) have highlighted the important roles of laws and legal enforcement in affecting the governance of firms, corporate
valuations, development of markets, and economic growth.
Various studies suggest that the quality of governance is linked to
the national well-being of citizens (Holmberg et al., 2009). Kopriva et al. (2015) says, that government and political representatives
who have a key influence on decision-making are the most important from the viewpoint of endogenous factors in terms of local or regional development. The quality of governance does
not refer to the physical size of financial resources of government
but instead refers to the quality of public policy-making and delivery and the extent to which decision-making and policy implementation is conducted in a transparent, efficient and
impartial way (Rothstein and Teorell, 2008). Many comparative
studies of governance have found that the welfare of citizens is generally better in countries where the quality of governance scores
are higher (Holmberg et al., 2009). The quality of governance is
reported to be linked to income equality and poverty levels (Chong
environmental degradation (Morse, 2006), happiness (Frey and Stutzer, 2000) and economic performance (Mo, 2001).
The notion of global governance has always been intimately
linked to that of crisis (Broome et al., 2012). Much of Africa has
experienced political instability and war. More than half of the
countries in sub-Saharan Africa have had significant political
instability since independence, including civil war and violent
coups (Collier and Gunning, 1995). In the past few years, almost a
quarter of the countries in the region have been involved in regional or civil wars or are experiencing substantial internal strife. Deep political and economic development failures - not tribalism or ethnic hatred - are the root causes of Africa’s problems (Elbadawi
and Sambanis, 2009). Poor leadership is a continual problem (Gray and McPherson, 2001). Political instability disrupts domestic
revenue generation both because investment, production, and trade generally drop during the period of instability and because
tax collection becomes much more difficult.
Governance has been added to the many conditionalities imposed as a requirement for funding from the International Monetary
Fund, World Bank, and bilateral donors (Kaufmann et al., 2010).
Corruption in government procurement programs is a perennial
problem (Sikka and Lehman, 2015). Corruption receives the
lion’s share of the press, but related problems include inadequate
official information, weak mechanisms of accountability, poorly
enforced rule of law, and bureaucracies that are ineffective and
unresponsive (Bräutigam and Knack, 2004). Poor governance has
multiple causes, and once governance begins to decline, a vicious cycle of inadequate revenues, low morale, and poor performance
is all too easily created (Bräutigam and Knack, 2004). First, state
capacity and institutions of governance in many African countries have never been particularly strong. The newly independent nations of Africa were not well prepared for self-government, and many faced ethnic tensions that had been exacerbated by colonial rule. Local skill bases were weak. Only six universities
had been established in all of sub-Saharan Africa, and in 1960
postsecondary enrolment levels were about one-sixtieth of those in
Asia and Latin America (Mutahaba et al., 1993). African political
economies have been beset by a different order of problems to those in other regions, manifest more clearly in political crisis of
stability (Harrison, 2004).
High levels of aid have the potential to improve governance, but they can also work against governance improvements. On the positive side, high levels of aid channelled to governments with clear development agendas can be used to improve the quality of the civil service, strengthen policy and planning capacity, and establish strong central institutions. In the East Asian region, South Korea and Taiwan are good examples of this, while Botswana shows that the same processes can also work in
sub-Saharan Africa (Carlsson et al., 1997). Aid can release the
binding constraint of low revenues for governments committed
to development (Devarajan et al., 2001). Some researchers have found that high levels of aid (at around 40-45% of GDP) promote
growth when given to countries with good macroeconomic policies
(Durbarry et al., 1998). Stead (2014) also evaluated the quality of
governance in various parts of the world, however, always during
one monitored period. Other authors solve only add economic
value in a concrete country (Maitah et al., 2015) or from the view
of economic decisions made under the conditions of risk (Soukup
et al., 2014).
The aim of this paper is to examine and evaluate the quality of governance in individual African countries in a several-year’
period (2004-2010). This enables evaluation and monitoring of
the development tendencies in factors representing the quality of governance (such as government effectiveness, control of
corruption, rule of law), and at the same time the development
of the aggregate indicator itself can be captured. Its partial aim is to identify differences among African countries and their relative positions based on the resulting quality of governance.
2. METHODOLOGY
The quality of national governance is often measured by the
Worldwide Governance Indicators (WGIs) (Kaufmann, 2011) and
the investor protection index developer by Doing Business Project
(World Bank, 2012; 2013). WGIs are considered the primary
and most widely-used indicators in multi country comparative
studies (Ngobo and Fouda, 2012). Reporting WGIs consist of
broad dimensions of the quality of national governance. The six dimensions of the quality of national governance include: Voice and accountability, political stability and absence of violence/ terrorism, government effectiveness, regulatory quality, rule of
law and control of corruption (Kaufman, 2011).
The following factors were considered for the analysis itself: Government effectiveness, control of corruption and rule of law. The input data for the analysis were obtained from World Bank
and Transparency International (www.govindicators.org). The
data have been monitored with a several-year’ delay, which is the
reason why only the period between 2004 and 2010 is analysed.
Each factor is described in more detail in the Table 1.
At first, the exploratory data analysis was applied to the input
data. Using the analysis in SPSS 22, the values of descriptive
characteristics - position and variability - were identified. This concerned the average, minimum and maximum, coefficient of
variation, skewness and kurtosis.
After the initial examination of the data and using the aggregate method, relative positions of African countries were calculated
and defined as well as their order based on the quality of
governance. Aggregate indicators are suitable tools for
identification and decrease of regional disparities, they enable
description of complex phenomena and can be interpreted more
easily than the whole set of partial (individual) factors. They also
enable fast comparison of countries in a given aspect. Several authors have discussed aggregate indicators in their work
(Sen, 1987; Saisana and Tarantola, 2002; Saltelli et al., 2005; Hrach and Mihola, 2006). Some authors use the order method (Saisana and Tarantola, 2002) or the method of standardization (Svatošová et al., 2005). However, as the aggregate indicator
SI y
m
ij j
n
=
∑
=1 , where y is an adjusted value for i-country i = 1,…13, a j-factor j = 1, …m, where m is the number of the countries
in individual dimensions, xij is the initial value of the j-factor for
i-country, xj is arithmetic average of the j-factor.
While: y x
x
ij ij
j
= .
when the lower value of the factor indicates a
better state.
This method derives from the new value of the partial factor and is calculated as the ratio of the real value of the factor to the
average value (or median). This is the reason why the aggregate
indicator for each African country was calculated as an arithmetic
average of newly determined values of partial factors. Minařík and Dufek (2010) mention the same method in their work. In order
to visualize regional disparities, a graphical presentation (SW
Excel) and maps of Africa (SW) were used, which enable clear
presentation of the distribution of the monitored variables in the territory of a particular country.
3. RESULTS AND DISCUSSION
At first, the exploratory analysis was applied to a selected variable.
The results of the analysis are presented in Table 2. This concerns characteristics of position and variability which provide basic descriptive information about the monitored data sets in the monitored year.
Based on the calculations of descriptive characteristics focusing on individual factors that evaluate the quality of governance, it might be concluded that average Government Effectiveness
reaches −0.5843, average control of corruption reaches −0.7651 and average rule of law reaches −0.7029. A very high degree of
variability has been discovered in all the variables. The control of
corruption factor reached the coefficient of variation 77.592% and
the government effectiveness and rule of law variables reached
the coefficient of variation as high as 90.00%.
This means that individual variables related to individual
African countries fluctuate significantly. Thus we can summarize
that, based on the monitored variables, African countries are
significantly heterogeneous. To conclude the exploratory analysis,
the Skewness and kurtosis ratios were calculated. These ratios can be used to determine a frequency distribution. Based on this, it might be stated that the selected variable control of corruption has a slightly higher concentration of low values in comparison with the density of high values and this results in a skewed distribution
of data (skewness = 0.602), which can be described as positive.
On the contrary, based on the lower value of the kurtosis ratio
(kurtosis = 0.264) it can be concluded that the data is spatially distributed; therefore there is a lower concentration of mean values
in comparison with other values of a particular variable.
Furthermore, aggregate indicators for individual factors in the monitored period have been investigated, that is aggregate indicators for government effectiveness, an indicator for control
of corruption as well as an indicator for rule of law (Table 3).
Subsequently, a cumulative aggregate indicator, that is the aggregate indicator for the quality of governance, was calculated based on the individual indicators. According to the cumulative aggregate indicator, Mauritius reached the best results in the
quality of governance in the monitored period (except for the first monitored years 2006). In the first monitored years 2004-2006, Botswana reached the best results. Cape Verde, Namibia
and Seychelles also reached good results in the last monitored years. Individual African countries are highly heterogeneous
(Table 2 - Coefficient of variation), thus significantly imbalanced.
Therefore, this fact must be taken into consideration when interpreting some countries’ positions.
Somalia, Zimbabwe and Equatorial Guinea are positioned at the end of the chart. These countries’ results in the factors mentioned were considerably worse. Somalia has long-term had the highest level of corruption (presented using the control of corruption
factor). The country’s results in the remaining two factors are also notably worse (monitored values).
In the monitored period, Cape Verde’s and Namibia’s positions
have gradually improved (from 49th to 51st and from 47th to
50th respectively). Cape Verde shows a much better result in control
of corruption, from 0.260 (in 2004) to 0.770 in 2010, and in Rule of Law, from 0.309 in 2002 to 0.425 in 2010.
Regarding the total aggregate indicator values of the quality of
governance, variability reaches more than 80%, which signifies high fluctuation among the countries in all the monitored years.
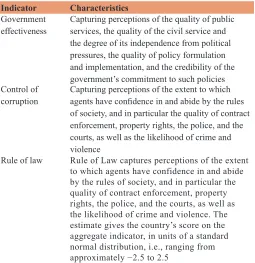
Table 1: Selected factors used to examine the quality of governance in African countries in the period between 2004 and 2010
Indicator Characteristics
Government
effectiveness Capturing perceptions of the quality of public services, the quality of the civil service and the degree of its independence from political pressures, the quality of policy formulation and implementation, and the credibility of the government’s commitment to such policies Control of
corruption Capturing perceptions of the extent to which agents have confidence in and abide by the rules of society, and in particular the quality of contract enforcement, property rights, the police, and the courts, as well as the likelihood of crime and violence
Rule of law Rule of Law captures perceptions of the extent to which agents have confidence in and abide by the rules of society, and in particular the quality of contract enforcement, property rights, the police, and the courts, as well as the likelihood of crime and violence. The estimate gives the country’s score on the aggregate indicator, in units of a standard normal distribution, i.e., ranging from approximately −2.5 to 2.5
Table 2: Basic characteristics of selected variables for 2010
Variables (indicators) Mean Minimum Maximum Coefficient of variation (%) Skewness Kurtosis
Government effectiveness −0.584 −2.240 0.970 106.865 0.218 −0.094
Control of corruption −0.765 −1.730 0.770 77.592 0.602 0.264
Rule of law −0.703 −2.450 0.860 90.017 0.074 0.437
Source: Own research (2015)
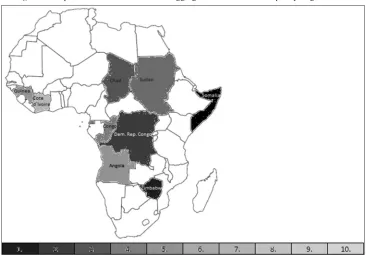
Figure 1: Map of Africa with the results of aggregate indicators for the quality of governance
Source: Own research (2015)
Table 3: Calculated aggregate indicators for each monitored year
Sequence State 2004 2005 2006 2007 2008 2009 2010
1st Somalia 0.057 0.053 0.061 0.063 0.065 0.060 0.059
2nd Zimbabwe 0.037 0.038 0.039 0.040 0.043 0.045 0.044
3rd Equatorial Guinea 0.042 0.040 0.041 0.042 0.041 0.041 0.041
4th Dem. Rep. Congo 0.039 0.040 0.042 0.042 0.040 0.040 0.040
5th Chad 0.034 0.037 0.038 0.041 0.043 0.040 0.040
49th Seychelles −0.003 −0.002 −0.001 −0.004 −0.005 −0.005 −0.005
50th Namibia −0.001 −0.001 −0.003 −0.005 −0.011 −0.005 −0.005
51th Cape Verde −0.006 −0.005 −0.013 −0.017 −0.013 −0.012 −0.012
52th Botswana −0.020 −0.022 −0.018 −0.020 −0.021 −0.020 −0.021
53th Mauritius −0.018 −0.017 −0.017 −0.019 −0.021 −0.021 −0.021
Source: Own research (2015)
Table 4: Order of the countries determined according to the aggregate indicator results
Sequence State 2004 2005 2006 2007 2008 2009 2010
1st Somalia 1st 1st 1st 1st 1st 1st 1st
2nd Zimbabwe 6th 5th 4th 5th 2nd 2nd 2nd
3rd Equatorial Guinea 2nd 2nd 3rd 3rd 4th 3rd 3rd
4th Dem. Rep. Congo 4th 3rd 2nd 2nd 5th 4th 4th
5th Chad 13th 7th 5th 4th 3rd 5th 5th
…
49th Seychelles 48th 48th 47th 47th 48th 48th 49th
50th Namibia 47th 47th 48th 49th 50th 49th 50th
51th Cape Verde 49th 50th 51th 51th 51th 51th 51th
52th Botswana 53th 53th 53th 53th 52th 52th 52th
53th Mauritius 52th 52th 52th 52th 53th 53th 53th
2008 is an extreme exception, when the coefficient of variation reached as much as 90.526%.
Based on the data and according to the calculated aggregate indicators and on the order, a map was created. The map of Africa enables overall comparison of its countries based on the calculated aggregate indicators for the quality of governance in
2010 (See Figure 1). In order to prevent incorrect conclusions, it is
alaways necessary to complement the map by the background data
(Table 4). The darkest shade of grey represents the country with
the worst results in the evaluation, that is its quality of governance
is insufficient/inadequate.
Graphs 1 and 2, which enable comparison of the main indicators - Rule of law, control of corruption and government effectiveness, have been created to demonstrate the development
of changes in selected African countries in comparison of 2004 and 2010 (in order: Three worst and three best evaluated countries).
4. CONCLUSION
As has been mentioned earlier, the quality of governance cans clearly important implications for the prosperity of nations, regions and cities. There is evidence to suggest some close similarities between the quality of governance and various indicators of
prosperity such as regional innovation, competitiveness and life
expectancy (Arndt and Oman, 2006).
For comparison only, the quality of governance in African countries
has reached aggregate indicator values around zero (0.021-0.057).
However, when the aggregate indicator values are closely below 1,
this signifies the mean level of aggregate indicators or the fact that
these countries have reached well balanced results in aggregate indicators. For instance, European countries reach better results
in all the selected variables (Stead, 2014).
Except for the first monitored years, Mauritius has reached the
best results in the overall evaluation of the quality of governance in the monitored period. Botswana was the country that reached
the best results in the first monitored years, that is between 2004 and 2006. Cape Verde, Namibia and Seychelles have also reached
good results in the last monitored years. Somalia, Zimbabwe and
Equatorial Guinea finished at the bottom end of the chart. These
countries have reached significantly worse results in the mentioned
factors. Somalia has long-term had the highest level of corruption, and it shows considerably worse results in the remaining two factors as well.
Unfortunately, the survey conducted in the period between 2004 and 2010 has shown that, based on the monitored variables,
African countries are highly heterogeneous and that, throughout
the monitored period, the situation in the area has not significantly
improved.
REFERENCES
Arndt, C., Oman, C. (2006), The uses and abuses of governance indicators. Development Centre Studies. Paris: OECD. p126.
Bräutigam, D.A., Knack, S. (2004), Economic Development and Cultural Change. Vol. 52. Chicago: The University of Chicago Press. p255-285.
Broome, A., Clegg, L., Rethel, L. (2012), Global governance and the politics of crisis. Global Society, 26(I), 3-17.
Carlsson, J., Somolekae, G., van de Walle, N. (1997), Foreign Aid in Africa: Learning from Country Experiences. Uppsala: Nordiska Afrikainstitute.
Chen, C.W., Chen, Z., Wei, J.K.C. (2009), Legal protection of investors, corporate governance, and the cost of equity capital. Journal of Corporate Finance, 15, 273-289.
Chiou, W.J.P., Lee, A.C., Lee, C.F. (2010), Stock return, risk, and legal environment around the world. International Review of Economics and Finance, 19(1), 95-105.
Chong, A., Calderón, C. (2000), Institutional quality and poverty measures in a cross-section of countries. Economics of Governance, 1(2), 123-135.
Collier, P., Gunning, J. (1995), War, peace and private portfolios. World Development, 23(2), 233-241.
Devarajan, S., Dollar, D.R., Holmgren, T. (2001), Aid and Reform in Africa: Lessons from Ten Case Studies. Washington, DC: World Bank. p696.
Durbarry, R., Gemmell, N., Greenaway, D. (1998), New Evidence on the Impact of Foreign Aid on Economic Growth, Research Paper No. 98/8. University of Nottingham: Centre for Research in Economic Development and International Trade. Nottingham. p17. Elbadawi, I., Sambanis, N. (2009), Why are there so many civil wars in Graph 2: Monitored indicators for aggregation in 2010
Source: Own research (2015)
Graph 1: Monitored indicators for aggregation in year 2004
Africa? Understanding and preventing violent conflict. Journal of Africa Economy, 9(3), 244-269.
Frey, B.S., Stutzer, A. (2000), Happiness, economy and institutions. The Economic Journal, 110(466), 918-938.
Gray, C., McPherson, M. (2001), The leadership factor in African policy reform and growth. Economic Development and Cultural Change,
49(4), 707-740.
Gupta, S., Davoodi, H.R., Alonso-Terme, R. (1998), Does corruption affect income inequality and poverty? IMF Working Paper No. 98/76. Fiscal Affairs Department. Washington, DC: International Monetary Fund.
Harrison, G. (2004), The World Bank and Africa: The Construction of Governance States. London, New York: Routledge. p176.
Holmberg, S., Rothstein, B., Nasiritousi, N. (2009), Quality of government: What you get. Annual Review of Political Science, 12, 135-161.
Hooper, V., Sim, A.B., Uppal, A. (2009), Governance and stock market performance. Journal of Economic Systems, 33, 93-116.
Hrach, K., Mihola, J. (2006), Metodické přístupy ke konstrukci souhrnných ukazatelů./Methodological approaches to creating summary factors. Prague: Czech Statistical Office Statistika (Journal of Statistics) No. 5/2006. p398-418.
Kaufmann, D. (2011), Worldwide Governance Indicators. The World Bank Group. Available from: http://www.info.worldbank.org/governance/ wgi/index.aspx#home.
Kaufmann, D., Kraay, A., Mastruzzi, M. (2010), The worldwide governance indicators: Methodology and analytical issues. World Bank Policy Research Working Paper, 5430. Washington, DC: World Bank.
Knack, S. (1999), Social Capital, Growth and Poverty: A Survey of Cross Country Evidence. Washington, USA: The World Bank, Social Development Family. Environmentally and Socially Sustainable Development Network. p48.
Knack, S., Keefer, P. (1997), Does social capital have an economic payoff? A cross-country investigation. Quarterly Journal of Economics, 112(4), 1251-1288.
Kopriva, R., Kotaskova, S., Maitah, M. (2015), The system of appointment of local political bodies as a factor of social development. The Social Sciences, 10(3), 362-368.
La Porta, R., Lopez-de-Silanes, F., Shleifer, A., Vishny, R. (2002), Investor protection and corporate valuation. Journal of Finance, 57(3), 1147-1170.
Maitah, M., Saleem, N., Malec, K., Boubaker, M., Gouda, S. (2015), Economic value added and stock market development in Egypt. Asian Social Science, 11(3), 126-134.
Minařík, B., Dufek, J. (2010), Disparita krajů České republiky podle indikátorů rozvojového potenciálu/Disparity of Czech regions
according to indicators of development potential. Acta Universitatis Mendelianea Brunensis, 58(3), 29-40.
Mo, P.H. (2001), Corruption and economic growth. Journal of Comparative Economics, 29(1), 66-79.
Morse, S. (2006), Is corruption bad for environmental sustainability? A crossnational analysis. Ecology and Society, 11(1), 1-22.
Mutahaba, G., Baguma, R., Halfani, M. (1993), Vitalizing African Public Administration for Recovery and Development. West Hartford, Conn: Kumarian Press, Univezity of Michigan. p119.
Ngobo, P.V., Fouda, M. (2012), Is “Good” governance good for business? A cross-national study in African countries. Journal of World Business, 47(3), 435-449.
Rothstein, B., Teorell, J. (2008), What is quality of government? A theory of impartial government institutions. Governance, 21(2), 165-190. Saisana, M., Tarantola, S. (2002), State-of-the-art Report on Current
Methodologies and Practices for Composite Indicator Development. European Commission, Joint Research Centre. Ispra, Italy, EUR 20408 EN.
Saltelli, A., Nardo, M., Saisana, M., Tarantola, S., Liška, R. (2005), Agregované indikátory - Kontroverze a její možná řešení. (překlad názvu). Journal of Statistics (Statistika), Prague: Czech Statistical Office, 2, 93-106.
Sen, A.K. (1987), The Standard of Living. Cambridge: University Press. Sikka, P., Lehman, G. (2015), The supply-side of corruption and limits
to preventing corruption within government procurement and constructing ethical subjects. Critical Perspectives on Accounting, 28, 62-70.
Soukup, A., Maitah, M., Svoboda, R. (2014), The concept of rationality in neoclassical and behavioural economic theory. Modern Applied Science, 9(3), 1-9.
Svatošová, L., Boháčková, I., Hrabánková, M. (2005), Regionální Rozvoj z Pozice Strukturální Politiky/Regional Development at the Structural Policy Level. České Budějovice: Jihočeská Univerzita/ University of South Bohemia. 2005.
Stead, D. (2012), Best practices and policy transfer in spatial planning. Planning Practice and Research, 27(1), 103-116.
Tomsík, K., Smutka, L., Lubanda, J.P.E., Rohn, H. (2015), Position of agriculture in Sub-Saharan GDP structure and economic performance. Agris On-line Papers in Economics and Informatics, 7(1), 69-80. Available from: http://www.online.agris.cz/files/2015/ agris_on-line_2015_1_tomsik_smutka_lubanda_rohn.pdf.
World Bank. (2012), Doing Business 2012: Doing Business in A More Transparent World - Economy Profile: Vietnam. Washington, DC, USA: The World Bank.