RESEARCH
Determinants of selection in yeast evolved
by genome shuffling
Damien Biot‑Pelletier
1,2, Dominic Pinel
1,3, Kane Larue
1,4and Vincent J. J. Martin
1*Abstract
Background: Genome shuffling (GS) is a widely adopted methodology for the evolutionary engineering of desirable traits in industrially relevant microorganisms. We have previously used genome shuffling to generate a strain of Sac-charomyces cerevisiae that is tolerant to the growth inhibitors found in a lignocellulosic hydrolysate. In this study, we expand on previous work by performing a population‑wide genomic survey of our genome shuffling experiment and dissecting the molecular determinants of the evolved phenotype.
Results: Whole population whole‑genome sequencing was used to survey mutations selected during the experi‑ ment and extract allele frequency time series. Using growth curve assays on single point mutants and backcrossed derivatives, we explored the genetic architecture of the selected phenotype and detected examples of epistasis. Our results reveal cohorts of strongly correlated mutations, suggesting prevalent genetic hitchhiking and the presence of pre‑existing founder mutations. From the patterns of apparent selection and the results of direct phenotypic assays, our results identify key driver mutations and deleterious hitchhikers.
Conclusions: We use these data to propose a model of inhibitor tolerance in our GS mutants. Our results also sug‑ gest a role for compensatory evolution and epistasis in our genome shuffling experiment and illustrate the impact of historical contingency on the outcomes of evolutionary engineering.
Keywords: Evolutionary engineering, Genome shuffling, Evolution, Lignocellulosic hydrolysate tolerance, Stress tolerance in yeast
© The Author(s) 2018. This article is distributed under the terms of the Creative Commons Attribution 4.0 International License (http://creat iveco mmons .org/licen ses/by/4.0/), which permits unrestricted use, distribution, and reproduction in any medium, provided you give appropriate credit to the original author(s) and the source, provide a link to the Creative Commons license, and indicate if changes were made. The Creative Commons Public Domain Dedication waiver (http://creat iveco mmons .org/ publi cdoma in/zero/1.0/) applies to the data made available in this article, unless otherwise stated.
Background
Genome shuffling (GS) is an evolutionary engineering method based on recursive recombination and selection in populations of mutants (Fig. 1). It aims to speed the rate of evolution of desired traits by exploiting sexual, parasexual or artificial recombination to promote purify-ing selection, positive epistasis, and the accumulation of beneficial mutations, while reducing clonal interference. It has been widely and successfully adopted for the evo-lutionary engineering of industrial traits in microbes [1]. GS and other evolutionary engineering methodologies are notably useful to enhance complex phenotypes for which a detailed molecular level understanding is lacking.
Studies aimed at uncovering the genetic architecture of strains evolved by genome shuffling may thus contrib-ute to an understanding of the genetic basis of complex and industrially relevant traits. Targeted approaches such as candidate gene sequencing [2] and qPCR [3, 4] have been used to uncover the genetic determinants of traits evolved by GS. System-level approaches, like array-com-parative genome hybridization [5], RNAseq [5, 6], and whole genome sequencing [6–8], as well as proteomics methods [9–11] have also been used to investigate the complex genetic architecture of strains derived from GS experiments.
Massively parallel sequencing technologies have ena-bled monitoring of the appearance, frequency and fluc-tuation of mutant alleles in experimental evolution experiments [12]. A growing body of work on adaptive evolution takes advantage of evolve-and-resequence experiments to explore evolutionary dynamics under
Open Access
*Correspondence: [email protected]
various sets of experimental constraints and environ-ments [13]. Several evolutionary behaviors and dynam-ics predicted by evolutionary theory and their effects on adaptation have been illustrated in this way. Notable examples include clonal interference and genetic hitch-hiking in asexual populations [14], the effect of sign epistasis on adaptive landscapes [15] and the mecha-nisms by which sexual recombination speeds adaptation
[16]. Recently, whole population sequencing of evolu-tionary time points has been extended to the study of industrially relevant phenotypes, probing the dynamics and molecular processes affected during adaptation of S. cerevisiae to high ethanol stress [17]. This study identi-fied specific mutations conferring increased tolerance to high ethanol and illustrated the diversity of evolutionary mechanisms involved in the adaptive response to com-plex stresses.
Most evolve-and-resequence studies have studied evo-lution from isogenic starting populations of asexually reproducing microbes [13]. These experimental setups, in which selection is applied on diversity that strictly derives from de novo mutations, have demonstrated pervasive clonal interference and widespread genetic hitchhiking [14, 18, 19]. Parallel evolution is observed in these experi-ments, despite high levels of molecular diversity [20–22]. More relevant to the context of genome shuffling, evolu-tion of S. cerevisiae populations with sexual reproduction and high levels of initial diversity were shown to follow similarly deterministic paths while granting a marginal role for de novo mutations [23]. A similar methodology was used to compare the rate and dynamics of adapta-tion in the absence and presence of sexual recombinaadapta-tion events, showing that sex accelerates the rate of adapta-tion by reducing clonal interference and enabling effi-cient purifying selection [16].
We have previously used GS to successfully evolve strains of Saccharomyces cerevisiae tolerant to spent sulfite liquor (SSL), a toxic lignocellulosic hydrolysate and byproduct of the acid bisulfite wood pulping process [24]. These mutants were characterized as highly toler-ant to osmotic and oxidative stresses, organic acids and phenolic compounds. A strain, designated R57, with high inhibitor tolerance and ability to ferment hydrolysate sugars to ethanol was identified [6]. Whole-genome sequencing, RNAseq and whole population amplicon sequencing were used to probe the genetic architecture of R57. The strain differs from its parent by 21 single nucleotide changes affecting 17 genes [6].
This study aims to explore the evolutionary dynam-ics of genome shuffling by identifying the molecu-lar and evolutionary determinants of selection in our experiment. To our knowledge, it is the first study to use genome sequencing of a GS population at several evolu-tionary time points. It completes our survey of selected mutations and retrieves allele frequency time series span-ning our evolutionary engineering experiment. Inhibitor tolerance assays and genotyping by amplicon sequencing of meiotic segregants of R57 provided data for a multi-variable linear model predicting the contribution of indi-vidual mutations to the hydrolysate tolerance phenotype. The phenotypic effects of single mutations reconstituted Fig. 1 Outline of the genome shuffling experiment. Wild‑type
in wild type or deleted from the R57 background were also tested. Based on these results, we propose a descrip-tive model of the evolutionary dynamics of our GS exper-iment. We discuss the impact of historical contingency and compensatory evolution on the outcomes of GS, and demonstrate prevalent genetic hitchhiking. We also identify key genetic determinants of hydrolysate inhibitor tolerance.
Results
Pooled sequencing of evolving populations
Mutant populations with increased tolerance to hydro-lysate inhibitors were generated by genome shuffling as described in Fig. 1 and previous publications [6, 24]. In short, two pools of random mutants were generated by UV mutagenesis of wild-type MATa and MATα hap-loids. Haploid mutants with tolerance above wild-type levels were selected on gradient plates, which consist in dishes of agar medium displaying increasing concentra-tion of hydrolysate from one end to the other. MATa and MATα mutants were mated to generate diploids carrying random combinations of mutations. These diploids were selected on gradient plates to enrich for individuals with superior hydrolysate tolerance. After mating, diploids were sporulated, digesting and sonicating to disrupt asci and eliminate non-sporulated vegetative cells. Resulting haploids were mated to effect genome shuffling. In total, the mutant pool was submitted to 5 rounds of recursive mating, selection, and sporulation, generating popula-tions with increasing tolerance to hydrolysate inhibitors. Strain R57, which displays high tolerance to hydrolysate inhibitors, was isolated from the fifth and final round of genome shuffling. Its genome differs from the CEN. PK113-7D reference sequence [25] by the 21 single nucle-otide substitutions listed in Additional file 1: Table S2.
To gain insight into the genetic landscape of our pop-ulations evolved by genome shuffling, we investigated the metagenome of seven populations from six time points (Fig. 1). For sequencing, we selected time points covering the entire length of the experiment, including both populations of selected UV haploids and shuffled mutants from each of the five rounds of genome shuffling (R1–R5). Each population was re-sequenced, generating upwards of 300 million reads, for an average of 40 billion nucleotides per sample with a mean base quality score of 35.07 (Additional file 1: Table S1). The 100 nucleo-tide reads were aligned to the CEN.PK113-7D reference genome [25], which is one of the parental strains used in the experiment. Mean depth of coverage oscillated between 712× and 1551×, for an average of 1091×, ena-bling the detection of SNPs represented in < 1% of the population (Additional file 1: Table S1).
A base error model was used for calling SNPs, distin-guishing genuine mutations from sequencing errors. Fil-tering and manual examination resulted in a list of 188 SNPs (Tab “All_mutations” in Additional file 2). A further reduced list was prepared by excluding mutations that either were synonymous or escaped detection in at least one of the six time points (Tab “Non_synonymous_non_ zero” in Additional file 2). We detected the majority of SNPs previously identified in R57 [6] most of which are found at medium to high frequency in the re-sequenced populations (Fig. 2). Previous sequencing of strain R57 found mutations in genes TOF2, DOP1 and FIT3, but they could not be detected by population sequencing, implying that their frequencies fall below our detection threshold.
Correlated evolutionary trajectories suggest genetic hitchhiking
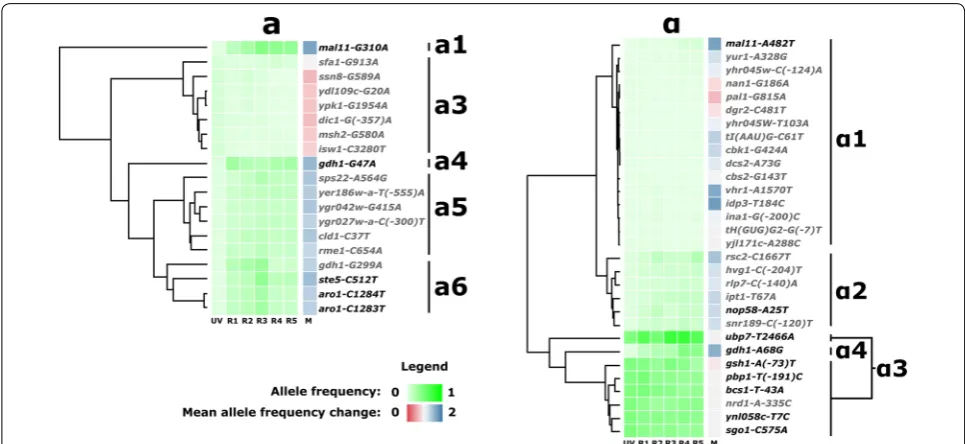
All the 105 SNPs have their origin in either the MATa (33 SNPs) or MATα (72 SNPs) parental strains (Fig. 2 and Additional file 3: Figure S1). Visual examination of the allele frequencies suggested that SNPs could be further clustered in cohorts with strongly correlated evolution-ary trajectories. For example, mutations aro1-CC1283 -4TT and ste5-C512T, both on chromosome IV, display similar frequencies at all time points and originate in the MATa population. This observation suggested the exist-ence of subgroups of SNPs of common origin hitchhik-ing on a few driver mutations. To test this hypothesis and identify cohorts of SNPs potentially linked by origin, we performed hierarchical clustering on the evolutionary trajectories of all SNPs (Fig. 2 and in Additional file 3: Figure S1). Nine cohorts of mutations were deduced from the resulting dendrograms. The majority of mutations are found at very low frequency (≤ 0.02) in all sampled time points, with varying levels of apparent selection. Those mutations are assigned to cohorts α1 and a2.
Three mutations show unique trajectories. Mutation mal11-G310A stands out as displaying the strongest apparent selection, with a mean allele frequency change of 1.69. Similarly, the gdh1-G47A mutation, with a mean allele frequency change of 1.53, is not clustered with other mutations. The gdh1-A68G mutation, displaying one of the strongest apparent selections (M= 1.60), is placed with the α3 cluster by the algorithm, but its tra-jectory is markedly different from other mutations in that cohort. It has a much lower initial frequency and displays stronger positive selection. We, therefore, also assigned gdh1-A68G to its own cohort (α4).
(R3) followed by a decline in subsequent cycles (R4 and R5). With similar trajectories but varying allele frequen-cies, it is not clear whether SNPs clustered in a5 and a6 belong to two independent cohorts or a single group of hitchhikers.
Cohort α3 consists of seven SNPs remarkable for their high and virtually identical initial frequency. SNPs from this group display a frequency of ~ 0.88 in the MATα population, indicating that they nearly swept the popu-lation at early selection steps. This group benefits from the founder effect, remaining highly represented until the end of the experiment. The general pattern followed by all but one mutation (ubp7-T2466A) suggests an absence of selection, or a slow decline in frequency (M= 0.903– 0.970). The mutation in gene UBP7 diverges from the rest of the group, on average increasing in frequency. Large increases in frequency in the early mating and selection cycles (0.49–0.74 between R2 and R3) are followed by a decline, amounting to a modest measure of apparent selection for ubp7-T2466A (M= 1.070).
Five SNPs were detected in all reads of their original mutant population; srb8-C3787G and art5-G454T in the MATa and mtm1-A943T, avl9-C1806G and sro77 -G(-160)T in the MATα. The frequency of these muta-tions oscillates around 0.50 in all 5 genome shuffled
populations, indicating relative neutrality with respect to the selected phenotype (Additional file 2). These two observations suggest that they spontaneously arose in the parental clones before UV mutagenesis.
The signature of genetic hitchhiking observed in our data indicates that a large proportion of the SNPs iden-tified by sequencing arose together in a few founding individuals. From the list of mutations detected by popu-lation sequencing, a restricted subset of mutations is thus expected to contribute to the phenotype of interest.
Certain genes are mutation hotspots
as well as those mapping to NRG1, display a pattern of strongly positive apparent selection (Additional file 4: Figure S2). Remaining hotspots, mapping to genes VHR1, SSN2, YHR045W, UBP1 and COS111 display either nega-tive or nearly neutral selection.
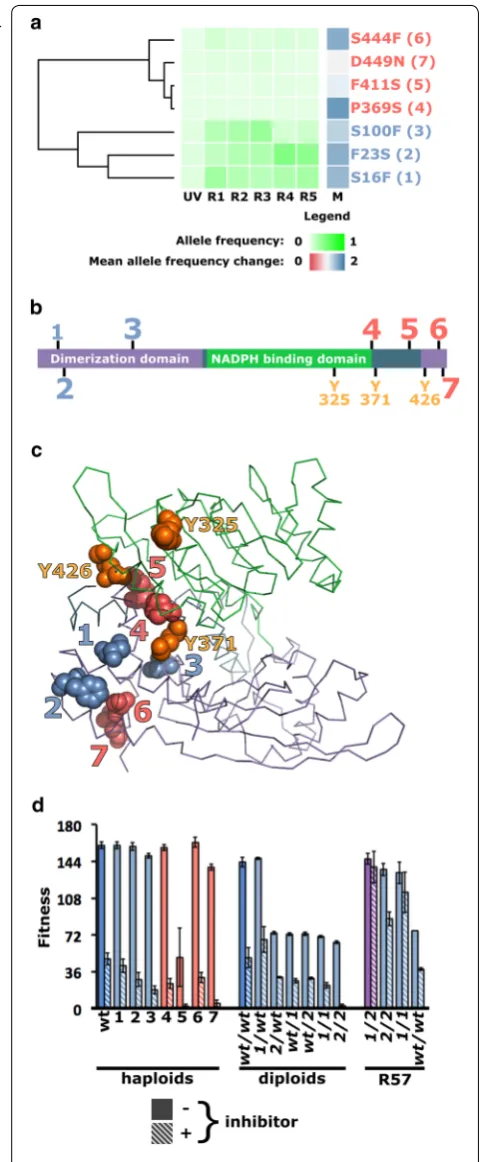
The most remarkable hotspot maps seven non-synon-ymous mutations to GDH1. A strong positive selection was observed for most of these mutations and three of them rapidly rose to prominence in the course of evolu-tion (Fig. 3a). Three mutations cluster at the N-terminus of Gdh1p and four at the C-terminus (Fig. 3b). Multiple sequence alignment of Gdh1p homologs did not suggest a high level of sequence conservation for the affected res-idues (data not shown), but mapping of Gdh1p substitu-tions on a homology model (see Additional file 5) showed that both N- and C-terminal substitutions are grouped near the hinge region separating the two structural domains of the protein (Fig. 3c). Together, these observa-tions convincingly argue for the strong selection of gdh1 alleles by our genome shuffling experiment.
To test the effect of gdh1 mutations on the phenotype, the seven-point mutants were reconstructed in a wild-type parental haploid background. Under non-selective conditions, with the exception of the crippling D411S mutation, all haploid gdh1 mutants grow as well as their wild-type parent but showed decreased fitness upon expose to the inhibitory substrate (Fig. 3d). Reversion of the S16F or F23S mutations found in strain R57 did not alter growth in permissive conditions, but resulted in loss of fitness in a wild-type homozygous background (Fig. 3d). In R57, the GDH1/GDH1 genotype is associated with a growth defect both in the presence and absence of inhibitors. Mutations in gene GDH1 are important for the inhibitor tolerance phenotype of R57, with reduced
Fig. 3 Mutations in GDH1 played a critical role in the evolution of SSL tolerance. a Seven independent mutations result in amino acid substitutions in the Gdh1 protein. Their evolutionary trajectories cluster into a high (blue) and low (red) frequency group. b The high‑frequency group maps at the N‑terminus of Gdh1p, while the low frequency cohort affects residues clustered at the C‑terminus.
c Mapping of the seven substitutions onto a homology model of Gdh1p reveals that they all cluster in or near the hinge connecting the two structural domains of the protein, an area rich with known ubiquitination sites (displayed in orange). d Introduction of the gdh1
mutations into haploid and diploid wild‑type backgrounds leads to a loss of fitness. Removal of mutant gdh1 alleles from the SSL‑tolerant R57 background is also associated with a loss of tolerance. Error bars represent ± 1 standard deviation
tolerance most obvious when S16F is reverted either alone or in combination with F23S. Together, these observations suggest reciprocal sign epistasis between gdh1 alleles and the wild-type and mutant backgrounds.
Effect of individual mutations on inhibitor tolerance phenotype
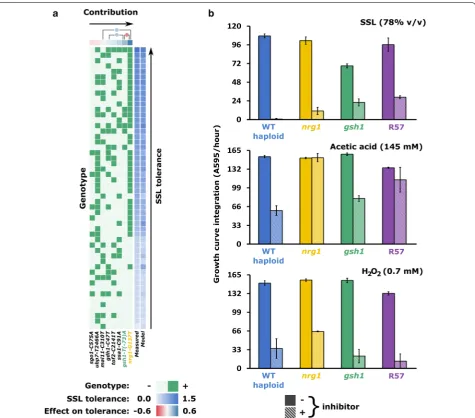
To estimate the contribution of individual mutations on the selected phenotype, we backcrossed random haploid segregants of R57 with the wild-type MATα parent strain and the fitness of 86 second-generation derivatives was assayed under permissive and inhibitory conditions. The result revealed a continuous distribution in their level of tolerance, with some mutants displaying a phenotype superior to the R57 parent (Additional file 6: Figure S3). A Kolmogorov–Smirnov test (α= 0.05) suggests a normal distribution for the fitness of the isolates, in agreement with the hypothesis of a polygenic quantitative trait.
We used amplicon sequencing to genotype the 86 segregants. For the vast majority of strains and loci, we achieved depth of coverage well above 30 with an average of 794, enabling confident genotyping (Additional file 1: Table S2). Multiple linear regression analysis was applied separately on the haploid and diploid data sets to predict the effect of each SNP on the phenotype (summarized in Fig. 4a, Additional file 7: Figure S4). Fewer variables and more data points mean that we have higher confi-dence in the haploid model than in the diploid model (see Additional file 5). Accordingly, there is better agreement between predictions of the haploid model and measured phenotypes. In both haploids and diploids, the strong-est predictor for enhanced tolerance is the nrg1-G137T mutation. Examination of the genotype heatmap in Fig. 4a shows a clear clustering of nrg1 isolates at higher inhibitor tolerance levels. In haploids, the gsh1-T(-73) A mutation is also strongly associated with a high toler-ance phenotype, although the model proposes negative epistasis between the nrg1 and gsh1 alleles. Mutations ssa1-C91A, tof2-C2141T and gdh1-C47T are also asso-ciated with modest increases in haploid tolerance, albeit the effect of the latter is proposed to be enhanced by interaction with gsh1-T(-73)A. Deleterious for haploids are mutations mal11-C310T, ubp7-T2466A and espe-cially sgo1-C575A. Mutation mal11-C310T has virtually no effect (p value = 0.254 that linear coefficient is equal to 0), but is proposed to interact with nrg1-G137T to fur-ther increase tolerance.
Reconstruction and reversion of SNPs
To confirm the contribution of individual mutations to the tolerance phenotype, a subgroup of 27 was recon-structed into the MATα parental strain. In agreement
with our backcross experiment, gsh1-T(-73)A and nrg1 -G137T both increased fitness of wild-type haploids (Fig. 4b). In contrast, the same SNPs in hetero- and homozygous wild-type diploids did not increase fitness (Additional file 8: Figure S5). Fitness of haploid and dip-loid nrg1 gsh1 double mutants is not higher than that of the fittest mutant, suggesting that the effect of these SNPs is non-cumulative. Further supporting a contribu-tion of these SNPs to the phenotype, reversion to wild-type abolished the enhanced phenowild-type of haploid single mutants (Additional file 9: Figure S6).
To narrow the physicochemical stresses to which nrg1 and gsh1 mutations conferred resistance, we compared the fitness of haploid single mutants with wild type and R57 cells exposed to acetic acid or hydrogen peroxide (Fig. 4b). The nrg1-G137T mutation bestowed increased fitness in the presence of both compounds, enabling faster growth than wild type and R57. The gsh1-T(-73)A mutation does not seem to confer the same advantage. Among mutations identified by population sequencing, a subset of the most positively selected was also introduced in the MATα haploid, but an increase in tolerance was not observed for those strains.
mutations. Together, these results show that gdh1 alleles exert their effect via an epistatic mechanism. The precise mechanism is still elusive, but from the growth defect of R57 GDH1 cells in the presence and absence of inhibi-tors, we speculate that they act by complementation in a complex network of genetic interactions.
Discussion
The results of this study identified key molecular deter-minants of hydrolysate tolerance. Our evidence identifies genes NRG1, GSH1 and GDH1 as having the strongest
Molecular determinants of fitness in lignocellulosic hydrolysates
Our evidence indicates that the low frequency but strongly selected mutation nrg1-G137T confers the strongest direct gains in hydrolysate inhibitor toler-ance among all SNPs considered in this study (Fig. 4, Additional file 4: Figure S2, Additional file 7: Figure S4, Additional file 9: Figure S6 and Additional file 10: Figure S7). These results are consistent with previous RNAseq results in R57 that showed considerable upregulation of five targets of transcriptional regulator Nrg1p, including NRG1 itself [6].
NRG1 and its close paralog NRG2 encode DNA-binding proteins first identified as mediators of glucose repression [26, 27]. The Nrg1/2p repressors have been implicated in the response to various stresses, including glucose [28] and zinc limitation [29], alkaline pH [30], salt tolerance [31, 32] and organic acid challenge [33]. Identification of transcripts with altered expression in null mutants of NRG1 and NRG2 established their role in the regulation of the general stress response [34]. Dele-tion of NRG1 or NRG2 changes the transcription of 150 genes, many of which display stress response elements (STREs) or related sequences in their promoter regions. A significant overlap between the Nrg1/2p and Msn2/4p regulons further supports a role for Nrg proteins in the regulation of the general stress response [26, 35]. We, therefore, propose that nrg1-C137A is a loss of function mutation that leads to the upregulation of general stress response genes.
Our models predict that mutation gsh1-T(-73)A makes the second largest contribution to inhibitor tolerance in haploids (Fig. 4a). Accordingly, haploids carrying this single mutation display enhanced growth in the pres-ence of high concentrations of hydrolysate (Fig. 4b). The near sweep of the MATα mutant pool by the gsh1-T(-73) A allele also suggests a significant selective advantage in the presence of high concentrations of hydrolysate. We have previously shown that haploids carrying the mutant gsh1-T(-73)A allele accumulate lower levels of reactive oxygen species (ROS) than their wild-type parents when exposed to high concentrations of hydrolysate [36]. This is consistent with the role of Gsh1p in the synthesis of the antioxidant glutathione [37]. The mutation identified in our mutants is located 73 bp upstream of the start codon, outside Yap1p and other hydrogen peroxide respon-sive sequences [38–40]. The position of this SNP in the region proximal to the start codon identifies alteration of the basal promoter as the most likely mechanism. We propose that upregulation of GSH1 by this modified pro-moter increases glutathione synthesis and reduces accu-mulation of ROS in gsh1-T(-73)A mutants.
Several lines of evidence point to GDH1 as a key deter-minant of selection in our genome shuffling experiment. Notably, this gene is the most populated mutation hot-spot (Fig. 3a) and gdh1 alleles appear required for hydro-lysate tolerance in mutant R57 (Fig. 3d). However, their effect appears epistatic, since their introduction into wild-type backgrounds is associated with growth defects, perhaps suggesting a compensatory role in hydrolysate tolerant strain R57 (Fig. 3d).Glutamate dehydrogenase Gdh1p, along with close homolog Gdh3p, catalyzes amination of α-ketoglutarate, yielding glutamate [41]. Under fermentative conditions, Gdh1p is the dominant glutamate dehydrogenase, while carbon limitation, non-fermentable carbon sources and entry into the stationary phase induce the expression of Gdh3p [42, 43]. Tran-scription of GDH1 is sustained at all phases of growth, but entry into the stationary phase triggers ubiquitin-mediated degradation of Gdh1p. Gdh3p is specifically expressed during the stationary phase. Gdh1p is a faster enzyme, suited for growth-sustaining glutamate synthe-sis. Gdh3p is slower, better suited to sustain glutathione synthesis during the stationary phase and under stress-ful conditions [42]. Accordingly, Gdh3p has been impli-cated in stress tolerance in yeast, while transient loss of tolerance to hydrogen peroxide is observed during early phases of growth in gdh1Δ mutants [43]. From the map-ping of the seven amino acid substitutions on the Gdh1 protein, we suggest two potential mechanisms for their action. One possibility is that they affect inter-domain flexibility and, thus, catalytic activity, as suggested by structural studies of bacterial homologs [44]. The substi-tutions are located near known ubiquitination sites [43,
45]. A second hypothesis is thus that they impair degra-dation of Gdh1p in conditions of stress or during the sta-tionary phase. Regardless of its underlying mechanism, we propose that the gdh1 hotspot was selected to com-pensate the pull on glutamate exerted by upregulation of glutathione biosynthesis in gsh1-T(-73)A mutants, espe-cially under hydrolysate inhibitor stress. This hypothesis would explain the strong growth defect incurred by R57 upon reversion of gdh1 mutations and, therefore, the reciprocal sign epistasis observed with these mutations.
The role of MAL11 in the transport of the stress-protectant molecule trehalose suggests involvement of mutations of this hotspot in hydrolysate tolerance [46]. Our model of hydrolysate tolerance in haploids suggests interactions between the nrg1-C137A and mal11-C310T mutations. MAL11 is repressed by glucose, notably via the action of Mig1p [47–49]. Overlap between the Mig1p and Nrg1p regulons suggests a potential mechanism for this regulation [26].
inhibitors. However, in a derivative of R57 wild type at the SGO1 locus and homozygous for the gdh1-A68G allele, reversion to wild type at the YNL058C locus leads to a loss of SSL tolerance. This suggests a role for this gene in inhibitor tolerance. The function of YNL058C is essentially unknown, but the protein it encodes appears to localize to the vacuole [50]. Both YNL058C and its paralog PRM5 are induced via the cell wall integrity path-way, indicating a role in the response to cell wall damage [51, 52]. Downregulation of YNL058C was also observed upon DNA damage [53]. Together, these reports indi-cate a role for YNL058C in the response to stress and cell damage, in agreement with an involvement in hydro-lysate tolerance.
Mutation ste5-C512T displays the highest apparent selection and average frequency in cohort a6. The model of R57 backcrosses indicates that it makes the second highest contribution to inhibitor tolerance in diploids (Additional file 7: Figure S4). STE5 encodes a scaffold protein involved in facilitation and integration of pher-omone-induced MAPK signaling [54]. Components of the pheromone-induced MAPK pathway were also impli-cated in stress signaling [55–59]. Because Ste5p binds the Kss1p MAPK, it mediates signals involved in stress. It is thus likely that the ste5-C512T mutation modulates the Ste20p-Ste11p-Ste7p-Kss1p pathway to stimulate the execution of a stress response program.
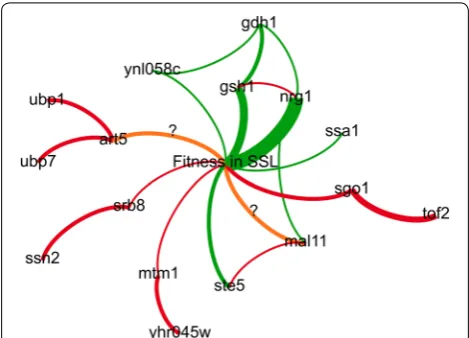
Our understanding of the hydrolysate inhibitor tol-erance phenotype selected in our genome shuffling
mutants, as described above, is summarized in Fig. 5. In brief, our results indicate that mutant alleles nrg1 -G137T and gsh1-T(-73)A are the main determinants of hydrolysate inhibitor tolerance in our evolved mutants. Our evidence also ascribes a critical role for gdh1 alleles. The phenotype associated with these alleles in parental and mutant strains demonstrates reciprocal sign epista-sis and is coherent with a compensatory mechanism. We propose putative mechanisms for other potential con-tributing alleles. These alleles may help in the rational engineering of hydrolysate inhibitor tolerance strains. However, a recent study showed that the genetic deter-minants of hydrolysate inhibitor tolerance in yeast can prove highly strain-dependent [60]. Therefore, it would be interesting to test the impact of mutations identified herein in various industrial strain backgrounds.
Evolutionary determinants of selection by genome shuffling
Our experiment is characterized by a set of early genetic features that had a determining effect on its overall out-comes. These features are the presence of mutations in the parental strains, prevalent genetic hitchhiking, and a selective sweep that severely reduced diversity at early selection steps. We argue that these features favored spe-cific evolutionary solutions and elicited a strong selective pressure in favor of compensatory mechanisms.
The MATα parental strain contained mutations mtm1 -A943T, avl9-C1806G and sro77-G(-160)T, while the MATa parent carried SNPs srb8-C3787G and art5 -G454T. We draw parallels between these founding muta-tions and mutational hotspots identified by population genome sequencing. Both MTM1 and YHR045W have been implicated in iron metabolism [61–63]. Similarly, the ssn2 hotspot can be linked to the srb8-C3787G sub-stitution. Both genes encode subunits of the RNA poly-merase II mediator complex [64–68]. The ubp1 hotspot is notable, owing to the high frequency of the ubp7-T2466A mutation in our pool. Both genes encode ubiquitin-spe-cific proteases [69, 70]. The prevalence of the founding art5-G454T mutation, mapping to a gene involved in the regulation of membrane protein homeostasis [71], suggests that complementing mutations involved in this cell process were selected during our experiment. The yhr045w, ssn2 and ubp1 mutations all remain at low fre-quency, with either weakly positive or negative apparent selection. This would suggest that complementation of founder mutations confers marginal competitive advan-tages. However, the prevalence and persistence of muta-tion ubp7-T2466A are hypothesized to result from the same epistatic dynamics. The coincidental presence of this mutation in the same mutant as the α3 driver gsh1 -T(-73)A likely caused the selection of ubp7-T2466A by Fig. 5 Network map model of SSL tolerance in genome shuffled
hitchhiking, while its arguably minor role in comple-menting art5-G454T was seemingly sufficient to ensure its persistence, in contrast with other hitchhikers of the same cohort.
Clustering of mutations in cohorts with correlated evo-lutionary trajectories is commonly observed in experi-mental evolution experiments as a signature of genetic hitchhiking [14]. In the context of our genome shuffling experiment, this observation suggests that a large pro-portion of mutant alleles arose together in a few found-ing individuals. Prominent examples are cohorts a5, a6 and α3, putatively driven by ste5-C512T or gdh1-G299A, and gsh1-T(-73)A, respectively (Fig. 2). We expect that most examples of genetic hitchhiking negatively affected the fitness of mutants, because the majority of mutations tend to be neutral or deleterious [72]. Previous studies in yeast on the evolutionary effects of sexual recombination suggest that it favors purifying selection of hitchhikers [16]. Accordingly, the majority of putative hitchhikers in our experiment either display consistently low frequency or negative apparent selection (Fig. 2). Despite evidence of purifying selection, putative hitchhikers of cohort α3 persist at high frequency until the end of the GS experi-ment. This could in part be due to vegetative cells escap-ing the sporulation and matescap-ing process. Yet, sporulation efficiency was high (40% on average) and both digestion and sonication of vegetative cells after sporulation should have minimized the impact of non-shuffled mutants on the evolutionary dynamics of the experiment. Further, cohort α3 nearly swept the initial pool of MATα mutants likely due to an aggressive early selection. This first selec-tion was performed before the onset of sexual recombi-nation cycles and illustrates the well-documented effect of clonal interference on the evolution of asexually repro-ducing populations [14, 16].
We propose that the founding features discussed above caused major evolutionary responses, and that those are critical to understanding the dynamics of the experiment. For example, the presence of mutational hotspots iden-tifies loci under strong selective pressure and we have shown that many appear related to founding mutations. Similarly, the mechanism proposed above for epista-sis between gdh1 and gsh1 mutant alleles would explain the evolutionary signal detected at the GDH1 hotspot. The convergence of the gsh1-driven selective sweep with founding mutation art5-G454T also appears to have driven the persistence of the ubp7-T2466A hitch-hiker allele. Finally, the minor evolutionary role played by the tolerance-conferring nrg1-G137T mutation may be caused at least in part by the founder effect favoring gsh1-T(-73)A coupled to negative epistasis between the two alleles, as suggested by our linear model of hydro-lysate tolerance (Fig. 4a). This observation resonates with
experimental evolution studies of sexually reproduc-ing yeast that showed a major role for standreproduc-ing diver-sity and ascribed a minor evolutionary role to rare or de novo mutations [23]. It also illustrates the dominant role played by compensatory mechanisms over direct enhancement of hydrolysate tolerance in our experiment.
In contrast to previous experimental studies of com-pensatory evolution, the examples proposed in this study rely on convergent signals at specific loci. Convergent compensatory evolution at the functional rather molecu-lar level has previously been reported [73]. Because the path of compensatory evolution was shown to be con-strained both by environmental factors and the genetic background, the level of molecular convergence that we observe would indicate a targeted response to highly spe-cific conditions [74].
Descriptive model of evolutionary dynamics in the genome shuffling experiment
Conclusions
In this study, we identified some of the key determi-nants of selection in a genome shuffling experiment. We ascribed critical roles to loci NRG1, GSH1 and GDH1 to the hydrolysate inhibitor tolerance phenotype. With regard to recent results [60], the applicability of these evolutionary solutions to different strain backgrounds remains to be established.
More fundamentally, we have illustrated the impact that a few, early features can have on the course of evolu-tionary engineering by genome shuffling. It also suggests that this regimen of recursive recombination leads to the widespread selection of compensatory mechanisms, illustrating the construction of strains in which delicate complementation networks operate to offset the fitness cost incurred by founding mutations, hitchhikers and the pleiotropic effects of core beneficial alleles. To expand on the specific outcomes of our experiment, we propose that purposefully designed genome shuffling experiments performed on diverse genetic backgrounds with precise variations in initial conditions could aid the design of future strain development endeavors, and contribute to our understanding of evolution in sexually reproducing populations, especially as it pertains to compensatory evolution.
Methods
Evolution by genome shuffling
All strains of S. cerevisiae used in this study are derived from prototrophic strains CEN.PK113-1A (wild-type MATα) and CEN.PK113-7D (wild-type MATa). Mating of the haploids was used to generate the wild-type diploid. The genome shuffling experiment is described in detail in a previous publication [24] and is summarized in Fig. 1. Briefly, to generate genetically diverse starting popula-tions, MATα and MATa haploid mutant pools were gen-erated by UV irradiation. These initial pools were spread onto gradient plates for selection of cells with inhibitor tolerance above the wild type. Irradiated cells growing above the wild type were scraped off the plate and ali-quots from both populations were preserved as glycerol stocks at − 80 °C for later sequencing. The two popula-tions of selected haploid were mixed 1:1 for mating and diploids were selected on gradient plates. This first pop-ulation of selected diploids was sporulated, digesting vegetative cells with Zymolyase (MP Biomedicals) and sonicating them before mating, generating a first genome shuffled population R1. Four additional recursive cycles of selection, sporulation and mating were performed resulting in populations R2–R5, which showed increas-ing tolerance to the inhibitory substrate at each matincreas-ing cycle. Genome shuffled populations selected on gradient plates were propagated overnight in YPD at 30 °C and
aliquots were preserved as glycerol stocks at − 80 °C for later sequencing.
Pool‑seq of evolved populations
Prior to genomic DNA extractions, cells from glycerol stocks of the two UV irradiated (a-UV and α-UV) and five genome shuffled populations (R1–R5) were thawed and incubated in YPD for 1 h. They were then sus-pended in 50 mM Tris–HCl pH 8.0,10 mM EDTA, 5% 2-mercaptoethanol (v/v), 200 U/ml yeast lytic enzyme (MP Biomedicals) for 1 h at 37 °C. Genomic DNA was extracted using the DNeasy Blood and Tissue Kit (Qia-gen) according to the manufacturer’s instructions and quantified using the QuantiFluor dsDNA System (Pro-mega). Genomic DNA was sequenced at the McGill Uni-versity and Genome Quebec Innovation Centre using the TrueSeq library preparation reagents and an Illumina HiSeq 2500 sequencer (100 bp paired-end reads). Each of the 7 populations was sequenced on a separate lane of a HiSeq chip to maximize depth of coverage.
Quality control of raw sequencing data was performed using FastQC [75] and overlapping read pairs were merged with PEAR [76]. Alignment to the CEN.PK113-7D reference genome [25] was done using bwa mem [77] and performed separately for overlapping and non-overlapping reads. Output SAM files for non-overlapping and non-overlapping reads were merged with the MergeSam-Files utility in Picard Tools [78]. Picard was next used to add read groups, sort reads, then mark and remove dupli-cates prior to indel realignment with the Genome Analy-sis Toolkit [79–81]. Alignment metrics were extracted using Picard Tools.
SNPs were called and filtered using a base error model inspired from Barrick and Lenski [18] as detailed in Additional file 5.
Mutant allele frequency, strength of selection and hierarchical clustering of evolutionary trajectories
The proportion of mismatch reads at given genomic coordinates was considered to reflect the frequency (p) of the associated mutant allele within the sequenced popu-lations. The frequency of all mutations was extracted for the seven sequenced populations. The frequency of each mutation was necessarily zero in one of the haploid pop-ulations, allowing the identification of its origin (MATα or MATa). Furthermore, because the two haploid popula-tions represented a single evolutionary time point, their frequency was averaged to obtain the pre-shuffling allele frequencies (i.e., pUV = (pα +pa)/2). Allele frequencies of the R1–R5 populations each represented time points of their own.
points (Δpt1−t2 =pt2/pt1). The geometric mean frequency change (noted M) was used as a synthetic measure of selection to smooth the effect of proportionally large fre-quency changes often observed between time points UV and R1. Hierarchical clustering of evolutionary trajecto-ries was performed by running the clustermap routine of the Seaborn Python library [82].
Backcrossing experiment
To assess the contribution of each SNP to the inhibitor tolerance phenotype, strain R57 was backcrossed with parental wild-type MATα. Cells from the resulting F2 population were scored for tolerance to inhibitors (Addi-tional file 6: Figure S3). Haploids of R57 were generated on sporulation medium (1% potassium acetate, 0.1% yeast extract, 0.05% dextrose, 2% agar) incubated at room temperature for 6 days, resulting in > 50% sporulation efficiency. Cells were scraped from the plate and digested overnight at 30 °C with 100 U of yeast lytic enzyme (MP Biomedicals) in 5 ml of H2O containing 10 μl of 2-mer-captoethanol. Five microlitre of 1.5% IGEPAL was added to the digest, incubated on ice for 15 min and sonicated 3× for 30 s. Spores were harvested by centrifugation at 12,000×g for 10 min and suspended in 5 ml 1.5% IGE-PAL. The sonication procedure was repeated once more and the spores were suspended in 250 μl of YPD broth. For mating, spores were mixed with an approximately equal amount of MATα cells (CENPK113-1A), spotted on YPD agar and incubated overnight at 30 °C. Result-ing R57 × 1A spores were spotted on YPD agar and then allowed to germinate and mate for 48 h. The resulting diploids were submitted to a second round of sporulation and mating to further shuffle mutations. After mating, cells were streaked for single colonies on YPD agar and 86 isolated colonies were picked for genotyping and fit-ness assays.
Preparation of yeast genomic DNA template for PCR
Cells from 1.5 ml of culture were harvested in a tabletop microcentrifuge and the resulting pellet was suspended in 250 μl of 50 mM Tris–Cl pH 8.0 supplemented by 20 U of yeast lytic enzyme. This digestion solution was incu-bated at 37 °C for 1 h. Cell lysis was induced by adding 250 μl of 200 mM NaOH, 1% SDS, vortexing, and incu-bating for 5 min at room temperature. The lysates were neutralized with the addition of 350 μl of 3 M potassium acetate pH 5.5 and clarified by centrifugation at 13,300×g for 10 min. DNA from the resulting supernatants was precipitated by adding 600 μl of 2-propanol and centri-fuged at 13,300×g for 10 min. The resulting DNA pellet was air dried for 15 min, suspended in 100 μl of H2O, and vortexed before incubation for 15 min in a water bath at 55 °C.
Genotyping of backcrossed isolates
We genotyped 86 backcrossed isolates at 18 of the mutant loci identified in R57 by PCR amplicon sequencing. Both forward and reverse primers consisted of a common 5′
heel sequence (forward: 5′-CGT TCA ACC TTG TCC AAC AGTG-3′ and reverse: 5′-GAA GCG ATG ACT CGA GCG TATT-3′) and a 24–28 nucleotide gene-specific sequence at the 3′ end. PCRs contained genomic DNA template, 0.5 μM primers, 200 μM dNTPs, 1× high fidelity sion buffer (Thermo Fisher), 1.5% DMSO and 1 U of Phu-sion High Fidelity DNA polymerase (Thermo Fisher) in 50 μl. Cycling conditions were as follows: 98 °C for 30 s, then 35 cycles of 98 °C for 10 s, 55 °C for 20 s, 72 °C for 4 s, followed by a 5 min final extension at 72 °C. Ion tor-rent sequencing adapters and barcodes were added in a second PCR. This second reaction was performed using a common reverse primer consisting of the ion torrent P1 adapter (5′-CCT CTC TAT GGG CAG TCG GTGAT-3′) and the reverse heel sequence. The 96 forward prim-ers consisted of the ion torrent A adapter (5′-CCA TCT CAT CCC TGC GTG TCT CCG ACT CAG -3′), a unique 8 nucleotide barcode and the forward heel sequence. Com-position of this second PCR was the same as for locus-specific amplification, using 1 μl of a 1:10 dilution of the first reaction as template. Cycling conditions were: 98 °C for 30 s, then 35 cycles of 98 °C for 10 s, 70 °C for 20 s, 72 °C for 6 s, followed by a 5 min final extension at 72 °C. All primers used for genotyping are listed in Additional file 1: Table S3. PCR products carrying the same bar-code were pooled and DNA migrating between 100 and 400 bp was purified on a 2% agarose gel using the Gene-Jet gel extraction kit (Thermo Fisher). Equal amounts of all pools were mixed to make the sequencing library. The DNA concentration of this pool was measured on a Qubit 2.0 fluorometer (Life Technologies). Ion tor-rent sequencing template was prepared from our pooled library with an Ion PGM Template OT2 400 Kit accord-ing to the manufacturer’s instructions. Sequencaccord-ing was performed with an Ion PGM sequencer using the Ion PGM Hi-Q sequencing kit and an Ion 316 Chip v2 BC, all following manufacturer’s protocols and instructions.
this assumption. If it did, a heterozygous genotype was called. Otherwise, the identity of the most frequent base call was checked. If the most frequent base call was the reference base, a wild-type genotype was called, oth-erwise a homozygous mutant genotype was called. In strains previously identified as haploid, heterozygosity calls were corrected and genotype was called based on the identity of the most frequent base call. All genotype calls were reviewed visually.
Reconstruction and reversion of SNPs using CRISPR‑Cas9
To probe their contribution on the observed pheno-type, point mutations were reintroduced in wild-type backgrounds (CEN.PK113-1A, MATα or CEN.PK113-7D, MATa) or reverted to wild type in strain R57 using CRISPR-Cas9 as described previously [36]. Briefly, gRNAs were designed to introduce double-stranded breaks (DSBs) in the vicinity of the mutation. DSBs were repaired by homologous recombination with donor DNAs replacing the 20-nt protospacer sequence by a heterologous stuffer sequence. This stuffer was tar-geted by a second gRNA and the resulting DSBs were repaired by a stuffer-free donor DNA carrying the point mutations. The result was the seamless introduction of single nucleotide changes.
Fitness assays
Cell growth when exposed to varying concentrations of the inhibitory substrate was used to measure the fitness of the strains. Prior to the assays, cells we pre-adapted with overnight incubations in undiluted inhibitory sub-strate at 30 °C. For fitness assays, adapted cells were washed 3× in 10 mM sodium citrate pH 5.5 and inocu-lated to a final concentration of ~ 2 × 10⁵ into YNB 1% glucose supplemented with varying concentrations (0–85%) of the inhibitory substrate in 96-well plates (Costar 3595, Corning). Plates were incubated at 30 °C with shaking in a Tecan Sunrise absorbance reader, measuring absorbance at 595 nm every 20 min. Because inhibitors may affect growth rate, lag time, maximum cell density or any combination thereof, we used the area under the growth curves as a measure of fitness. The lignocellulosic inhibitory substrate was kindly sup-plied by Tembec (Témiscaming, Québec) and AV Cell (Atholville, New Brunswick). The pH of the substrate was adjusted to 5.5 with 10 M NaOH prior to use in culture medium.
Multiple linear regression model
Detailed description of multiple linear regression methodology is provided in Additional file 5. Briefly,
contribution of individual SNPs to the phenotype was predicted from linear models. These models were built by multiple linear regression, using genotype at each of the mutant loci as explanatory variables and area under growth curves in 85% inhibitor substrate as the response variable. Distinct models were built for hap-loid and diphap-loid mutants. A single binary variable was used for each locus in haploids, with wild type = 0 and mutant = 1. In diploids, each locus was represented by three binary variables representing the wild type, het-erozygous mutant and homozygous mutant genotypes, respectively. For the haploid model, fitting using all possible combinations of variables was performed and the model that minimized Mallows Cp and variance of residuals was chosen. The large number of variables involved with diploids made this approach impractical and so it was performed in a stepwise manner. Inter-action between loci was modeled in an ad hoc manner, using a stepwise methodology similar to what was used for diploids.
Additional files
Additional file 1: Table S1. Population sequencing and alignment metrics. Table S2. Amplicon sequencing and alignment metrics for genotyping of R57 backcrossing isolates. Table S3. List of primers used for production of Ion Torrent sequencing libraries.
Additional file 2. List of single nucleotide polymorphisms detected by whole population sequencing.
Additional file 3: Figure S1. Evolutionary trajectories for all non‑silent mutations identified by population genome sequencing at 6 time points. Mutations arose either in the MATα (left) or MATa (right) haploid popula‑ tions. On the vertical axis are the names of the mutations, giving the closest gene, coordinates with respect to that gene and the nature of the nucleotide substitution. On the horizontal axis are each of the six evolu‑ tionary time points (UV, R1, R2, R3, R4, R5) and the mean allele frequency change (M). Frequencies of the mutant alleles are represented by shades of green. Mean allele frequency changes are represented in shades of red (M < 1, declining frequency) or blue (M > 1, increasing frequency). Hierar‑ chical clustering of individual evolutionary trajectories is represented by dendrograms on the left. Mutations were assigned to groups of mutations (a1‑5, α1‑4) on the basis of this clustering. Mutations present in highly tolerant mutant R57 are highlighted in bold.
Additional file 6: Figure S3. Backcrossing of R57 with wild type cells generates strains presenting a wide spectrum of fitness in SSL. Growth in the presence and absence of SSL is reported for R57, various wild type cell types and 86 F2 isolates from backcrossing of R57 and CEN.PK113‑1A. Error bars represent plus or minus one standard deviation. The dashed line is a visual reference for the level achieved by the wildtype.
Additional file 7: Figure S4. Genotyping of second generation seg‑ regants from backcrossing of R57 and wild type yeast suggest a model of SNP contributions to the SSL tolerance phenotype. Haploid (A) and diploid (B) isolates are scored in green for the genotypes indicated at the bottom. Growth in 85% SSL is scored in shades of blue on the right. Each row represents a single strain. Contribution to the phenotype of the indicated genotypes was inferred by multiple linear regression, yielding coefficients represented at the top in shades of red (diminishes fitness) to blue (increases fitness). Modeling of genetic interactions was attempted and the resulting coefficients are represented as circles at the top of the heatmaps. Growth in SSL predicted by the linear model is reported in shades of blue in the rightmost column, showing the level of agreement between the model and the data.
Additional file 8: Figure S5. Single mutations are not sufficient to detect an increase in SSL tolerance in diploid cells. Area under the growth curve in the presence and absence of SSL for heterozygous (A) and homozy‑ gous (B) single diploid mutants is reported. Error bars represent plus or minus one standard deviation. The dashed line is a visual reference for the level achieved by the wildtype.
Additional file 9: Figure S6. Reversion of nrg1 and gsh1 mutations leads to loss of the SSL tolerance phenotype in haploid single mutants. Area under the growth curve for nrg1 and gsh1 double mutants, haploid (nrg1 gsh1) and diploid (nrg1/nrg1 gsh1/GSH1) is also reported. Error bars represent plus or minus one standard deviation. The dashed line is a visual reference for the level achieved by the wildtype.
Additional file 10: Figure S7. Growth in the presence and absence of SSL of single and double revertants identifies mutations contributing to the SSL tolerance phenotype. Area under the growth curve in the presence and absence of SSL is reported for (A) single haploid mutants, (B) single revertant derivatives of R57 and (C) revertant derivatives of R57 SGO1 gdh1-2/2, wild type for the indicated genes. Error bars represent plus or minus one standard deviation. The dashed line is a visual reference for the level achieved by the wildtype.
Authors’ contributions
According to the CRediT taxonomy, author contributions are the following. Conceptualization: DBP, DP, KL, VM. Methodology: DBP, DP, KL, VM. Software: DBP. Validation: DBP. Formal analysis: DBP. Investigation: DBP, DP, KL. Resources: VM. Data curation: DBP. Writing—original draft preparation: DBP, VM. Writing— review and editing: DBP, DP, KL, VM. Visualization: DBP. Supervision: VM. Project administration: VM. Funding acquisition: VM. All authors read and approved the final manuscript.
Author details
1 Department of Biology, Centre for Structural and Functional Genomics, Centre for Applied Synthetic Biology, Concordia University, 7141 Sherbrooke Street West, Montreal, QC H4B 1R6, Canada. 2 Present Address: Lallemand Inc., Montréal, QC H4P 2R2, Canada. 3 Present Address: Amyris Inc, Emeryville, CA 94608, USA. 4 Present Address: Charles River Laboratories, Senneville, QC H9X 3R3, Canada.
Acknowledgements
We give our most sincere thanks to Hung Lee (University of Guelph) and Kevin Shiell (Collège communautaire du Nouveau‑Brunswick) for helping us secure a supply of spent sulfite liquor. We thank Tembec and AV Cell for producing and graciously providing spent sulfite liquor for use in our research. We would also like to thank Mathieu Bourgey of the Canadian Centre for Computational Genomics for advice in the analysis of NGS data. We also thank Vladimir Rhein‑ harz of the McGill University Department of Computer Science for advice on the critical assessment of multiple linear regression results.
Competing interests
The authors declare that they have no competing interests.
Availability of data and materials
All data generated or analyzed during this study, with the exception of population sequencing data, are included in this published article and its sup‑ plementary information files. The datasets generated and analyzed during the current study are available in the National Center for Biotechnology Informa‑ tion (NCBI) sequence read archive (https ://www.ncbi.nlm.nih.gov/sra) under accession number SRP141714.
Consent for publication Not applicable.
Ethics approval and consent to participate Not applicable.
Funding
The Natural Sciences and Engineering Research Council of Canada Bioconver‑ sion Network (NETGP350246‑07), BioFuelNet and a Canada Research Chair to V.J.J.M supported this research. Damien Biot‑Pelletier and Dominic Pinel were supported by a graduate scholarship from the Fonds de Recherche du Québec—Nature et Technologies. The funders had no role in study design, data collection and analysis, decision to publish, or preparation of the manuscript.
Publisher’s Note
Springer Nature remains neutral with regard to jurisdictional claims in pub‑ lished maps and institutional affiliations.
Received: 17 July 2018 Accepted: 6 October 2018
References
1. Biot‑Pelletier D, Martin VJJ. Evolutionary engineering by genome shuf‑ fling. Appl Microbiol Biotechnol. 2014;98:3877–87.
2. Wei Y, Wang C, Wang M, Cao X, Houa L. Comparative analysis of salt‑ tolerant gene HOG1 in a Zygosaccharomyces rouxii mutant strain and its parent strain. J Sci Food Agric. 2013;93:2765–70.
3. Yin H, Ma Y, Deng Y, Xu Z, Liu J, Zhao J, et al. Genome shuffling of Sac-charomyces cerevisiae for enhanced glutathione yield and relative gene expression analysis using fluorescent quantitation reverse transcription polymerase chain reaction. J Microbiol Methods. 2016;127:188–92. 4. Zhao J, Zhang C, Lu J, Lu Z. Enhancement of fengycin production in
Bacil-lus amyloliquefaciens by genome shuffling and relative gene expression analysis using RT‑PCR. Can J Microbiol. 2016;62:431–6.
5. Zheng D‑Q, Chen J, Zhang K, Gao K‑H, Li O, Wang P‑M, et al. Genomic structural variations contribute to trait improvement during whole‑ genome shuffling of yeast. Appl Microbiol Biotechnol. 2014;98:3059–70. 6. Pinel D, Colatriano D, Jiang H, Lee H, Martin VJ. Deconstructing the
genetic basis of spent sulphite liquor tolerance using deep sequencing of genome‑shuffled yeast. Biotechnol Biofuels. 2015;8:53.
7. Harner NK, Bajwa PK, Formusa PA, Austin GD, Habash MB, Trevors JT, et al. Determinants of tolerance to inhibitors in hardwood spent sulfite liquor in genome shuffled Pachysolen tannophilus strains. Antonie Van Leeuwenhoek. 2015;108:811–34.
8. Huang S, Xue T, Wang Z, Ma Y, He X, Hong J, et al. Furfural‑tolerant
Zymomonas mobilis derived from error‑prone PCR‑based whole genome shuffling and their tolerant mechanism. Appl Microbiol Biotechnol. 2018;102:3337–47.
9. Zhang Y, Liu J‑Z, Huang J‑S, Mao Z‑W. Genome shuffling of Propionibac-terium shermanii for improving vitamin B12 production and comparative proteome analysis. J Biotechnol. 2010;148:139–43.
11. Guan N, Shin H, Chen RR, Li J, Liu L, Du G, et al. Understanding of how
Propionibacterium acidipropionici respond to propionic acid stress at the level of proteomics. Sci Rep. 2014;4:6951.
12. Long A, Liti G, Luptak A, Tenaillon O. Elucidating the molecular archi‑ tecture of adaptation via evolve and resequence experiments. Nat Rev Genet. 2015;16:567–82.
13. Jerison ER, Desai MM. Genomic investigations of evolutionary dynamics and epistasis in microbial evolution experiments. Curr Opin Genet Dev. 2015;35:33–9.
14. Lang GI, Rice DP, Hickman MJ, Sodergren E, Weinstock GM, Botstein D, et al. Pervasive genetic hitchhiking and clonal interference in forty evolv‑ ing yeast populations. Nature. 2013;500:571–4.
15. Kvitek DJ, Sherlock G. Reciprocal sign epistasis between frequently experimentally evolved adaptive mutations causes a rugged fitness landscape. PLoS Genet. 2011;7(4):e1002056.
16. Mcdonald MJ, Daniel P, Rice DP, Desai MM, Daniel P. Sex speeds adaptation by altering the dynamics of molecular evolution. Nature. 2016;531:233–6.
17. Voordeckers K, Kominek J, Das A, Espinosa‑Cantú A, De Maeyer D, Arslan A, et al. Adaptation to high ethanol reveals complex evolutionary path‑ ways. PLoS Genet. 2015;11(11):e1005635.
18. Barrick JE, Lenski RE. Genome‑wide mutational diversity in an evolv‑ ing population of Escherichia coli. Cold Spring Harb Symp Quant Biol. 2009;74:119–29.
19. Tenaillon O, Barrick JE, Ribeck N, Deatherage DE, Blanchard JL, Dasgupta A, et al. Tempo and mode of genome evolution in a 50,000‑generation experiment. Nature. 2016;536:165–70.
20. Tenaillon O, Rodriguez‑Verdugo A, Gaut RL, McDonald P, Bennett AF, Long AD, et al. The molecular diversity of adaptive convergence. Science. 2012;335:457–61.
21. Herron MD, Doebeli M. Parallel evolutionary dynamics of adaptive diversi‑ fication in Escherichia coli. PLoS Biol. 2013;11(2):e1001490.
22. Cooper VS, Staples RK, Traverse CC, Ellis CN. Parallel evolution of small colony variants in Burkholderia cenocepacia biofilms. Genomics. 2014;104:447–52.
23. Burke MK, Liti G, Long AD. Standing genetic variation drives repeatable experimental evolution in outcrossing populations of Saccharomyces cerevisiae. Mol Biol Evol. 2014;31:3228–39.
24. Pinel D, D’Aoust F, del Cardayre SB, Bajwa PK, Lee H, Martin VJ. Sac-charomyces cerevisiae genome shuffling through recursive population mating leads to improved tolerance to spent sulfite liquor. Appl Environ Microbiol. 2011;77:4736–43.
25. Otero JM, Vongsangnak W, Asadollahi MA, Olivares‑Hernandes R, Maury J, Farinelli L, et al. Whole genome sequencing of Saccharomyces cerevisiae: from genotype to phenotype for improved metabolic engineering appli‑ cations. BMC Genomics. 2010;11:723.
26. Park SH, Koh SS, Chun JH, Hwang HJ, Kang HS. Nrg1 is a transcriptional repressor for glucose repression of STA1 gene expression in Saccharomy-ces cerevisiae. Mol Cell Biol. 1999;19:2044–50.
27. Zhou H, Winston F. NRG1 is required for glucose repression of the SUC2
and GAL genes of Saccharomyces cerevisiae. BMC Genet. 2001;2:5. 28. Kuchin S, Vyas VK, Carlson M. Snf1 protein kinase and the repressors Nrg1
and Nrg2 regulate FLO11, haploid invasive growth, and diploid pseudo‑ hyphal differentiation. Mol Cell Biol. 2002;22:3994–4000.
29. Lyons T, Gasch A, Gaither L, Botstein D, Brown PO, Eide DJ. Genome‑wide characterization of the Zap1p zinc‑responsive regulon in yeast. Proc Natl Acad Sci USA. 2000;97:7957–62.
30. Lamb TM, Xu W, Diamond A, Mitchell AP. Alkaline response genes of Sac-charomyces cerevisiae and their relationship to the RIM101 pathway. J Biol Chem. 2001;276:1850–6.
31. Lamb TM, Mitchell AP. The transcription factor Rim101p governs ion tolerance and cell differentiation by direct repression of the regula‑ tory genes NRG1 and SMP1 in Saccharomyces cerevisiae. Mol Cell Biol. 2003;23:677–86.
32. Haro R, Garciadeblas B, Rodriguez‑Navarro A. A novel P‑type ATPase from yeast involved in sodium transport. FEBS Lett. 1991;291:189–91. 33. Mira NP, Becker JD, Sá‑Correia I. Genomic expression program involving
the Haa1p‑regulon in Saccharomyces cerevisiae response to acetic acid. OMICS. 2010;14:587–601.
34. Vyas VK, Berkey CD, Miyao T, Carlson M. Repressors Nrg1 and Nrg2 regu‑ late a set of stress‑responsive genes in Saccharomyces cerevisiae. Eukaryot Cell. 2005;4:1882–91.
35. Murad AMA, Leng P, Straffon M, Wishart J, Macaskill S, MacCallum D, et al.
NRG1 represses yeast‑hypha morphogenesis and hypha‑specific gene expression in Candida albicans. EMBO J. 2001;20:4742–52.
36. Biot‑Pelletier D, Martin VJ. Seamless site‑directed mutagenesis of the Sac-charomyces cerevisiae genome using CRISPR‑Cas9. J Biol Eng. 2016;10:6. 37. Grant CM. Role of the glutathione/glutaredoxin and thioredoxin systems
in yeast growth and response to stress conditions. Mol Microbiol. 2001;39:533–41.
38. Stephen DW, Jamieson DJ. Amino acid‑dependent regulation of the Sac-charomyces cerevisiae GSH1 gene by hydrogen peroxide. Mol Microbiol. 1997;23:203–10.
39. Sugiyama KI, Izawa S, Inoue Y. The Yap1p‑dependent induction of glu‑ tathione synthesis in heat shock response of Saccharomyces cerevisiae. J Biol Chem. 2000;275:15535–40.
40. Dormer UH, Westwater J, Stephen DWS, Jamieson DJ. Oxidant regulation of the Saccharomyces cerevisiae GSH1 gene. Biochim Biophys Acta Gene Struct Expr. 2002;1576:23–9.
41. Avendano A, Deluna A, Olivera H, Valenzuela L, Gonzalez A. GDH3
encodes a glutamate dehydrogenase isozyme, a previously unrecog‑ nized route for glutamate biosynthesis in Saccharomyces cerevisiae. J Bacteriol. 1997;179:5594–7.
42. DeLuna A, Avendaño A, Riego L, González A. NADP‑glutamate dehy‑ drogenase isoenzymes of Saccharomyces cerevisiae: purification, kinetic properties, and physiological roles. J Biol Chem. 2001;276:43775–83. 43. Lee YJ, Kim KJ, Kang HY, Kim HR, Maeng PJ. Involvement of GDH3‑
encoded NADP+‑dependent glutamate dehydrogenase in yeast cell
resistance to stress‑induced apoptosis in stationary phase cells. J Biol Chem. 2012;287:44221–33.
44. Stillman TJ, Baker PJ, Britton KL, Rice DW. Conformational flexibility in glutamate dehydrogenase: role of water in substrate recognition and catalysis. J Mol Biol. 1993;234:1131–9.
45. Starita LM, Lo RS, Eng JK, von Haller PD, Fields S. Sites of ubiquitin attach‑ ment in Saccharomyces cerevisiae. Proteomics. 2012;12:236–40. 46. Han EK, Cotty F, Sottas C, Jiang H, Michels CA. Characterization of AGT1
encoding a general α‑glucoside transporter from Saccharomyces. Mol Microbiol. 1995;17:1093–107.
47. Hu Z, Nehlin JO, Ronne H, Michels CA. MIG1‑dependent and MIG1‑inde‑ pendent glucose regulation of MAL gene expression in Saccharomyces cerevisiae. Curr Genet. 1995;28:258–66.
48. Zhang CY, Bai XW, Lin X, Liu XE, Xiao DG. Effects of SNF1 on maltose metabolism and leavening ability of baker’s yeast in lean dough. J Food Sci. 2015;80:M2879–85.
49. Hu Z, Yue Y, Jiang H, Zhang B, Sherwood PW, Michels CA. Analysis of the mechanism by which glucose inhibits maltose induction of MAL gene expression in Saccharomyces. Genetics. 2000;154:121–32.
50. Huh W‑K, Falvo JV, Gerke LC, Carroll AS, Howson RW, Weissman JS, et al. Global analysis of protein localization in budding yeast. Nature. 2003;425:686–91.
51. Arias P, Díez‑Muñiz S, García R, Nombela C, Rodríguez‑Peña JM, Arroyo J. Genome‑wide survey of yeast mutations leading to activation of the yeast cell integrity MAPK pathway: novel insights into diverse MAPK outcomes. BMC Genomics. 2011;12:390.
52. Jung US, Levin DE. Genome‑wide analysis of gene expression regu‑ lated by the yeast cell wall integrity signalling pathway. Mol Microbiol. 1999;34:1049–57.
53. Maas N, Miller K, DeFazio L, Toczyski D. Cell cycle and checkpoint regulation of histone H3 K56 acetylation by Hst3 and Hst4. Mol Cell. 2006;23:109–19.
54. Elion EA. The Ste5p scaffold. J Cell Sci. 2001;114:3967–78. 55. Gustin MC, Albertyn J, Alexander M, Davenport K. MAP kinase path‑
ways in the yeast Saccharomyces cerevisiae. Microbiol Mol Biol Rev. 1998;62:1264–300.
56. O’Rourke SM, Herskowitz I. The Hog1 MAPK prevents cross talk between the HOG and pheromone response MAPK pathways in Saccharomyces cerevisiae. Genes Dev. 1998;12:2874–86.
•fast, convenient online submission •
thorough peer review by experienced researchers in your field • rapid publication on acceptance
• support for research data, including large and complex data types •
gold Open Access which fosters wider collaboration and increased citations maximum visibility for your research: over 100M website views per year •
At BMC, research is always in progress.
Learn more biomedcentral.com/submissions
Ready to submit your research? Choose BMC and benefit from:
58. Roberts RL, Fink GR. Elements of a single map kinase cascade in Saccha-romyces cerevisiae mediate two developmental programs in the same cell type: mating and invasive growth. Genes Dev. 1994;8:2974–85.
59. Lee BN, Elion EA. The MAPKKK Ste11 regulates vegetative growth through a kinase cascade of shared signaling components. Proc Natl Acad Sci USA. 1999;96:12679–84.
60. Sardi M, Paithane V, Place M, Robinson DE, Hose J, Wohlbach DJ, et al. Genome‑wide association across Saccharomyces cerevisiae strains reveals substantial variation in underlying gene requirements for toxin tolerance. PLoS Genet. 2018;14(2):e1007217.
61. Luk E, Carroll M, Baker M, Culotta VC. Manganese activation of superoxide dismutase 2 in Saccharomyces cerevisiae requires MTM1, a member of the mitochondrial carrier family. Proc Natl Acad Sci USA. 2003;100:10353–7. 62. Whittaker MM, Penmatsa A, Whittaker JW. The Mtm1p carrier and
pyridoxal 5′‑phosphate cofactor trafficking in yeast mitochondria. Arch Biochem Biophys. 2015;568:64–70.
63. Jo WJ, Kim JH, Oh E, Jaramillo D, Holman P, Loguinov AV, et al. Novel insights into iron metabolism by integrating deletome and transcriptome analysis in an iron deficiency model of the yeast Saccharomyces cerevisiae. BMC Genomics. 2009;10:130.
64. Carlson M, Osmond BC, Neigeborn L, Botstein D. A suppressor of SNF1
mutations causes constitutive high‑level invertase synthesis in yeast. Genetics. 1984;107:19–32.
65. Balciunas D, Ronne H. Three subunits of the RNA polymerase II media‑ tor complex are involved in glucose repression. Nucleic Acids Res. 1995;23:4426–33.
66. Kornberg RD. Mediator and the mechanism of transcriptional activation. Trends Biochem Sci. 2005;30(5):235–9.
67. Larschan E, Winston F. The Saccharomyces cerevisiae Srb8‑Srb11 complex functions with the SAGA complex during Gal4‑activated transcription. Mol Cell Biol. 2005;25:114–23.
68. Song W, Treich I, Qian N, Kuchin S, Carlson M. SSN genes that affect transcriptional repression in Saccharomyces cerevisiae encode SIN4, ROX3, and SRB proteins associated with RNA polymerase II. Mol Cell Biol. 1996;16:115–20.
69. Tobias JW, Varshavsky A. Cloning and functional analysis of the ubiquitin‑ specific protease gene UBP1 of Saccharomyces cerevisiae. J Biol Chem. 1991;266:12021–8.
70. Amerik AY, Li SJ, Hochstrasser M. Analysis of the deubiquitinat‑ ing enzymes of the yeast Saccharomyces cerevisiae. Biol Chem. 2000;381:981–92.
71. Lin CH, MacGurn JA, Chu T, Stefan CJ, Emr SD. Arrestin‑related ubiquitin‑ ligase adaptors regulate endocytosis and protein turnover at the cell surface. Cell. 2008;135:714–25.
72. Ohta T. Near‑neutrality in evolution of genes and gene regulation. Proc Natl Acad Sci USA. 2002;99:16134–7.
73. Szamecz B, Boross G, Kalapis D, Kovacs K, Fekete G, Farkas Z, et al. The genomic landscape of compensatory evolution. PLoS Biol. 2014;12(8):e1001935.
74. Filteau M, Hamel V, Pouliot M, Gagnon‑Arsenault I, Dubé A, Landry C. Evo‑ lutionary rescue by compensatory mutations is constrained by genomic and environmental backgrounds. Mol Syst Biol. 2015;11(10):832. 75. Andrews S. FastQC: a quality control tool for high throughput sequence
data. 2010. http://www.bioin forma tics.babra ham.ac.uk/proje cts/fastq c/. Accessed 11 Oct 2018.
76. Zhang J, Kobert K, Flouri T, Stamatakis A. PEAR: a fast and accurate Illu‑ mina Paired‑End reAd mergeR. Bioinformatics. 2014;30:614–20. 77. Li H, Durbin R. Fast and accurate short read alignment with Burrows–
Wheeler transform. Bioinformatics. 2009;25:1754–60.
78. Broad Institute. Picard: a set of command line tools for manipulating high‑throughput sequencing (HTS) data and formats. 2016. http://broad insti tute.githu b.io/picar d/. Accessed 11 Oct 2018.
79. McKenna A, Hanna M, Banks E, Sivachenko A, Cibulskis K, Kernytsky A, et al. The genome analysis toolkit: a MapReduce framework for analyzing next‑generation DNA sequencing data. Genome Res. 2010;20:1297–303. 80. DePristo MA, Banks E, Poplin R, Garimella KV, Maguire JR, Hartl C, et al. A
framework for variation discovery and genotyping using next‑generation DNA sequencing data. Nat Genet. 2011;43:491–8.
81. Van der Auwera GA, Carneiro MO, Hartl C, Poplin R, del Angel G, Levy‑ Moonshine A, et al. From FastQ data to high‑confidence variant calls: the Genome Analysis Toolkit best practices pipeline. Curr Protoc Bioinform. 2013;43:11.10.1‑33.
82. Waskom M. Seaborn: statistical data visualization. 2016. https ://seabo
rn.pydat a.org/. Accessed 11 Oct 2018.
83. Larson D. Bam‑readcount: program to generate metrics at single nucleotide positions from BAM files. 2016. https ://githu b.com/genom e/