R E S E A R C H A R T I C L E
Open Access
Clustering analysis of microRNA and mRNA
expression data from TCGA using
maximum edge-weighted matching
algorithms
Lizhong Ding
1, Zheyun Feng
2and Yongsheng Bai
1,3*Abstract
Background:microRNA (miRNA) is a short RNA (~ 22 nt) that regulates gene expression at the posttranscriptional level. Aberration of miRNA expressions could affect their targeting mRNAs involved in cancer-related signaling pathways. We conduct clustering analysis of miRNA and mRNA using expression data from the Cancer Genome Atlas (TCGA). We combine the Hungarian algorithm and blossom algorithm in graph theory. Data analysis is done using programming language R and Python.
Methods:We first quantify edge-weights of the miRNA-mRNA pairs by combining their expression correlation coefficient in tumor (T_CC) and correlation coefficient in normal (N_CC). We thereby introduce a bipartite graph partition procedure to identify cluster candidates. Specifically, we propose six weight formulas to quantify the change of miRNA-mRNA expression T_CC relative to N_CC, and apply the traditional hierarchical clustering to subjectively evaluate the different weight formulas of miRNA-mRNA pairs. Among these six different weight formulas, we choose the optimal one, which we define as the integrated mean value weights, to represent the connections between miRNA and mRNAs. Then the Hungarian algorithm and the blossom algorithm are employed on the miRNA-mRNA bipartite graph to passively determine the clusters. The combination of Hungarian and the blossom algorithms is dubbed maximum weighted merger method (MWMM).
Results:MWMM identifies clusters of different sizes that meet the mathematical criterion that internal connections inside a cluster are relatively denser than external connections outside the cluster and biological criterion that the intra-cluster Gene Ontology (GO) term similarities are larger than the inter-intra-cluster GO term similarities. MWMM is developed using breast invasive carcinoma (BRCA) as training data set, but can also applies to other cancer type data sets. MWMM shows advantage in GO term similarity in most cancer types, when compared to other algorithms.
Conclusions:miRNAs and mRNAs that are likely to be affected by common underlying causal factors in cancer can be clustered by MWMM approach and potentially be used as candidate biomarkers for different cancer types and provide clues for targets of precision medicine in cancer treatment.
Keywords:Cancer, miRNAs and mRNAs, Gene regulation, BRCA, TCGA, Bipartite graph, Graph partitioning, Hungarian algorithm, Blossom algorithm, Clustering
© The Author(s). 2019Open AccessThis article is distributed under the terms of the Creative Commons Attribution 4.0 International License (http://creativecommons.org/licenses/by/4.0/), which permits unrestricted use, distribution, and reproduction in any medium, provided you give appropriate credit to the original author(s) and the source, provide a link to the Creative Commons license, and indicate if changes were made. The Creative Commons Public Domain Dedication waiver (http://creativecommons.org/publicdomain/zero/1.0/) applies to the data made available in this article, unless otherwise stated.
* Correspondence:[email protected]
1Department of Biology, Indiana State University, Terre Haute, IN 47809, USA 3Department of Internal Medicine, University of Michigan, Ann Arbor, MI
48105, USA
Background
Cancer is an abnormal growth of cells, which divide with-out control and spread into surrounding tissue. According to the website of the Cancer Statistics Center from the American Cancer Society (https://cancerstatisticscenter. cancer.org/#!/), in 2017 in the U.S., there were an esti-mated 1,688,780 new cancer cases and 600,920 cancer deaths. Cancer is a genetic disease caused by alterations of genes that control the cell behavior, like cell growth and division. Genetic, transcriptional as well as other alter-ations can be comprehensively identified from next gener-ation sequencing (NGS) data of samples collected from tumorous tissue and normal adjacent tissue in the same patients suffering from a specific type of cancer. Those data are accumulated and organized by different projects such as International Cancer Genome Consortium (ICGC) [1], Encyclopedia of DNA Elements (ENCODE) [2], and the Cancer Genome Atlas (TCGA) [3]. The TCGA project was initiated in 2006 to develop a publicly-accessible infrastructure of data. TCGA finalized tissue collection with matched tumor and normal tissues from 11,000 patients with 33 cancer types and subtypes, includ-ing 10 rare types of cancer. TCGA data has been used to characterize key genomic changes, find novel mutations, define intrinsic tumor types, discover similarities and dif-ferences across cancer types, reveal therapy resistance mechanisms, and collect tumor evolution evidence [3].
microRNA (miRNA) is a very short RNA (~ 22 nt) that can regulate gene expression at the post-transcriptional level [4]. Mainly from either intronic or intergenic re-gions of noncoding or coding genes [5, 6], miRNAs are transcribed primarily by RNA polymerase II to be parts of longer primary miRNA (pri–miRNA) transcripts that are capped, spliced, and polyadenylated [7,8]. In the nu-cleus, pri–miRNA is processed, by the Microprocessor complex that consists of the RNase III enzyme Drosha and its cofactor DGCR8, to produce precursor miRNA hairpin (pre–miRNA). The resulting pre–miRNA is then exported to the cytoplasm and cleaved by Dicer to pro-duce miRNA:miRNA duplex. Then the functional miRNA strand and Argonaute (AGO2) proteins are in-corporated into the RNA–induced silencing complex (RISC) [9]. The base pairing between miRNA and mRNA relies on the seed region, about 2–8 nt in an miRNA, which functions as a part in the RISC, bound to the complementary region in the 3′ UTR of its target mRNA [10]. The miRNA guides RISC to silence the tar-get mRNAs by means of mRNA cleavage, translational repression, or deadenylation [11].
Regulation of the miRNA and mRNA network is com-plex. A single miRNA can target many mRNAs, while many miRNAs are able to cooperatively target a single mRNA. This allows for fine-tuned gene expression regu-lation [12]. The cooperativity within some miRNA
families or genomic clusters that target the same mRNAs is likely to be mainly additive [10]. miRNA also has sponge function for mRNA. When one of the mRNAs targeted by a specific miRNA change its expres-sion level, the specific miRNA will redistribute and alter the protein translation of several transcripts. [13]. Thereby, considering these complexity, the observed expression correlation coefficient of a particular miRNA-mRNA targeting pair can range from −1 to 1, not always negative, even if the miRNA-mRNA has pre-dicted or experimentally validated targeting relation-ships. The aberration of miRNA expression could affect a large number of mRNAs and cancer-related signaling pathways [14]. Some previous studies discovering and explaining this complexity in cancer are summarized as follows:
In a breast cancer study, miR-183 was experimentally proven to directly target the 3′-UTR of its target gene RAB21, by co-transfecting the luciferase reporters with 33 bp of the predicted target regions. The miR-183/− 96–182 genomic cluster also has transcription factors HSF2 and ZEB1 that are experimentally validated to bind to the upstream of the TSS region of the miR-183/
−96–182. Nevertheless, analyzing the 508 clinical sam-ples from TCGA data, the correlations between miR-183/−96/−182 cluster miRNAs and their target/regula-tors do not exhibit simply positive or negative correla-tions. Experimentally verified direct correlation between miR-183 and the expressions of RAB21 could not be found based on the TCGA data analysis. But some inter-esting correlations between them in different subtypes were found [15], indicating the clue of solving the miRNA-mRNA network complexity by grouping the subtypes of the cancer types.
In a study of ovarian cancer, it was found that the miRNA-mRNA pair hsa-miR-140-3p/RAD51AP1, was negatively correlated in both normal and tumorous sam-ples with downregulated miRNA and upregulated mRNA expression values in tumor relative to normal samples, suggesting the expressional dysregulation of a direct miRNA-mRNA interaction mechanism. However, some miRNA-mRNA pairs were positively or negatively corre-lated in the tumor samples, but not in the normal sam-ples, implying that the miRNAs de novo gain functions in tumor. Some miRNA-mRNA pairs show correlations in normal samples but not in tumor samples, implying that the miRNA de novo lose functions in tumors. Intriguingly, the miRNA-mRNA pairs that are positively correlated in both tumor and normal samples were identified, suggest-ing potential indirect pathways or intermediate regulatory mechanisms in tumorigenesis [16].
calculated from NGS expression data [18]. Clustering results can be enhanced or filtered by integrated analysis of known or predicted miRNA-mRNA targeting infor-mation [19]. For example, MAGIA2 utilizes negative ex-pressional correlation coefficients between miRNA and mRNA across many matched or unmatched samples [19]. However, MAGIA2 neglects the situation that the miRNAs that have positive correlation coefficients also play a role in the regulatory network. miRMAP studies both significant negative and positive correlations be-tween miRNA and mRNA; its bicluster analysis of miRNA-mRNA bipartite graph provides insights into how modules of miRNAs regulate groups of functionally related mRNAs [10]. However, miRMAP only consid-ered tumor condition. Thereby it lacks the view of the correlation coefficient changes between normal and tumor tissues. MMiRNA-Viewer visualizes altered ex-pressional correlation coefficients of miRNA and mRNA in both tumor and normal; the correlation coefficient of a miRNA-mRNA pair could be the same or inverted in sign in tumor compared to normal [18]. However, the connections between miRNA and mRNA are not com-bined together to quantify the miRNA-mRNA correl-ation coefficient changes from normal to tumor.
Although Jansson and Lund explained the potential mechanisms of how a target mRNA may become uncoupled from its targeted miRNA [14], the factors inverting the miRNA-mRNA expression correlation coefficient from normal to tumor are still unclear, indi-cating the complex direct and indirect regulation of the miRNA and mRNA network. In this study, we proposed six weight formulas to quantify the change of miRNA-mRNA expressional correlation coefficients in tumor relative to in normal. We used the traditional hierarch-ical clustering algorithm to evaluate different formula weights of miRNA-mRNA pairs and chose the integrated mean value weight. Then, we developed a novel bioinfor-matics pipeline called maximum weighted merger method (MWMM) based on objective optimization al-gorithms, namely the Hungarian and blossom algorithm, to cluster the miRNA–mRNA pairs. We hypothesized that the miRNA-mRNA pairs with higher weights, if properly clustered together, are more likely to be in-tensely affected by common causal factors in the com-plex direct and indirect network.
Methods
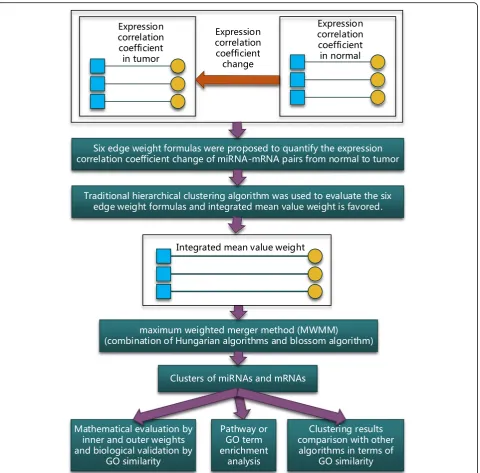
This study focused on the expression correlation coeffi-cient changes of miRNA-mRNA pairs that were inverse from in normal to in tumor. Six edge weight formulas, which were proposed to simultaneously quantify the changes, were evaluated using the subjective traditional hierarchical clustering algorithm. After evaluation, inte-grated mean value weight was used to quantify the
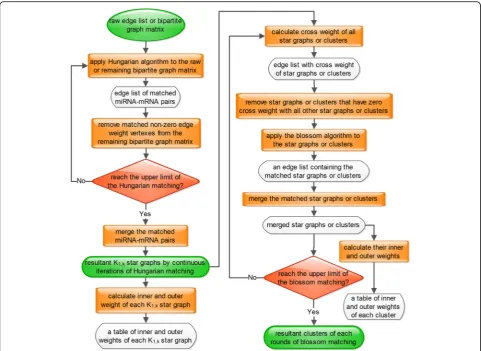
changes. Then, a maximum weighted merger method (MWMM) pipeline that consists of continuous iterations of Hungarian algorithm and several rounds of blossom algorithm was used to passively cluster the miRNA-mRNA pairs based on the maximum weighted edge matching in the bipartite graph and general graph. The clustered miRNA-mRNA pairs were validated mathem-atically by the clustering criteria that the inner weights of the clusters are larger than the outer weights of the clusters and biologically by the criteria that intra-clus-ter’s average GO term similarity distance scores are lar-ger than the inter-cluster’s. Then the genes in clusters were enriched via functional analysis like KEGG pathway or GO term. Finally, the effectiveness of MWMM was tested by applying the MWMM approach to other 14 cancer types and comparing to other six clustering algo-rithms in terms of GO term similarity distance scores. The methodology is illustrated in Fig.1.
Source data of BRCA from TCGA
The invasive breast carcinoma (BRCA) NGS expression data of miRNA and mRNA in tumor and in normal were downloaded from the TCGA data portal. BRCA data set has 863 samples consisting of 87 normal samples and 776 tumor samples. The number of samples in BRCA and other TCGA data sets used in this study are described in the first table in [18]. We processed the downloaded BRCA data set following the same proced-ure described in [20], and got four expression matrices across samples, including miRNA expression in tumor, miRNA expression in normal, mRNA expression in tumor, and mRNA expression in normal. The expression matrices involve 1046 miRNA and 20,531 mRNA in both tumor and normal samples. The row names of the expression matrices are miRNA names or gene names. The column names of the expression matrices are sam-ple names.
Edge-weighted bipartite graph model
A simple graph is defined asG= (V,E), whereV(G) orV denotes a set of vertices, andE(G) orEdenotes a set of edges.Eis 2-element subsets of V. An edge is associated with two vertices. w(e) is defined as edge weight for each edge. In this study, the miRNA-mRNA interaction net-work is visualized as an edge-weighted bipartite graph
G= (V, E), where Vconsists of vertices of mRNAs (VL)
and miRNAs (VR), i.e.,V= (VL+VR) and E represents
the weighted edges between the mRNA and miRNA ver-tices. Let i be the vertex subscript in theVL and j be the
vertex subscript in the VR. Then vivj is the connection
between vi and vj, namely the edge connecting a vertex
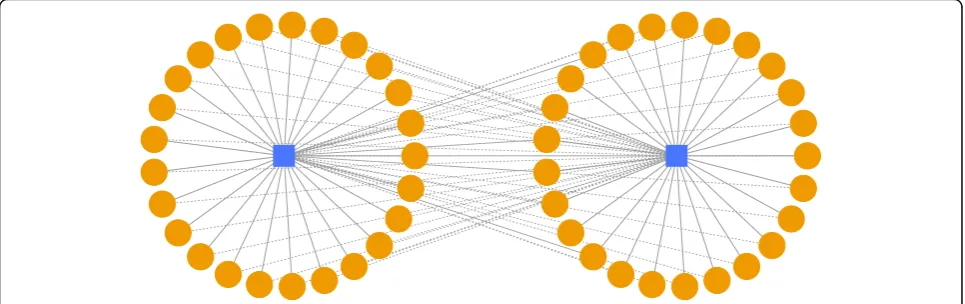
inVLto a vertex in VR. An example of a miRNA-mRNA
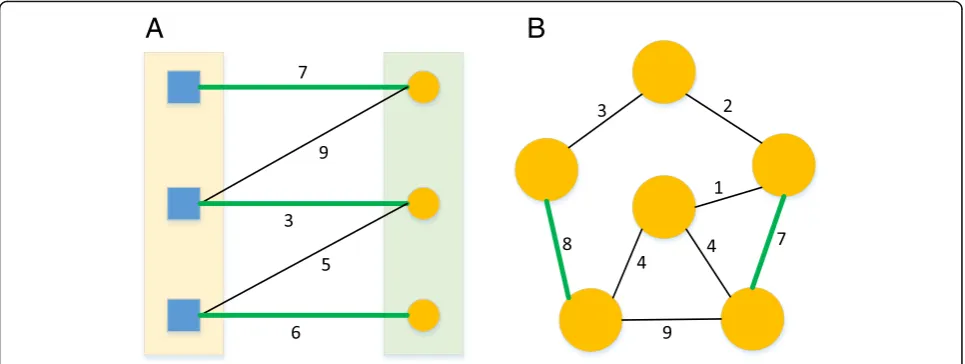
bipartite graph is shown in Fig.2. The edge list denoting the bipartite graph is shown in Table2.
Edge weight calculation
We combine T_CC and N_CC simultaneously to quantify the connections or weighted edges between miRNA and mRNA vertices. The connections reflect the intensity of inversion of miRNA-mRNA expression correlation
coefficients from in normal to in tumor. The formulas of calculating edge weights are described as follows.
We propose 6 types of edge weights that consider in-formation of T_CC and N_CC simultaneously to meas-ure the connection of the edgevivj, in the case of BRCA,
for 1≤i≤312 and 1≤j≤7874. Based on the foregoing three cutoff criteria, the number of selected miRNAs is 312 and the number of selected mRNAs is 7874.
The miRNA-mRNA expression correlation coefficients are separated into two classes based on their parity change, as shown in Fig.3. One class has N_CC > 0 and T_CC < 0, i.e., the correlation coefficients are converted from positive in normal to negative in tumor. The other class has N_ CC < 0 and T_CC > 0, i.e., the correlation coefficients are converted from negative in normal to positive in tumor.
Intuitively, the arithmetic mean of absolute values (ie., T_CC and N_CC) is an option to quantify the inversion of their expressional correlation coefficient, namely, in-version of N_CC to T_CC for a miRNA-mRNA pair as shown in Fig. 3. However, to increase the contrast of values in the data, a coefficient can be generated for each value by dividing that value by the arithmetic mean of the data. The value is then multiplied by its coeffi-cient, so that values larger than the arithmetic mean of the data will become larger, and values smaller than the arithmetic mean of the data will become smaller. Using notation, let the T_CC values have the arithmetic mean,
mT_CC. A specific T_CC value is denoted x, while mT CCx
is that value’s coefficient. The new value is given bymx
T CC
x, which enhances the importance of the valuexifxis greater than the average mT_CC, and weakens the
im-portance of the value x if x is smaller than the average
mT_CC.
In our expression correlation coefficient data, the T_ CC values consist of two groups: positive values and
negative values. We calculate the arithmetic mean of the positive values of T_CC as mþT CC and arithmetic mean of absolute value of the negative values of T_CC as
m−
T CC . Similarly, we calculate the mþN CC and m−N CC
for N_CC’s groups, as shown in Fig. 3. Then, the inte-grated mean value weight is calculated by assignments of coefficients λ1 and λ2, shown in Table 3. In such a
way, we can quantify the inversion of the correlation co-efficients from the positive values of N_CC, N_CC+, to the negative values of T_CC, T_CC− (λ1), and likewise,
from N_CC− to T_CC+(λ2) because these two sets
rep-resent different correlation change directions, as shown in Fig.3.
Table 1Calculated miRNA and mRNA expression expressional correlation coefficients in tumor and normal tissue of BRCA. The first 10 miRNA-mRNA pairs of the table that has 20,661 pairs are listed as an example
mRNA microRNA T_CC N_CC
OBFC1 hsa-mir-383 −0.092 0.271
SHROOM2 hsa-mir-130a −0.098 0.442
GABBR2 hsa-mir-452 0.142 −0.376
ZNF90 hsa-mir-452 0.139 −0.365
GIGYF1 hsa-mir-3653 −0.192 0.281
MICALL1 hsa-mir-375 −0.269 0.305
ZNF552 hsa-mir-30e −0.142 0.279
MT2A hsa-mir-744 −0.089 0.341
ISG20 hsa-mir-215 0.110 −0.373
PJA1 hsa-mir-204 0.205 −0.283
Fig. 2An example of a mRNA bipartite graph. The
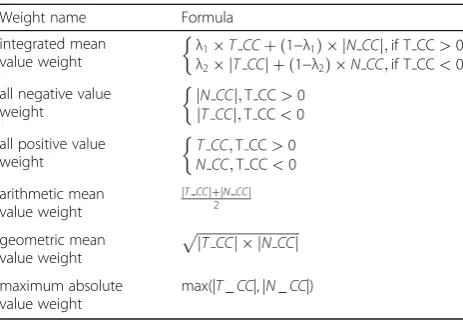
Based on the above-mentioned reasoning, we propose the formula of the integrated mean value weight to com-bine the T_CC and N_CC information simultaneously, as shown in Table3 and Table 4. For the sake of parison, we also propose other formulas that are com-mon in basic mathematics, listed in Table 4. For example, all negative value weight cannot reflect the cor-relation coefficient changes of a miRNA-mRNA pair in tumor relative to normal, but it can act as a random for-mula as a comparison to see if the proposed integrated mean value weight is random. Thereby, more possibil-ities exist beyond these six formulas.
For each miRNA-mRNA pair in every row of the input table exemplified in Table 1, we calculated their six dif-ferent weights. For example, the first row of the input table, the OBFC1 and hsa-mir-383 pair has TCC value− 0.092 and N_CC value 0.271. The six weights of the pair are 0.225, 0.092, 0.271, 0.182, 0.158 and 0.271, respect-ively using weight formulas in Table4.
Evaluation of six edge weight formulas by traditional hierarchical clustering algorithm
The traditional hierarchical clustering algorithm [24] was performed to evaluate six edge weight formulas. A particular clustering is not defined in the traditional hierarchical clustering algorithm. Instead, a sequence of clusters is given for researchers to interpret. To run the traditional hierarchical clustering algorithm on our bi-partite graph edge list, the original pseudocode in [24] is adapted and shown in Fig.4.
To cluster the miRNA-mRNA pairs using traditional hierarchical clustering algorithm, we subjectively run n steps, namely add top-n largest weighted edges to the empty graph to obtain a new graph with n edges. First, we initialize an empty bipartite graph. In each step, from the input table of edge list, we choose a miRNA-mRNA pair if its edge weight is currently the maximum edge weights, and then add the pair to the bipartite graph; the chosen pair is removed from the input table of edge list. The process is repeated n times. n is subjectively deter-mined by the user, rather than deterdeter-mined by a criterion inside the algorithm. Finally, there are n edges of miRNA-mRNA pair in the bipartite graph. The miRNA and mRNA vertices with weighed edges are visualized using igraph [25] and ggnet2 (https://briatte.github.io/ ggnet/) packages in R programming language.
The traditional hierarchical clustering algorithm can be used to evaluate six edge weight formulas. Given a specific threshold of number of edges, ie., steps, in the traditional hierarchical clustering, an edge weight for-mula that produces smaller number of disjoint clusters suggest that more high-weighted miRNA-mRNA inter-actions are clustered based on this formula, so this edge weight formula are considered better than other weight formulas. Thereby, the correlation between the con-nected cluster number and different edges/steps using different weight formulas is studied following the work-flow diagram in Fig.5. Based on the result part, the inte-grated mean value weight is now adopted in the sequel.
Table 2An example of edge list denoting a miRNA-mRNA bipartite graph. The edge list has three columns: miRNA vertex, mRNA vertex, and their edge weight. The pairs of miRNA-mRNA with the 10 largest integrated mean value weights (described in the next subsection) are listed as an example
mRNA microRNA weight
ASB8 hsa-mir-378 0.802
FYCO1 hsa-mir-378 0.773
CYB5R1 hsa-mir-378 0.772
TMEM143 hsa-mir-378 0.763
PHKA1 hsa-mir-944 0.759
MYOM3 hsa-mir-95 0.755
PDLIM3 hsa-mir-95 0.751
DCAF6 hsa-mir-944 0.749
ASB14 hsa-mir-378 0.747
PHTF2 hsa-mir-944 0.744
Fig. 3Definition of means of four subsets in T_CC and N_CC. The red arrows denote that the correlation coefficients are converted from negative in normal to positive in tumor. The green arrows denote that the correlation coefficients are converted from positive in normal to negative in tumor
Table 3Coefficient of correlation coefficient in the integrated mean value weight formula
λ1¼ m
þ
T CC mþ
T CCþm−N CC
1−λ1¼ m
−
N CC mþ
T CCþm−N CC
λ2¼ m
−
T CC m−
T CCþmþN CC 1−λ2¼
mþ
N CC m−
The traditional hierarchical clustering algorithm can actively, not passively, cluster the miRNA-mRNA pairs and also can filter the top-weighted edges in the graph, because only the top weighted, namely important, edges are added to the graph. In the meantime, the smaller weight edges, which might also have biological roles are ignored. To solve this issue, we proposed an objective maximum weighted merger method (MWMM) ap-proach that also clusters smaller weight edges and tries to achieve the global optimum instead of only clustering top-weighted edges. Thereby, traditional hierarchical clustering algorithm was only used to evaluate six edge weight formulas in this study.
Graph partitioning of the bipartite graphs
Partitioning the graphGconsists of dividing the vertices into clusters, such that the total weight of the edges
whose end points are in different clusters is minimized. The objective of this kind of partitioning is to minimize the cut, i.e. the total weight of the edges crossing the clusters. This is equivalent to maximizing the total weight of the edges that are inside the clusters [26].
In general, a graph’s vertex set V(G) may be partitioned into c disjoint parts, V1, V2,…, Vc, such that V = V1∪V2∪V3 …∪Vc. Such parts may be referred to as subgraphs,
parti-tions, or communities, but they shall be referred to as clus-ters in this discussion. A cluster, with more weighted connections inside and fewer weighted connections to other clusters, indicates that the members of a cluster are more similar or linked to each other than those in the por-tions of the graph outside that cluster [27]. The partitioning is illustrated in Fig.6.
Hungarian and blossom algorithm matching in graph theory
A matching in graph theory is defined as a subset of edges such that none of the edges in the subset shares a common vertex. A maximum edge-weighted matching is a matching where the weight sum of the matched edges is as large as possible. In other words, we seek a perfect matchingM to maximize the total weightw(M) =∑e∈Mw(e).
The Hungarian algorithm is a combinatorial optimization algorithm used to solve the assignment problem. For example, if the performance of each of n people on each of n jobs is scored numerically, the as-signment problem tries to assign people to jobs to make the sum of the scores as large as possible [28]. A tiny ex-ample of Hungarian algorithm is drawn in Fig.7.
The Blossom Algorithm is an algorithm for finding the maximum matching in a general graph through
Table 4Formulas of six proposed weights to quantify the T_CC and N_CC simultaneously
Weight name Formula
integrated mean
value weight λ
1T CCþ ð1−λ1Þ jN CCj;if T CC>0 λ2 jT CCj þ ð1−λ2Þ N CC;if T CC<0
all negative value
weight jN CCj;
T CC>0 jT CCj;T CC<0
all positive value
weight T CC;
T CC>0 N CC;T CC<0
arithmetic mean value weight
jT CCjþjN CCj 2
geometric mean value weight
ffiffiffiffiffiffiffiffiffiffiffiffiffiffiffiffiffiffiffiffiffiffiffiffiffiffiffiffiffiffiffi jT CCj jN CCj p
maximum absolute value weight
max(|T_CC|, |N_CC|)
Fig. 5The workflow of the traditional hierarchical clustering algorithm that cluster the miRNA-mRNA pairs based on the edge weights derived from the different formulas
shrinking cycles in the graph to reveal augmenting paths. The Blossom Algorithm is used to solve assignment problem, traveling salesman problem, etc. Given a gen-eral graph G= (V, E), the Blossom algorithm finds a matching M such that each vertex inV is incident with at most one edge in M and the edge weight w(M) is maximized [29]. A tiny example of blossom algorithm is drawn in Fig.7.
MWMM procedure
The maximum weighted merger method consists of two major stages. First, MWMM implements Hungarian algo-rithm to find maximum edge-weighted matchings in bipart-ite graphs. We bipart-iteratively constructed and combined maximum edge–weighted matchings via the Hungarian al-gorithm to produce disjointed star graphs, labeled from K1,1to K1,k. Second, MWMM implements the Blossom
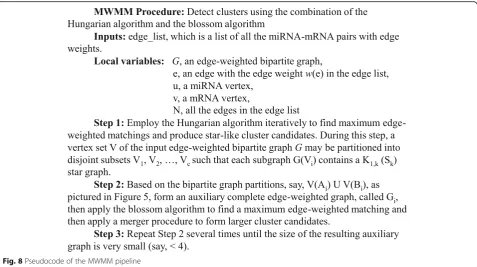
al-gorithm to find maximum edge-weighted matchings in general graphs. We iteratively merge the initialized dis-jointed stars derived from the continuous iteration of Hun-garian algorithm to form new edge–weighted clusters. The pseudocode of the MWMM pipeline is described in Fig.8. The workflow of MWMM pipeline is depicted in Fig.9.
Taken together, taking an edge list of edge-weighted bipartite graph, MWMM approach partition it into clus-ters that have higher internal connection density inside a cluster and lower external connection density outside the cluster. In other words, inner weights of a valid clus-ter should be greaclus-ter than or equal to its ouclus-ter weights. This clustering criterion is passive and objective to evaluate the quality of resulting clusters. This passive evaluation approach is different from, and better than, the subjective judgement of the cluster in the traditional
hierarchical clustering approach:“clusters are in the eyes of the beholder”.
Application of Hungarian algorithm
The Hungarian algorithm takes input of a bipartite graph matrix that has miRNAs as row names, mRNAs as column names, and edge weights as entries. This raw bipartite graph matrix is converted from the raw edge list exemplified in Table2.
After applying each round of the Hungarian algorithm, we get an edge list of matched miRNAs and mRNAs. We remove the matched zero edge weight miRNA-mRNA pairs from the matched pairs so that the miR-NAs or mRmiR-NAs in the zero edge weight matched pairs can participate in the next round of Hungarian algo-rithm to match their non-zero edge weight miRNA or mRNA mates, instead of being discarded. In other words, the matched zero edge weight miRNA-mRNA pairs are still in the remaining bipartite matrix for the next round of Hungarian algorithm. The matched, non-zero edge weight mRNA and miRNA pairs are used to construct star graphs shown in Fig.10.
Before the next round of Hungarian algorithm applica-tion, the columns of matched mRNAs are removed from the remaining bipartite graph matrix, whereas the rows of matched miRNAs are usually not removed from the remaining bipartite graph matrix. However, miRNAs that have zero edge weight with all mRNAs are removed from the remaining bipartite graph matrix, when each miRNA row of the remaining bipartite graph matrix is checked before the next round of Hungarian algorithm. Since these miRNAs has been matched and stored in the internal nodes of star graphs, keeping these used
A
B
miRNAs in the remaining bipartite graph matrix make the Hungarian algorithm hard to match perfectly. Fin-ishing these processing, the next round of the Hungarian algorithm was applied to the updated remaining bipart-ite graph matrix.
This Hungarian algorithm was repeated until all the miRNAs and mRNAs are removed from the remaining bipartite graph matrix. Eventually, the Hungarian algo-rithm merging process yields 312 K1,k (Sk) star graphs.
The Hungarian algorithm implementation is provided by clue [30] package in R programming language.
Star graph construction by the Hungarian algorithm
In graph theory, a star (graph) is a complete bipartite graph that has 1 internal node and k leaves, and accordingly the star graph is named K1,kstar or Sk. Note that there are 312
miRNAs and 7874 mRNAs in the raw bipartite graph. Since one miRNA can target multiple mRNAs, after continuous iterations of the Hungarian algorithm, we derived 312 merged star graphs. To facilitate programming, disjoint K1,k
star graphs are stored in communities object in igraph ob-jects in R programming language. The star graph construc-tion process is illustrated in Fig.10.
Cross weight of vertices denoting clusters in the auxiliary graph
The 312 star graphs constructed by Hungarian algorithm are initial clusters that will be merged to form new clus-ters. Then the blossom algorithm is used to combine these star graphs or clusters. An edge-weighted auxiliary
graph with 312 vertices denoting star graphs or clusters is formed by contracting each star graphs or (merged) clusters of miRNAs and mRNAs to a vertex in the auxil-iary graph. For instance, we contract clusters Ci-1, Ci, Cj,
and Cj + 1 in Fig. 6 to vertices Ci-1, Ci, Cj, and Cj + 1. in
the auxiliary graph. The auxiliary graph is illustrated in Fig.11.
Cross weight is defined as the sum of the weights of the connections between two star graphs or clusters av-eraged by the number of vertices in the two star graphs or clusters. Averaging prevents larger clusters to be merged preferentially only because they are large. The connections consist of two scenarios. First, the miR-NA(s) in a star graph/cluster has existing connections to the mRNA(s) in the other star graph/cluster. Second, the mRNA(s) in a star graph/cluster has existing connec-tions to the miRNA(s) in the other star graph/cluster. The mathematical meaning of the cross weight is to de-tect the compounded connections between every two cluster candidates. An example diagram of a cross weight calculation for two disjoint K1,25(S25) star graphs
is shown in Fig.12.
Then the cross weight of vertices denoting clusters or star graphs in the auxiliary graph are calculated before each round of the blossom algorithm. The calculated cross weights are assembled into an edge list with vertex names of star graphs or clusters as first two column names and cross weights as the third column name. If a row of cross weight edge list has zero value cross weight, the row of the two star graphs or clusters is discarded.
Fig. 9Workflow of the Hungarian-blossom clustering approach. The Hungarian algorithm stops when all the miRNA-mRNA pairs are assigned to star graphs. The blossom algorithm stops when there are at most two or three partitioning parts left. As a result, original partitions produced by Hungarian algorithm are eventually merged to several partitions by blossom algorithm
Fig. 10Illustrated example of constructing star-graphs. The miRNA is the internal node (denoted by a square) of a star graph and the mRNA is the leaf (denoted by a circle) of a star graph. After the first round application of the Hungarian algorithm, disjoint K1,1stars (S1) are produced.
After the second round application of the Hungarian algorithm, disjoint K1,2stars (S2) are formed. The internal node of each K1,2star (S2) is the
same as each corresponding K1,1star (S1), respectively. One of the leaves of each K1,2star (S2) is derived from each corresponding K1,1star (S1),
respectively. After the third iteration of Hungarian algorithm, disjoint K1,3stars (S3) are produced. The internal node of each K1,3star (S3) is the
same as the corresponding K1,1star (S1) and K1,2star (S2), respectively. Two of the leaves of each K1,3star (S3) are derived from the corresponding
The edge list of non-zero cross weight is the input of each iteration of the blossom algorithm.
The blossom algorithm for merging partitions
Taking the edge list of cross weight of 312 K1,k(Sk) star
graphs as initial input, the blossom algorithm is repeat-edly applied to match and merge clusters. After applying each round of the the blossom algorithm to the cross weight edge list, the maximum edge-weighted matching of vertices of clusters in the auxiliary graph is found. If there is no match for some star gaphs or clusters, those
star graphs or clusters are put aside and not used in the next round of the blossom algorithm. Then, every two matched star graphs or clusters are merged to form new clusters. Cross weights of every two newly merged clus-ters are calculated for the next round of blossom algo-rithm. Then the blossom algorithm is repeatedly applied to the edge list of cross weight of vertices of clusters in newly formed auxiliary graph. The output of each round of blossom is a communities object in R programming language containing merged star graphs or clusters. The blossom algorithm was implemented using NetworkX package [31] in Python programming language.
Evaluation of six edge weight formulas by MWMM
As for the six different edge weight formulas, it would be interesting to check how different the obtained final partitions are. If the traditional clustering algorithm is used to see the final partitions, all the edges will be added to the graph, and thereby, the final partitions of six edge weights formula would be identical. Further-more, the final partition will have 20,661 edges in the case of BRCA such that the graph would be indistin-guishable. Instead, certain number of edges/steps, say, 38 edges/steps, can be used to compare the resultant partitions of traditional hierarchical clustering algorithm. However, the partitions from six different edge weight formula might have different number of nodes. Thereby it is hard to use the global evaluation metrics such as the adjusted rand index to compare the similarity of the partitions. The adjusted Rand index (ARI) can be used to measure the similarity of the two communities of clusters. ARI needs the knowledge of the ground truth classes, which is not available in real data set or requires manual annotation such as in the supervised learning (https://scikit-learn.org/stable/modules/clustering.html). The ARI has a value close to 0.0 for random labeling inde-pendently on the number of clusters and samples and has
Fig. 11An illustration of four example vertices of Ci-1, Ci, Cj, and Cj + 1
in the auxiliary graph. Each vertex in the auxiliary graph is a (merged) cluster of miRNAs and mRNAs. The edge weights among vertices are measured by cross weights described later. The solid lines denote the connections among the four example vertices in the auxiliary graph. The likely connections between example vertices and other vertices in the auxiliary graph is represented by dotted lines
Fig. 12Example diagram of a cross weight calculation for two disjoint K1,25star graphs (S25). The dashed lines denote the cross connections
a value exactly 1.0 when the clusters are identical (https:// scikit-learn.org/stable/modules/generated/sklearn.metrics. adjusted_rand_score.html) [32]. So in this study the ARI cannot be used to tell whether the predicted clusters are similar to the true clusters. But ARI can be used to com-pare the similarity of resultant clusters of six weight edge formulas produced by the MWMM pipeline.
Results
Evaluation of the six kinds of edge weights by traditional hierarchical clustering algorithm
The traditional hierarchical clustering algorithm can subjectively cluster the miRNA-mRNA pairs by filtering the top-weighted edges in the graph. It can also be used to evaluate the proposed six edge weight formulas. We calculated the six kinds of edge weights and output the results as the edge list with miRNA node, mRNA node, and their edge weight, as is shown in Fig.2and Table2. Then we ran the traditional clustering algorithm to clus-ter the miRNA-mRNA pairs based on six proposed edge weights.
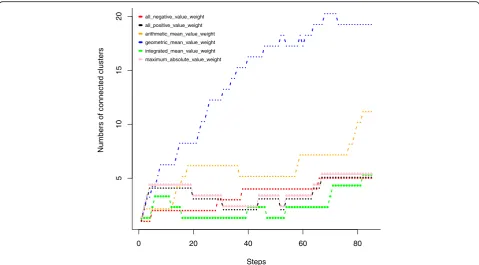
Given a specific number of steps in the traditional hierarchical clustering, smaller number of disjoint clus-ters suggest that more high-weighted miRNA-mRNA in-teractions are clustered. If the miRNA-mRNA pairs with large edge weights fall into more disjoint small clusters, there will be a larger number of disjoint clusters, which suggest that there is no coordinated interaction within
the clusters. From Fig.13, we can see that under most of the step values, the integrated mean value weight has the fewest disjoint clusters and thereby is the preferable formula in this study. Although we chose the integrated mean value weight formula, researchers facing different data can still propose other formulas. These formulas should simultaneously combine the miRNA-mRNA
Fig. 13numbers of connected or disjoint clusters derived from traditional hierarchical clustering algorithm with different steps n under six edge weight formulas. The step value n is the number of the top weighted edges added to the bipartite graph
expressional correlation coefficient changes from in nor-mal to in tumor.
Traditional hierarchical clustering algorithm on top integrated mean value weight edges
Since we chose integrated mean value weight to quantify the correlation change as edge weight of the miRNA-mRNA bipartite graph thereafter, we wanted to see how the clusters derived from traditional hierarchical cluster-ing algorithm look like. Since traditional hierarchical clustering algorithm selects the top weighted edges sub-jectively by users’setting, it is sensible to get a threshold of edge number. Therefore, we plot a histogram to show
the distribution of integrated mean value weight in Fig.14. From Fig.14, we can see that there are 38 edge weights greater than 0.7, so we subjectively ran 38 steps of traditional hierarchical clustering algorithm on the miRNA-mRNA pairs with the integrated mean value weights. In other words, we selected the top 38 edge-weighted miRNA-mRNA pairs to form a new bipartite graph that is shown in Fig. 15. As a comparison, top 38 edge-weighted miRNA-mRNA pairs of all six edge weight formulas clustered by traditional hierarchical clustering algorithm are provided in Additional file1
From Fig. 15, we can see that using the integrated mean value weight, the top 38 weighted edges are all
Fig. 15The traditional hierarchical clustering resultant sub-bipartite graphs run with 38 steps based on the integrated mean value weight. The numbers on the edges are edge weights of the integrated mean value weight. A green edge denotes the correlation coefficient change from positive in normal to negative in tumor. A red edge denotes the correlation coefficient change from negative in normal to positive in tumor. The circular vertices are mRNA and the rectangular vertices are miRNA
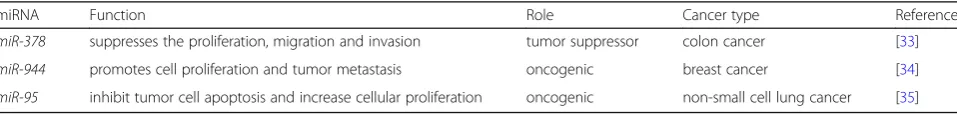
Table 5Functions of the three most enriched miRNAs in the literature
miRNA Function Role Cancer type Reference
green color, which means that in tumor all the three miRNAs inhibit the target mRNAs whereas in normal all these miRNAs are positively correlated with their tar-get mRNAs. Larger weights are supposed to represent the bigger correlation inversion from normal to tumor. The same correlation change direction suggests that these miRNA and mRNAs are likely to be affected by the common causal factors and that the miRNAs playing suppressive roles to their target mRNAs is a characteris-tics of the cancer development.
Literature spot-checks of the most enriched miRNAs
To study function of the three most enriched miRNAs based on the integrated mean weight edge shown in Fig.
15, we looked up these miRNAs in the literature. We found that all three miRNAs are functionally related to cancer [33–35]. Their functions are listed in Table5
Apply MWMM pipeline in BRCA
The whole MWMM pipeline first calculates edge weights from table of edge list of miRNA-mRNA pairs
Table 6Similarities of communities structures of clusters derived from six edge weight formulas using Hungarian algorithm in the MWMM pipeline. All combinations of every two edge weight formulas are listed. Their similarity score of ARI are calculated
from to ARI
all_negative_value_weight all_positive_value_weight 0.025
all_negative_value_weight arithmetic_mean_value_weight 0.022
all_negative_value_weight geometric_mean_value_weight 0.027
all_negative_value_weight integrated_mean_value_weight 0.027
all_negative_value_weight maximum_absolute_value_weight 0.026
all_positive_value_weight arithmetic_mean_value_weight 0.03
all_positive_value_weight geometric_mean_value_weight 0.037
all_positive_value_weight integrated_mean_value_weight 0.036
all_positive_value_weight maximum_absolute_value_weight 0.039
arithmetic_mean_value_weight geometric_mean_value_weight 0.04
arithmetic_mean_value_weight integrated_mean_value_weight 0.062
arithmetic_mean_value_weight maximum_absolute_value_weight 0.046
geometric_mean_value_weight integrated_mean_value_weight 0.03
geometric_mean_value_weight maximum_absolute_value_weight 0.036
integrated_mean_value_weight maximum_absolute_value_weight 0.088
Table 7Similarities of communities structures of clusters derived from six edge weight formulas using blossom 01 in the MWMM pipeline. All combinations of every two edge weight formulas are listed. Their similarity score of ARI are calculated
from to ARI
all_negative_value_weight all_positive_value_weight 0.526
all_negative_value_weight arithmetic_mean_value_weight 0.527
all_negative_value_weight geometric_mean_value_weight 0.551
all_negative_value_weight integrated_mean_value_weight 0.557
all_negative_value_weight maximum_absolute_value_weight 0.531
all_positive_value_weight arithmetic_mean_value_weight 0.541
all_positive_value_weight geometric_mean_value_weight 0.565
all_positive_value_weight integrated_mean_value_weight 0.511
all_positive_value_weight maximum_absolute_value_weight 0.58
arithmetic_mean_value_weight geometric_mean_value_weight 0.542
arithmetic_mean_value_weight integrated_mean_value_weight 0.5
arithmetic_mean_value_weight maximum_absolute_value_weight 0.541
geometric_mean_value_weight integrated_mean_value_weight 0.58
geometric_mean_value_weight maximum_absolute_value_weight 0.545
with their expression T_CC and N_CC, exemplified in Table1. The calculated edge weights of integrated mean value weight are exemplified in Table 2. The raw edge list contains 20,661 pairs of miRNA and mRNAs, includ-ing 312 unique miRNAs and 7874 unique mRNAs. This raw edge list is converted to raw bipartite graph matrix for the Hungarian algorithm to run on. The number of Hungarian algorithm iterations is 202 rounds. The mer-ging process yields 312 K1,k (Sk) star graphs, from which
the blossom algorithm is repeatedly applied to match and merge clusters. The blossom algorithm run 8 times to eventually merge 312 starting star graphs or clusters into a single cluster. One single cluster doesn’t make sense for the purpose of clustering, but the clusters of
last iteration of Hungarian algorithm and each round of blossom algorithm are output to communities objects in R programming language. Users can use mathematical and biological metrics to select clusters derived from Hungarian algorithm or from first several rounds of blossom algorithm to achieve the trade-off between clus-ter size and clusclus-ter number.
Evaluation of six edge weight formulas by MWMM
To see the effects of six different edge weight formulas, ARI was used to compare the similarity of resultant clus-ters based on six weight edge formulas produced by MWMM pipeline. MWMM started with six different edge weight formulas and produced six communities structures of clusters, respectively. Communities is a structure in igraph package in R programming language to represent clusters. We compared similarity of two communities structures of clusters derived from every two different edge weight formulas using ARI. The com-munities structures of clusters produced by Hungarian algorithm and blossom 01 of the MWMM approach were shown as examples in Tables6 and7, respectively, to tell whether different edge weight formulas lead to different communities structures. From Tables 6 and 7, we found that the communities structure of clusters de-rived from every two edge weight formulas using Hun-garian or blossom algorithm 01 were very similar,
Table 8definition of three different weights for a given cluster candidate Ci
Notation Abbreviation the sum of edge-weight
connections
inner weight IW between miRNAs and mRNAs
within a cluster candidate Ci
emitter to matched receiver outer weight
E2MROW from miRNAs in the cluster candidate Cito mRNAs in all other cluster candidates Cjwhere j≠i
receiver to matched emitter outer weight
R2MEOW from mRNAs in the cluster candidate Cito miRNAs in all other cluster candidates Cjwhere j≠i
Fig. 16The diagram of inner weight and outer weight of a given cluster Ci. The outer weights are classified into two categories: emitter to matched
because their ARI values are in the same order of magni-tude The overall similarity using blossom 01 is higher than that using Hungarian algorithm, perhaps because the blossom algorithm merge the clusters generated from Hungarian algorithm, and thereby the communities structures of clusters are more similar using blossom al-gorithm than these using Hungarian alal-gorithm. Since ARI only compares clusters based on their topological structures, ignoring their edge weights, ARI is not a suit-able metrics to select a good edge weight formula, whereas traditional hierarchical clustering algorithm did the job.
Mathematical metrics of MWMM-derived clusters
A well-partitioned cluster should have more weighted connections inside the cluster and fewer weighted con-nections to any other outside clusters, so that the mem-bers of the cluster are more similar or linked to each other than to the members of other outside clusters. This characteristics of clusters leads to the clustering metrics used in this study. We define three weight nota-tions to describe the connecnota-tions between the micro-RNA (emitter) and mmicro-RNA (receiver) within and across clusters to measure the inner weight and outer weight of clusters generated by the Hungarian algorithm and the
blossom algorithm. The three definitions are listed in Table 8. The diagram of the calculation of inner and outer weights are portrayed in Fig.16.
Accordingly, we propose two conditions to validate the mathematical significance of a candidate cluster Ci.
Condition one specifies IW > E2MROW. Condition two specifies 2 × IW > E2MROW + R2MEOW. It is note-worthy that in the condition two the inner weight should be doubled, because the condition two’s outer weights measure the connections from miRNAs inside a cluster to mRNAs outside that cluster as well as the mRNAs inside that cluster to the miRNAs outside that cluster; correspondingly, the inner weight of a cluster should also be measured twice to characterize the con-nections from miRNAs inside a cluster to mRNAs inside that cluster as well as from mRNAs inside that cluster to miRNAs inside that cluster. The difference of meeting condition one and condition two may result from that condition one is based on only the miRNA side, whereas condition two is based on both miRNA and mRNA sides. Condition one is less stringent than condition two, because condition one only compares the inner and the outer connections to the miRNAs inside a cluster, whereas condition two compares the inner and the outer connections to both miRNAs and mRNAs inside a
cluster. Therefore, condition one is easily met by fewer rounds of merging algorithm.
The whole MWMM procedure consists of continuous iterations of the Hungarian algorithm and several rounds of the Blossom algorithm. The MWMM procedure tries to merge existing clusters to generate new clusters that have greater inner weight than the outer weight, seen in Fig.17. If we keep merging, eventually there will be one or several very dense clusters, which have small outer weight. Thereby, we need to make a trade–off between the sizes and density of the clusters. In other words, we want denser clusters with proper sizes.
From Fig. 17, we can see that continuous application of the Hungarian algorithm produces 312 star graphs. Afterwards, using eight rounds of application of Blossom algorithm. The 312 star graphs/clusters are merged to one cluster round by round. The merger effects are evaluated by the above-mentioned condition one and condition two. We can see that as more rounds of merging algorithm are applied, the number of clusters first decreases dramatically
and then tends to be stable; the clusters of different sizes satisfying condition one and/or condition two are pro-duced by the MWMM procedures and the percent of clusters that meets the condition one (IW > E2MROW) and condition two (2 × IW > E2MROW + R2MEOW) gradually increases to 100% and becomes stable. The de-tailed metrics of the final clusters defined in Table8 are provided in Additional file2.
Kyoto encyclopedia of genes and genomes (KEGG) analysis of the clustering results
KEGG function analysis shows the biological significance of genes that are potentially regulated by miRNAs in the derived clusters. The biological factors enriched in the clusters provide a new viewpoint on how mRNA–miRNA pairs contribute to cancers. Functional analysis of genes in clusters is implemented using clusterProfiler, an R package for comparing biological themes among gene clusters [36]. For example, in Fig.18, we analyze 312 clusters de-rived from the Hungarian algorithm result and get 22
clusters enriched in KEGG pathways with pvalueCutoff = 0.01 and qvalueCutoff = 0.05. For example, genes in 189th cluster are enriched in cell cycle, p53 signaling pathway, progesterone−mediated oocyte maturation, and oocyte meiosis, suggesting the theme of the genes in the cluster related to cancer. The members of 189th cluster (star graph) are visualized in Fig. 19, where the internal node miRNA hsa-mir-379 is reported to be a tumor suppressor playing a role in inhibiting cell proliferation, migration, and invasion in breast cancer [38], cervical cancer [39], glioma [40], non-small cell lung cancer [41], bladder cancer [42], osteosarcoma [43], hepatocellular carcinoma [44], gastric cancer [45]. The genes interacting with hsa-mir-379 in the cluster is worth further experimental exploration, for example, CCNB1, MCM4, CCNB2, and
CDK1that are involved in cell cycle.
Clustering method comparison
To see if our MWMM approach surpasses existing clus-tering methods, we need to conduct performance
comparisons. Which clustering approaches are suitable for comparison? First, the MWMM method is a down-stream analysis approach taking certain input format, an edge list with miRNA vertex name, mRNA vertex name, and their edge weight. The integrated mean value weight characterizes the correlation change in two conditions. Therefore, the clustering approaches that only consider one condition like MAGIA2 or miRMAP are not com-parable to the MWMM. Second, other known clustering algorithm might not fit the data structure of bipartite graph in a form of edge list. For example, in a study using time course mRNA microarray data, a non-linear primary component analysis (PCA) neural network was used to extract the feature vector that was afterwards fed into a probabilistic principal surfaces (PPS) model to find and visualize latent variables or clusters of genes that were afterwards merged by an agglomerative clus-tering algorithm based on negentropy information. This negentropy clustering (NEC) algorithm can automatic-ally determine the cluster of numbers [46], so it is better
than the traditional hierarchical clustering algorithm that needs subjective determination of the cluster number. However, this study concentrates in the miRNA-mRNA interactions, in which a bipartite graph is constructed, so the clustering approaches like PPS-NEC [46], k-means [47], or WGCNA [48] that have been used to find gene expression“modules”or clusters are unsuitable for com-parison. Third, the miRNA-mRNA interaction bipartite graph is not a connected graph, and thereby, some clus-tering algorithms like minimum spanning tree cannot be applied. Considering the above-mentioned constraints, we choose louvain, fast_greedy, walktrap, leading_eigen, label_propagation, and edge_betweenness to compare with the MWMM approach. Implementations of these clustering approaches are derived from igraph package in R programming language.
The biological validation would benefit from a system-atic methodology in addition to literature spot-checks. Thereby, we biologically validate the derived clusters by calculating their average Gene Ontology (GO) term
similarity distance scores. The GO similarity scores would give an idea of how the genes within a cluster or across clusters are functionally related or similar. Based on the definition of clustering, elements within a cluster are more similar or linked than the elements among clusters in some traits, for example, GO term similarity. Thereby, clusters identified by a good clustering algorithm should have higher intra-cluster GO similarity distance scores and lower inter-cluster GO similarity distance scores. In other words, the difference between intra-cluster GO similarity score and inter-cluster GO similarity score should be higher for a good clustering algorithm.
To compare and evaluate clusters generated by differ-ent clustering algorithms in BRCA, the GO similarity distance scores of genes in the clusters are calculated using GOSemSim, an R package for measuring semantic similarity among GO terms and gene products [49]. GO similarity distance score is calculated in three categories of GO terms: molecular function (MF) describing mo-lecular activities of gene products, cellular component
(CC) describing where gene products are active, and bio-logical process (BP) describing pathways and larger pro-cesses made up of the activities of multiple gene products. From Figs. 20, 21, and 22, we can see that compared to other algorithms, the Hungarians or Blos-som algorithm 01 have relatively higher intra-cluster similarity and relatively lower inter-cluster similarity in all three GO term categories. This result shows the ad-vantage of MWMM approach over other approaches in biological meaning.
Besides comparison with different methods like Louvain, fast_greedy, walktrap, leading_eigen, label_propagation, and edge_betweenness algorithms in terms of GO terms, a mathematical comparison in term of strength of the connection inside the cluster and outside the clusters is also meaningful. So we calculated the inner weight and outer weight and conditions defined in Table 8 for the MWMM pipeline and other compared algorithms. Differ-ent algorithms produced differDiffer-ent number of clusters in the resultant communities structures. To summarize, the IW, E2MROW, and R2MEOW of clusters produced using
each algorithm were averaged, and the percent of how many clusters produced using each algorithm meet condi-tion 01 or 02 were also calculated, respectively. The result summary is listed in Table 9. From Table 9, we can see that louvain, fast_greedy, and leading_eigen algorithms yielded clusters with the larger inner weights relative to outer weights and high percent of condition 01 and 02 sat-isfaction. By comparison, the Hungarian and blossom al-gorithms in the MWMM approach at the beginning did not produce clusters with the larger inner weights relative to outer weights and high percent of condition 01 and 02 satisfaction, however, as the merger process went on in the MWMM, the Hungarian and blossom algorithms in the MWMM approach gradually generated clusters with the larger inner weights relative to outer weights and high percent of condition 01 and 02 satisfaction. These phenomena comply with expectations, because all the clustering algorithms try to make clusters based on math-ematical criteria, while clusters are defined as inner con-nections or similarities greater than the outer concon-nections or similarities.
The running speed of different algorithms were com-pared by running on the same data set: the edge list of miRNA and mRNAs with integrated mean value edge weight from BRCA. The running time was recorded re-spectively and listed in Table10. From Table10, we can see that the label-propagation, Louvain, fast_greedy, leading_eigen, and walkstrap algorithms are fast. Our hungagrian_blossom (MWMM) approach is acceptable. Edge_betweenness algorithm is slow.
Clustering algorithm validation on test data sets
The MWMM approach is developed using BRCA as train-ing data set. Can this approach also applied to some test data sets and achieve similar clustering results in terms of mathematical cluster traits and biological meaning? To answer this question, we ran MWMM approach and other six foregoing clustering algorithms on other 14 cancer types: Bladder Urothelial Carcinoma (BLCA), Colon adenocarcinoma (COAD), Esophageal carcinoma (ESCA), Head and Neck squamous cell carcinoma (HNSC), Kidney
Chromophobe (KICH), Kidney renal clear cell carcinoma (KIRC), Kidney renal papillary cell carcinoma (KIRP), Liver hepatocellular carcinoma (LIHC), Lung adenocar-cinoma (LUAD), Lung squamous cell caradenocar-cinoma (LUSC), Prostate adenocarcinoma (PRAD), Stomach adenocar-cinoma (STAD), Thyroid caradenocar-cinoma (THCA), and Uterine Corpus Endometrial Carcinoma (UCEC). Similar to BRCA, the input table of the 14 cancer types exemplified in Table 1 were derived from results of our previous study [18].
We find that similar to in BRCA the MWMM can also detect clusters that has internal weights greater than or equal to external weights in the test data sets of 14 can-cer types. Graph of inner weights, outer weights, and cluster sizes of KIRP is drawn in Fig.23 as an example. Graphs of other 13 cancer types are supplied in Additional file3.
We also tried to find out whether the MWMM ap-proach can cluster miRNAs and mRNAs such that the difference between intra-cluster and inter-cluster average
GO similarity distance score is relatively larger com-pared to other algorithm results. The clustering algo-rithms that obtain the highest differences between intra-cluster and inter-intra-cluster average GO similarity distance score in each GO term category in each cancer type are summarized in Table 11. We can see that in MWMM has the best GO metrics in terms of BP in 11 out of 15 cancer types, CC in 13 out of cancer types, and MF in 14 out of 15 cancer types. The results suggest that the MWMM are also effective in other cancer types, though it is not always the best. The supporting materials for Table11are provided in Additional file4.
Discussion
There are some miRNA-mRNA clustering studies, how-ever, these studies did not focus on the expression cor-relation coefficient changes of miRNA-mRNA pairs that are inverse from in normal to in tumor. The miRNAs
and mRNAs can be clustered based on their expression correlation coefficient changes under the assumption that the changes are not random but caused by factors involved in cancer development. Hence, we tried to cap-ture and cluster these miRNA-mRNA interactions.
To simultaneously quantify the changes, we proposed integrated mean value weight that increases the contrast of values in the data as well as other five edge weight formula as comparison or control. Then the subjective traditional hierarchical clustering algorithm was used to evaluate the advantages of different edge weight formu-las. After evaluation, integrated mean value weight was favored because it can produce more connected clusters at certain steps. We did not just use the traditional hier-archical clustering algorithm only to cluster miRNA and mRNA pairs in this study; instead, we only use it as a tool to evaluate the edge weight formulas. This is because traditional hierarchical clustering algorithm is subjective and thereby makes the researchers feel diffi-cult to determine the cluster number. Furthermore, trad-itional hierarchical clustering algorithm only cluster the top miRNA-mRNA pairs, and thereby it doesn’t reach a global optimal clustering that should also involve the low edge weight miRNA-mRNA pairs. To get around these limitations, we proposed the maximum weighted merger method (MWMM) pipeline.
The MWMM pipeline includes continuous iterations of Hungarian algorithm and several rounds of blossom algorithm. MWMM pipeline passively clusters miRNA-mRNA pairs using maximum weighted edge matching in the bipartite graph and general graph. Based on the GO similarity results, the Hungarian algorithm or blossom
Table 9Average inner weight and outer weights of clusters produced using each algorithm and how many percent of clusters meet the conditions
Average IW Average E2MROW Average R2MEOW Condition 01 true percent Condition 02 true percent
hungarian_algorithm 0.243 0.249 0.589 63.14% 16.99%
blossom_01 0.282 0.296 0.552 62.75% 15.69%
blossom_02 0.305 0.303 0.513 59.21% 23.68%
blossom_03 0.331 0.295 0.477 68.42% 28.95%
blossom_04 0.366 0.288 0.42 78.95% 42.11%
blossom_05 0.42 0.268 0.346 100.00% 66.67%
blossom_06 0.508 0.193 0.223 100.00% 100.00%
blossom_07 0.598 0.126 0.127 100.00% 100.00%
blossom_08 0.725 0 0 100.00% 100.00%
fast_greedy 0.289 0.14 0.141 86.36% 95.45%
leading_eigen 0.27 0.165 0.111 90.00% 90.00%
edge_betweenness 0.266 0.331 0.3 46.32% 37.89%
label_propagation 0.243 0.162 0.069 80.00% 100.00%
louvain_algorithm 0.302 0.157 0.123 95.24% 100.00%
walktrap_algorithm 0.228 0.173 0.164 70.80% 81.42%
Table 10Running time of different algorithms on BRCA data set edge list of miRNA and mRNAs with integrated mean value edge weight
Algorithm name Running time (second)
label-propagation 0.048
louvain_algorithm 0.062
fast_greedy 0.657
leading_eigen 1.073
walkstrap 3.078
hungagrian_blossom (MWMM) 449.232
01 can produce clusters that have a good trade-off be-tween the cluster size and GO similarity, compared to the other algorithms that produce several huge-sized clusters along with some small-sized clusters. Functional enrichment analysis such as KEGG pathway and GO terms was performed to find out the underlying factors or themes from genes in each derived cluster. For ex-ample, genes involved in p53 signaling pathway and cell cycle pathways were successfully identified.
The effectiveness of MWMM was validated both mathematically and biologically. Mathematically, the MWMM-derived clusters were analyzed with respect to their inner weights and outer weight. The percent of clusters that meet the condition one and two gradually increases as the MWMM merger process goes on. Even-tually, all MWMM-derived clusters have inner weights greater than their outer weight, namely, greater inside connection than outside connection. Biologically, MWMM-derived clusters have intra-cluster’s average GO term similarity distance scores much larger than the inter-cluster’s, compared to other six algorithms. MWMM approach was also applied to other 14 cancer types and it can merge initial clusters to yield clusters that mostly keep the inner weights larger than or equal to the outer weight in other 14 cancer types. Biologically,
the MWMM approach yields clusters that has relatively higher intra-cluster and relatively lower inter-cluster average GO term similarity distance scores compared to other six clustering algorithms in most of cancer types that are tested. This shows that the MWMM can also be applied to data sets other than BRCA.
In the future, more information could be integrated into MWMM pipeline. First, the expression fold change of miRNAs and mRNAs could also be considered into the edge weights of the miRNA-mRNA interactions to see the relationship between the expression fold change and correlation coefficient change. Second, the current study is configured such that it only considers the in-verse correlation coefficient change, namely from posi-tive to negaposi-tive or from negaposi-tive to posiposi-tive. It would be interesting to see whether from high positive to low positive or from high negative to low negative matters. Third, more filters could be applied to the clustering al-gorithm such as filtering out the smallest weight edges of miRNA-mRNA pairs. Fourth, more underlying factors or themes of each derived clusters would be easier to be unraveled by considering other factors like gene muta-tions, transcription factors, long noncoding RNAs, other regulatory elements, etc. This needs incorporating litera-ture studies and other formats of omics data.
Conclusions
In this study, the expression correlation coefficient changes of miRNA-mRNA pairs that are inverse from in normal to in tumor were quantified by integrated mean value weight out of proposed six edge weight formulas. The integrated mean value weight was favored based on the evaluation of the subjective traditional hierarchical clustering algorithm. Then, a maximum weighted merger method (MWMM) ap-proach combining the Hungarian algorithm and blossom al-gorithm was used to passively cluster the miRNA-mRNA pairs using the maximum weighted edge matching in the bi-partite graph and general graph. The resultant clusters can effectively capture and enrich cancer-associated miRNA-mRNA pair candidates in different cancer types and achieve more biologically significant clusters than other existing, available algorithms such as Louvain, fast greedy, walktrap, leading eigen, label propagation, and edge betweenness algo-rithms. In the future study, it is worthwhile to investigate how to use the clustered miRNAs and mRNAs as candidate biomarkers for different cancer types, identify cancer driver genes, provide clues for targets of precision medicine in can-cer, and develop new treatment strategies.
Additional files
Additional files 1:Description of data: top 38 edge-weighted miRNA-mRNA pairs of all six edge weight formulas clustered by traditional hierarchical clustering algorithm are shown in the graphs. (ZIP 39 kb)
Additional files 2:Description of data: inner weight, emitter to matched receiver outer weight, receiver to matched emitter outer weight, condition 01, and condition 02 of each cluster derived from a specific algorithm in the MWMM approach. (ZIP 18 kb)
Additional files 3:Description of data: the graphs describe the change of cluster numbers and mathematical condition satisfactions as more merging rounds are applied to different cancer types by MWMM approach. The supplementary graphs have the same setting as Figs.17
and23in the context. (ZIP 62 kb)
Additional files 4:Description of data: average GO similarity distance scores of intra-cluster, inter-cluster, and difference between intra-cluster and inter-cluster in each algorithm in each cancer type. (ZIP 8 kb)
Abbreviations
ARI:Adjusted Rand Index; BLCA: Bladder Urothelial Carcinoma; BRCA: Breast invasive carcinoma; COAD: Colon adenocarcinoma; E2MROW: Emitter to matched receiver outer weight; ENCODE: Encyclopedia of DNA Elements; ESCA: Esophageal carcinoma; GO: Gene ontology; HNSC: Head and Neck squamous cell carcinoma; ICGC: International Cancer Genome Consortium; IW: Inner weight; KEGG: Kyoto Encyclopedia of Genes and Genomes; KICH: Kidney Chromophobe; KIRC: Kidney renal clear cell carcinoma; KIRP: Kidney renal papillary cell carcinoma; LIHC: Liver hepatocellular carcinoma; LUAD: Lung adenocarcinoma; LUSC: Lung squamous cell carcinoma; MWMM: Maximum weighted merger method; N_CC: The miRNA-mRNA expressional correlation coefficients in normal.; NEC: Negentropy clustering; NGS: Next generation sequencing; PPS: Probabilistic principal surfaces; PRAD: Prostate adenocarcinoma; R2MEOW: Receiver to matched emitter outer weight; STAD: Stomach adenocarcinoma; T_CC: The miRNA-mRNA expressional correlation coefficients in tumor; TCGA: The Cancer Genome Atlas; THCA: Thyroid carcinoma; UCEC: Uterine Corpus Endometrial Carcinoma
Acknowledgements
The results published here are in whole or part based upon data generated by the TCGA Research Network:http://cancergenome.nih.gov/. We thank Cheng Zhao and Peng Zhao for his input for the initial design of main algorithms, Vincenzo Isaia for technical writing assistance, Hegui Zhu and Qingsong Tang for the Matlab codes, Hui Jiang for statistical advice, Xinqing Dai for assisting to write some scripts, Tao Chen for helping plotting graphs. We also thank other members in the Bai lab at Indiana State University. The authors would like to thank Department of Internal Medicine and Health Information Technology & Services at University of Michigan for their support.
Table 11summary of which clustering approaches achieve the highest difference of intra-cluster and inter-cluster average GO similarity distance score in three GO term categories in 15 cancer types
cancer_type top_BP_difference top_CC_difference top_MF_difference
BLCA MWMM MWMM MWMM
BRCA MWMM MWMM MWMM
COAD MWMM edge_betweenness leading_eigen
ESCA label_propagation MWMM MWMM
HNSC MWMM MWMM MWMM
KICH MWMM MWMM MWMM
KIRC MWMM MWMM MWMM
KIRP MWMM MWMM MWMM
LIHC MWMM MWMM MWMM
LUAD MWMM MWMM MWMM
LUSC label_propagation MWMM MWMM
PRAD MWMM leading_eigen MWMM
STAD MWMM MWMM MWMM
THCA label_propagation MWMM MWMM