DEMOGRAPHIC RESEARCH
VOLUME 28, ARTICLE 17, PAGES 457-504
PUBLISHED 12 MARCH 2013
http://www.demographic-research.org/Volumes/Vol28/17/ DOI: 10.4054/DemRes.2013.28.17
Research Article
Fertility and marriage behavior in Israel:
Diversity, change, and stability
Barbara S. Okun
© 2013 Barbara S. Okun.
This open-access work is published under the terms of the Creative Commons Attribution NonCommercial License 2.0 Germany, which permits use, reproduction & distribution in any medium for non-commercial purposes, provided the original author(s) and source are given credit.
1 Introduction 458
2 The Israeli context 459
2.1 Nationality in Israel 460
2.2 Religion and religiosity in Israel 460
2.2.1 Religion and religiosity within the Arab population 461 2.2.2 Religiosity within the Jewish population of Israel 462
2.3 Nativity status within the Jewish population 463
3 Data 464
4 Dimensions of fertility and marriage behavior in Israel 467 4.1 Period measures of fertility: TFR, fertility postponement and recuperation 467
4.2 Cohort measures of fertility 471
4.2.1 Fertility postponement 471
4.2.2 Average cohort completed fertility (CF) 474
4.2.3 Final parity distributions 477
4.3 Marriage 487
4.3.1 Non-marriage among women aged 40 and over 487
4.3.2 Marriage postponement among young adults 490
5 Summary and discussion 493
6 Acknowledgements 495
References 496
Fertility and marriage behavior in Israel:
Diversity, change, and stability
Barbara S. Okun1
Abstract
BACKGROUND
Based on aggregate statistics, the population of Israel, as compared to all or most other developed societies, has very high levels of fertility and marriage (e.g. TFR of 2.96 in 2009 and only 9.7% never married among women aged 40-44 in 2009). However, studying aggregate demographic measures is problematic, because Israel is an extremely heterogeneous society, with family formation patterns differing greatly across numerically important social groups. Until now, little has been documented about the basic fertility and marriage behavior of different population groups.
OBJECTIVE
We describe the fertility and marriage behavior of populations in Israel, broken down by nationality, religion, religiosity and nativity-status. Although our main focus is on a detailed presentation of fertility patterns, we also look at marriage behavior, as it is closely related to fertility in Israel.
METHODS
We analyze recently available annual data from the Israel Social Surveys for 2002-2009, which, for the first time in several decades,, provides detailed information on family and household demographic behavior and direct information on level of religiosity. We focus primarily on comparisons across cohorts born from the late 1940s to the late 1960s and between periods in the early and late 2000s.
RESULTS
We provide a detailed portrait of striking diversity in fertility and marriage behavior across population groups, along with important patterns of change and stability across cohorts and over time. We document findings and differential patterns, some unexpected, regarding comparisons across groups and across cohorts.
1 Department of Sociology and Anthropology, Demographic Studies, The Hebrew University of Jerusalem.
CONCLUSIONS
The descriptive findings form the basis for a clearer understanding of fertility and marriage patterns in different population subgroups in Israel. In addition, the reported results suggest many questions for future research, which are outlined in the paper.
1. Introduction
The population of Israel has very high levels of aggregate fertility as compared to all or most developed countries. For example, in 2009, period total fertility stood at 2.96 (Israel Central Bureau of Statistics (ICBS) 2010). However, interpreting aggregate demographic measures such as TFR is very problematic, because it is widely acknowledged that Israel is an extremely heterogeneous society, with family formation patterns differing greatly across numerically important social groups. There are significant differences in demographic patterns between the minority Arab (primarily Muslim) population and the majority Jewish population (Friedlander et al. 2010). Moreover, there is great heterogeneity in demographic patterns within the Arab and Jewish populations. However, little has been documented about the basic fertility and marriage behavior of different population groups, primarily because of a lack of up-to-date, adequate data (but see Friedlander and Feldmann 1993). For example, it has not been possible until very recently to construct measures of demographic and family behavior across groups from official government statistics because direct data on religiosity is not collected in census or vital registration systems (see also Bystrov 2012).
2. The Israeli context
Israel is ranked by the United Nations Human Development Index as among the "very high human development countries" in terms of income, education and health (United Nations 2011). For example, its income (GDP per capita of approximately $27,000 in 2009) puts it at about 75% of the OECD average, just below Korea (ICBS 2011). Israel is ranked near the highest among OECD countries in terms of proportions of persons aged 25-64 with tertiary level education (45% among persons aged 25-64 in 2009), higher than that in the United States and Japan, and significantly above the OECD average (OECD 2011). Women's labor force participation is also high, particularly among mothers with young children (Mandel and Semyonov 2006) and the division of household labor in Israel is relatively egalitarian (Raz-Yurovich 2011). Life expectancy in Israel is also very high – 83 years for women and 80 for men – thus matching or exceeding that of many Northern, Western and Southern European countries (ICBS 2011). Despite its overall high rankings in terms of socioeconomic development, the population of Israel is extremely heterogeneous along many dimensions. We briefly describe below the complex mosaic of overlapping and cross-cutting population groups defined by nationality, religion, religiosity and nativity-status.
2.1 Nationality in Israel
We begin by describing one of Israel's major societal divisions between two nationality groups – Palestinian Arabs (referred to in this paper as Arabs) and Jews.2 Patterns of population change in these two very broad groups have been closely connected with Israel’s political and ideological history and conflict. Around the time of the war and the establishment of the State in 1948, most Arabs were expelled or fled from their homes, or were displaced within what would become the borders of the State of Israel. Although formally, Arabs who live within the internationally recognized borders of Israel have citizenship status, they are subject to various forms of discrimination, which have contributed to their social and economic disadvantage vis-à-vis the Jewish majority. Today, Arabs in Israel are a heterogeneous and largely underprivileged minority.
In terms of population size, Arabs account for slightly under one-fifth of the total (1.3 million), while Jews account for the rest (6.1 million)3 (ICBS 2011). The Jewish
2 We refer to Arabs living within the pre-1967 internationally recognized borders of Israel, without making
any suggestion whether they do or do not consider themselves part of the State of Israel.
3 The total for Arabs does not include roughly 300,000 Arabs living in Jerusalem. The total for Jews includes
and Arab populations respectively grew 3.6% and 3.8% annually on average since 1948. While there is a relatively small difference in the average growth rates between the Jewish and Arab populations, the sources of population growth differ. Large net inmigration accounted for 44.5% of Jewish population growth during the period 1948-2008, while among Arabs, net migration was negligible since 1948 (ICBS 2009). Natural increase accounts for the high rate of population growth among Arabs.
2.2 Religion and religiosity in Israel
The population of Israel is comprised primarily from four religion groups. In addition to the majority Jewish population, the minority Arab population consists of Muslims (primarily Sunni) (84%), but also has smaller subpopulations of Christian Arabs (from a variety of denominations) (8%) and Druze (8%) (ICBS 2011).
In Israel, contemporary fertility differentials and population dynamics by religion and religiosity are very much the focus of current popular debate, if relatively little scholarly study. Although as a group, Arab fertility rates are much higher than those of the Jews, there is enormous heterogeneity within the Arab population. In the past, Druze and especially Muslim women maintained levels of period fertility that were substantially higher than those of Christian women. However, Druze have experienced substantial declines in period total fertility since the 1970s, and currently have levels of total fertility that are below those of the Jews, and just above those of the Christians. Muslims, after experiencing declines in period fertility during the 1970s, had near constant levels of fertility from the mid-1980s to the early 2000's, and have only in the last ten years or so experienced a renewed decline in period fertility to levels just below four (ICBS 2011).
In addition to heterogeneity in religions, there is also great variability with respect to religiosity within religion groups. It is beyond the scope of this paper to provide a general review of empirical and theoretical research related to the associations between religion, religiosity and family demographic behavior (see McQuillan 2004). However, below we discuss relevant aspects of religiosity within the Muslim and Jewish groups, which are the primary foci of this study.
2.2.1 Religion and religiosity within the Arab population
Schellekens (2011) have shown that there is a positive empirical association between religiosity of Muslim women, variously measured, and levels of marital fertility, in a Muslim locality in the North of Israel.
There is some debate in the literature regarding how religiosity among Muslims should be measured, and some researchers argue that the meaning of religiosity within Islam differs from that within Christianity. Nevertheless, research has shown that there are statistical associations in the expected directions between different measures of religious salience among Muslims, adherence to modest religious dress among Muslim women, and fulfillment of Islamic commandments among Muslim women in Israel (Atrash 2010). González (2011) has recently suggested that religious salience (“how religious do you consider yourself to be?”) is a more appropriate measure of religiosity in the Muslim context than standard measures of religiosity used in international surveys, which are based on religious behavior or beliefs. According to the responses to the 2009 Israel Social Survey, most adult Muslim women (aged 20 and over) in Israel consider themselves religious (51.1%) or very religious (10.1%), while the remainder see themselves as not so religious (24.4%) or not religious (14.5%). Adult Muslim men report that they are somewhat less religious than do Muslim women (ICBS 2010).
It should be kept in mind that these categories of religiosity among the Muslim population in Israel may not be as clear-cut or commonly understood as categories relevant in the Jewish population (see section 2.2.2 and Hleihel 2011). Despite the difficulties inherent in measuring religiosity, particularly within the Muslim population, we feel that it is important to discuss differences in family demographic behavior by religiosity within the Muslim population, because there is a lack of research in this area.
2.2.2 Religiosity within the Jewish population of Israel
A discussion of religiosity in the Jewish population in Israel is more straightforward than a similar discussion in the Muslim population of Israel, because categories of Jewish religiosity in Israel are more easily defined social constructs (Hleihel 2011), and there is more published research in the area of Jewish religiosity. Distinctions are normally made among the following numerically important groups: (1) ultra-Orthodox; (2) religious; (3) traditional; and (4) secular/not religious.
more likely to fulfill these commandments than are self-defined secular persons (author calculations based on Israel Social Survey 2009).
We discuss the different religiosity groupings in terms of distinctions based on social characteristics and behaviors. The ultra-Orthodox have a commitment to extreme segregation from the secular world. As Friedman (1991) discusses, the ultra-Orthodox groups stem from a contra-acculturation movement, which developed during the period of Enlightenment in Europe. They shun all contact with outside culture and essentially form separate societies living in segregated neighborhoods and towns. Based on the 2009 Israel Social Survey, 7.6% of adult Jewish women aged 20 and over define themselves as ultra-Orthodox (ICBS 2010).
In contrast to the ultra-Orthodox, the national religious movement originated during Enlightenment in the acculturation groups that promoted contact with the outside world while maintaining Jewish culture and practices (Friedman 1991). Persons who see themselves as part of the national religious movement are likely to self-identify as religious, but not ultra-Orthodox. These religious Jews are generally well integrated into Jewish Israeli society. Based on the 2009 Israel Social Survey, 10.6% of adult Jewish women aged 20 and over self-identify as religious (ICBS 2010).
An additional 39.8% of Jewish adult women in the 2009 Social Survey define themselves as traditional (ICBS 2010). Traditional Jews in Israel do not define themselves as strictly religious or Ultra-orthodox, and not as secular. Generally, traditional Jews do fulfill some religious commandments and maintain Jewish customs. However, their traditional behavior is not necessarily motivated only by religious commitment, but may also be associated with identification and affiliation with the Jewish people or with their Jewish ethnic group, community and family (Ben-Rafael and Sharot 1991). The large category of traditional Jews is sometimes broken down further into two subcategories: traditional/religious Jews and traditional/less religious Jews. The former group, while less likely to fulfill strictly the Jewish commandments (such as Sabbath observance) than are Ultra-orthodox or self-defined religious women, are more likely to do so than are traditional/less-religious women.
The largest group of adult Jews, at 41.8%, self-defines as secular/not religious (ICBS 2010). We note that substantial proportions of self-identified secular women report at least occasional observance of religious commandments, attend synagogue for major holidays, and rate religious ceremonies as very important in their lives.4 This would seem to suggest that even secular Jews in Israel are not completed secularized.
4 For example, among native-born secular women aged 20-44, 49% report that they follow kosher laws at
2.3 Nativity status within the Jewish population
As mentioned above, there are few Arab in-migrants to Israel, so that Arabs are almost exclusively native-born to Israel. In contrast, immigrants and their descendants have had enormous impact on the Jewish population. Immigrants have created an extremely diverse Jewish society, marked by different cultures, languages, levels of socioeconomic status and demographic regimes. Differences were especially dramatic between Jews from Eastern and Central Europe– known as Ashkenazim – and those from Muslim North Africa and Muslim West Asia – known as Mizrahim.
While it is not possible to know with certainty, due to incomplete information on ethnic ancestry in our data sources, previous research has suggested that many
Mizrahim self-identify as traditional Jews, and have maintained their traditional Jewish cultural practices more often than Ashkenazim (Ben-Rafael and Sharot 1991; Goldscheider and Fisher 1989; Okun and Khait-Marelly 2008). Moreover, previous research suggests that the association between Jewish ethnic ancestry (Mizrahim vs. Ashkenazim) and religiosity (traditional vs. secular) may lead to higher fertility and earlier marriage among traditionals than among seculars (Bernstein 1976; Goldscheider and Friedlander 1986; Friedlander and Goldscheider 1979).
The largest recent migration stream in Israel stems from the Former Soviet Union (FSU). From 1990 to 2008, nearly one million immigrants (primarily Ashkenazi Jews from European republics) arrived from the FSU (ICBS 2011). Importantly, and in contrast with the Mizrahi immigrants, the FSU immigrants are largely secular in religious outlook (Goldberg et al. 2001). Recent research has shown that immigrants to Israel from the FSU had much smaller family sizes than native-born Ashkenazi Jewish groups in Israel, and smaller family sizes even than native-born secular Jews in Israel (Nahmias 2004; Okun and Kagya 2012).
3. Data
questionnaire administered to female main respondents, supplemented with more limited data taken from other household members.
Our sample of Jews consists of all native-born and foreign-born persons who define themselves as Jewish. Our sample of Arabs consists of native-born persons who identify as Muslims, Christians or Druze.5 Our analyses do not include Bedouins who live outside recognized localities in Israel.6 In addition, we exclude from our analyses non-Jewish residents of Jerusalem and the West Bank.7 For completion, when we present figures on the overall population of Israel, our sample includes people from all religions, (including atheists), regardless of nativity-status, but does not include Bedouins living outside recognized localities in Israel nor non-Jewish residents of Jerusalem and the West Bank (see footnotes 6 and 7).
Our analyses focus primarily on quinquennial birth cohorts, centered around 1950, 1955, 1960 and 1965. The first quinquennial birth cohort begins with 1948, the year of the foundation of the State of Israel. Thus, the birth cohorts are defined as: 1948-1952, 1953-1957, 1958-1962, and 1963-1967. In some cases, we are able to consider the birth cohort of 1968-1970. Younger birth cohorts were too young during the period 2002-2009 to have reached the end, or near the end, of the childbearing years, so cannot be considered in terms of analysis of completed fertility. For purposes of examining trends in age at first birth and marriage patterns among younger individuals, we also consider younger birth cohorts.
The most important demographic information which can be garnered from the ISS questionnaire includes information on main respondents’ numbers of children ever born, age and sex of children living in the household, current marital status, number of times married, year of last change in marital status, country of birth and year of immigration. For divorced or remarried women, we do not have information on age at first marriage. Therefore, we will not be able to estimate models of age at first marriage.
Information on age at first birth is derived using the own child method, based on information of the oldest child in the household and woman's current age (Okun and Kagya 2012). We do not include in our sample women aged 41 and older at the survey date, since it is more likely that these women have an older child who has already left the household. Thus, we can consider age at first birth only for the birth cohorts born in or after 1962. We also include only women for whom we have correspondence between number of children found in the household and reported number of children ever born. The proportion with this correspondence is well over 90%.
5 As mentioned above, Arab immigration to Israel after 1948 was minimal, and Christian immigrants are
mainly non-Arab Christians from the Former Soviet Union.
6 Bedouins living outside recognized localities in Israel are not included in the ISS samples. 7
In terms of religiosity, all of the ISS contain information on self-defined religiosity at the time of the survey. The ISS questions on religiosity refer primarily to the concept of subjective religious salience, which may be considered appropriate for non-Christian populations (González 2011). In particular, the Arab main respondents are asked "How do you see yourself?" and are asked to choose among one of four categories: (1) very religious, (2) religious, (3) not so religious, or (4) not religious. The Jewish main respondents are asked "How do you define yourself?" and are asked to choose among one of five categories: (1) ultra-Orthodox, (2) religious, (3) traditional/religious, (4) traditional/less-religious, or (5) secular.
In all cases, we measure religiosity as self-defined by the main respondent at the time of the survey; we do not have data on religiosity at every point over the life course. Thus, changes in religiosity over time may lead to difficulties in terms of interpreting demographic histories by level of religiosity. However, Hleihel (2011) shows that this issue has minor impact on estimated period total fertility for the secular Jewish population, although there is a somewhat larger impact on the estimated period total fertility of the ultra-Orthodox Jewish population, particularly in periods of time further removed from the survey year. In general, by basing our measure of religiosity on current religiosity, rather than on a changing measure of religiosity across the life course (not generally available in the data), we tend to underestimate the differentials in fertility across religiosity subgroups among Jews (Hleihel 2011, Appendix 2a). For Muslims, as discussed above, the distinctions among religiosity subgroups are less clear. Hleihel (2011), however, suggests that for the majority of Muslim respondents in the ISS, subjective level of religiosity did not change over the life course (Appendix 2b).
In general, we present our findings for population subgroups defined by cross-cutting categories of nationality, religion, religiosity and nativity status (native-born vs. foreign-born). The two nationality groups are Arabs and Jews. We also present findings for the numerically largest religion subgroup within the Arab population: Muslim Arabs (referred to in the text, figures and tables as Muslims). However, due to sample size restrictions, we cannot present separate figures for Christian Arab or Druze subpopulations. Also, due to sample size limitations, we grouped together Muslim Arab women who self-defined as very religious or religious into an aggregate group which we term 'more religious Muslims'; the remaining Muslim Arab women, who self-defined as not-so-religious or not religious, were also grouped together in a category we term 'less religious Muslims'. In addition, as discussed above, because there is no sizeable foreign-born Arab population in Israel, foreign-born Muslims, Christians and Druze are excluded from the analyses of Arabs.
Jewish religiosity is recategorized into two religiosity groups: secular and non-secular; due to sample size restrictions, we could not present all the five religiosity groups of Jews by nativity status. Readers should keep in mind that it is somewhat difficult to interpret levels and changes in the family demographic behavior of the broadly-defined non-secular group, because of the changing composition of this group over birth cohorts in terms of factors such as level of religiosity. Similarly, it is difficult to interpret levels and changes in the family-demographic behavior of the foreign-born population over birth cohorts, because of the changing composition of this group in terms of region of origin, age at immigration, and duration of time spent in Israel. Our main goal in presenting the Jewish group broken down by religiosity and nativity status was to focus attention on the secular, native-born subpopulation. This group is more homogenous than the other Jewish nativity-status religiosity groups, and also is probably the most likely to show early signs of second demographic transition behavior, as secularization is generally considered one of the preconditions of the Second Demographic Transition (SDT) (Lesthaeghe 2010; Bystrov 2012). We should also note that only a very small proportion of the Muslim population self-defined in the ISS as not religious, so that it is not possible to provide detailed analyses of secular Muslims in the same way that we provide them for secular Jews.
4. Dimensions of fertility and marriage behavior in Israel
Below we consider various measures of fertility and marriage behavior among population subgroups defined by nationality, religion, religiosity and nativity status. The importance of marriage behavior in understanding fertility becomes clear when we consider that, unlike in many rich societies, the vast majority of childbearing in Israel still occurs within marriage. For example, only 3.6% of Jewish women who gave birth during the period 2005-2009 had never been married at the time of the birth; although official statistics are not published, proportions are likely to be even lower for Arab populations (ICBS 2012).
In this paper, we consider period and cohort measures of fertility, including detailed presentations of parity distributions and age at first birth. In addition, we present measures of non-marriage and marriage postponement. When relevant, we point out similarities in trends and differentials in non-marriage and marriage postponement, as they are related to childlessness and increases in age at first birth, respectively.
Often, because of differences in variable and sample definitions, results in Bystrov (2012) are not directly comparable to those reported here; however, where relevant in terms of comparison, the Bystrov (2012) article is referenced.
4.1 Period measures of fertility: TFR, fertility postponement and recuperation
Much has been written about trends in period total fertility in most developed societies. With the exception of New Zealand and the United States, developed societies over the recent decades have had below-replacement fertility levels, which have usually been accompanied by postponement of fertility (Frejka and Sobotka 2008). In the last several years, there are instances of a slight recovery in total fertility, as this postponement has begun to slow in some areas (Goldstein et al. 2009). Nevertheless, fertility remains below replacement in nearly all countries.
In contrast, total fertility in Israel has remained well above replacement-level, both among Muslims and Jews. Trends in Muslim TFR can be discussed in four periods: (1) the 1960s, characterized by extremely high levels of period total fertility over 9; (2) the early 1970s to the mid-1980s, when TFR declined rapidly to a level of about 4.7; (3) the mid-1980s to the early 2000s, when TFR levels were stagnant at around 4.7; and (4) the early 2000s to the present, during which there is a dramatic resumption of fertility decline to levels around 3.5 (ICBS 2012; Friedlander et al. 2010; Nahmias and Stecklov 2007). Among Jews, changes in period TFR are also noteworthy. Following an increase in fertility associated with mass immigration following Israel’s Statehood in 1948 (Friedlander 1975), period total fertility among Jews declined from 3.9 in 1950 to around 2.6 in the early 1990s, after which time total fertility remained fairly constant until the early 2000s, when a slight increase began, bringing fertility back to a level just under 3.0 (ICBS Statistical Abstracts, various years).
Recently, Hleihel (2011) has published estimates of period age-specific fertility rates by level of current religiosity for Muslims and Jews, based on information on Israel Social Survey data, linked to information on births from vital registration. Figure 1, adapted from Hleihel (2011), shows that, perhaps surprisingly, women who define themselves as religious actually have somewhat higher period fertility than do those who define themselves as very religious. These two groups, however, tend to have higher fertility than those who define themselves as not so religious or not religious (reclassified by Hleihel and here as 'less religious'). For example, during the 1990s, 'religious' and 'very religious' women had levels of total fertility which were about one child higher than that among 'less religious' women.
in Muslim period fertility are not simply a result of changes in population composition according to religiosity. For example, beginning in the early-to-mid 2000s, we note significant declines in fertility rates among all religiosity groups (Hleihel 2011). Period TFR remains well above replacement in all Muslim groups.
Figure 2, also adapted from Hleihel (2011), presents estimates of period total fertility of Jews, by level of religiosity. In contrast to the graph concerning the Muslim population, the graph for the Jewish population shows a consistent and clear positive relationship between level of TFR and religiosity. Ultra-Orthodox women had TFRs ranging over the period from about 6-7.5, with high levels reached during the early 2000s. Religious women had rates ranging between 3.5-4.3, with highs also reached during the 2000s. Traditional/religious women had levels between 2.5-3.5 and traditional/less-religious women had levels of about 2.2 to 2.7 (both with a small downward trend over time). Secular women had the lowest rates of period fertility throughout, with levels ranging from about 1.7-2.4.
Figure 1: TFR of Muslim women between 1979-2009, by level of religiosity
Source: Hleihel (2011).
Notes: Due to sample size considerations, women who self-defined as 'not so religious' or 'not religious' were combined into one category, referred to here as 'less religious'. See text for details.
Jews varied between 1.7-1.9. This below-replacement level came about as a result of declining fertility at the younger ages, followed, with some delay, with increased fertility at the older ages. Total fertility among secular Jews has increased slightly in the last few years, to a level just around replacement (2.07). Since 1990, there are large proportions of immigrants from the FSU who are enumerated as part of the secular Jewish population, and contributed to the below-replacement fertility in those years (Nahmias 2004; Okun and Kagya 2012).
Figure 2: TFR of Jewish women between 1979-2009, by level of religiosity
Source: Hleihel (2011). Notes: See text for details.
4.2 Cohort measures of fertility
4.2.1 Fertility postponement
We first examine the average age at first birth among parous women in completed or near completed fertility cohorts born during the mid-1960s. Table 1 shows that the average age at first birth among all women from the 1962-1968 birth cohort, based on women aged 39-40 at the time of the surveys, was 25.2. This average is lower than in most countries of Northern and Western Europe, and higher than in most countries of Central and Eastern Europe (Council of Europe 2005). The average of 25.2 is also intermediate to averages in Canada and the U.S., where age at first birth for the 1965 birth cohorts was 26.4 and 24.8 respectively (Human Fertility Database).
Table 1: Age at first birth among parous women aged 39-40 in cohorts born around 1965
Age at first birth (years) N
(1) All 25.2 721
(2) All Arabs 23.3 91
(3) All Muslims 23.3 71
(4) More religious Muslims 23.6 58
(5) All Jews 25.5 597
(6) Secular Jews 26.4 272
(7) Traditional/less-religious Jews 25.5 168
(8) Traditional/religious Jews 24.0 77
(9) Religious Jews 24.4 41
(10) Ultra-Orthodox Jews 23.7 39
(11) Secular Native Born Jews 26.9 182
(12) Secular Foreign Born Jews 25.4 90
(13) Non-Secular Native Born Jews 24.8 244
(14) Non-Secular Foreign Born Jews 24.6 81
Sources: Israel Social Surveys, 2002-2009, female respondents. Notes: Samples are restricted to women born between 1962-1968.
For Jews, the average age at first birth (25.5) is higher than that of Muslims, and we note substantial variability in age at first birth according to level of religiosity. For example, among secular Jews, the age at first birth is relatively high (26.4), while among ultra-Orthodox Jews the average is closer to that of the Muslims (23.7). Secular, native-born Jews have the highest average age at first birth (26.9). This is high compared to national populations in Europe, and close to levels in Ireland, Sweden, Denmark, Spain and Italy.
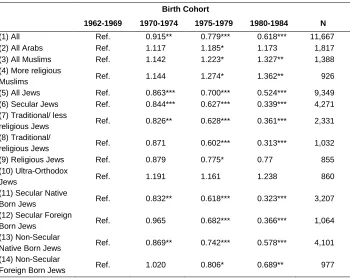
We now investigate change in the age at first birth for the birth cohorts 1962-1984. Table 2 presents exponentiated coefficients from Cox regression of the first birth, estimated separately for population subgroups. In these analyses, women who have not had a first birth by the year of the survey are treated as censored cases. In all cases, only women aged 40 and under at the survey date are included in the analyses8. The independent variables are dummy variables representing birth cohorts 1970-74, 1975-79, and 1980-84, with effects estimated relative to the birth cohort of 1962-69 (the reference category). We interpret exponentiated coefficients that are smaller than one in terms of postponement rather than avoidance of the first birth, since, as will be discussed below, proportions childless have not exceeded 15% in any population subgroup, at least among women who have completed childbearing in recent decades
Row (1) reports results for all women in Israel together, and the results are suggestive of increasing postponement of the first birth across cohorts of the 1970s and early 1980s. However, Rows (2), (3), and (4) show that postponement of the first birth has not occurred among Arab women overall, nor among Muslim women overall, nor among more religious Muslim women.9 Rather, there appears to be some fertility advancement in later birth cohorts, particularly among the Muslim groups.10
In contrast, Row (5) suggests that there has been statistically significant and steady postponement of the first birth among the overall Jewish population. An examination of Rows (6)-(10) suggests that the postponement has occurred to a much greater extent among the secular women and the two groups of traditional women, to a much smaller extent among religious women, and not at all among the ultra-Orthodox women. For example, the first-birth rate of secular women born in the latest birth cohort is 66% [(1 – 0.339)*100] lower than for women born in the earliest birth cohort. When considering the association with nativity status (Rows (11)-(14)), we note that both secular native-born women and secular foreign-native-born women have been increasingly postponing the
8
Re-estimation of the models using samples of women aged up to 37 only resulted in very similar substantive trends.
9 Sample sizes are not large enough to allow estimation of model for less religious Muslim women.
10 When the analyses of age at first birth in the Arab and Muslim samples are limited to women aged 37 and
first birth. The same general trend holds for non-secular native-born and foreign-born, although to a lesser degree.
Table 2: Exponentiated coefficients from Cox Regressions of age at first birth
Birth Cohort
1962-1969 1970-1974 1975-1979 1980-1984 N
(1) All Ref. 0.915** 0.779*** 0.618*** 11,667
(2) All Arabs Ref. 1.117 1.185* 1.173 1,817
(3) All Muslims Ref. 1.142 1.223* 1.327** 1,388
(4) More religious
Muslims Ref. 1.144 1.274* 1.362** 926
(5) All Jews Ref. 0.863*** 0.700*** 0.524*** 9,349 (6) Secular Jews Ref. 0.844*** 0.627*** 0.339*** 4,271 (7) Traditional/ less
religious Jews Ref. 0.826** 0.628*** 0.361*** 2,331 (8) Traditional/
religious Jews Ref. 0.871 0.602*** 0.313*** 1,032
(9) Religious Jews Ref. 0.879 0.775* 0.77 855
(10) Ultra-Orthodox
Jews Ref. 1.191 1.161 1.238 860
(11) Secular Native
Born Jews Ref. 0.832** 0.618*** 0.323*** 3,207
(12) Secular Foreign
Born Jews Ref. 0.965 0.682*** 0.366*** 1,064
(13) Non-Secular
Native Born Jews Ref. 0.869** 0.742*** 0.578*** 4,101 (14) Non-Secular
Foreign Born Jews Ref. 1.020 0.806* 0.689** 977
Source: Israel Social Surveys 2002-2009, Jewish female respondents. See text for details. Notes: * p < 0.05, ** p < 0.01, *** p<0.001
4.2.2 Average cohort completed fertility (CF)
In most areas of Europe, N. America and Oceania, completed fertility (CF) for cohorts of the 1960s has stood at or below replacement-level. For European cohorts of 1960 and 1965, for example, CF generally did not exceed 2.1, with most levels a bit below 2.0. Some of the highest CF levels in Europe for the 1965 cohort are found in France (2.03), Norway (2.07), and Ireland (2.19), while lows of 1.51 are found in Italy and Germany (Council of Europe 2005). In the U.S., CF for the birth cohorts of 1960 and 1965 were 2.0, while the analogous figures for Canada were 1.8 and 1.7 for these two cohorts, respectively (Human Fertility Database). In Australia and New Zealand, CF values are slightly higher, with Australia registering 2.2 and 2.1 for the 1960 and 1965 cohorts (Myrskylä et al. 2012, Australian Bureau of Statistics 2011), and New Zealand registering 2.4 and 2.3 respectively (Statistics New Zealand 2012). As will be seen below, values for cohort fertility in Israel are extremely high when compared with all of these figures, and there is remarkable diversity across population groups.
Figures 3-6 report estimated values of CF for different population subgroups in quinquennial birth cohorts starting from 1948-1952 through 1963-1967, and also for the birth cohort 1968-1970. With the exception of the last birth cohort, only women who were at least 40 years of age during the survey year were included in the analyses in this section and in section 4.2.3 so that CF reflects completed, or nearly completed fertility. For the 1968-1970 birth cohort, women were aged 37 and over during the survey year, so their completed fertility may be slightly underestimated. From Figure 3, we see that the overall CF values for all women born around 1950, 1955, 1960, 1965, and 1969 were roughly constant at levels close to 3.1. The averages for all women are just slightly above those for the Jewish population, which also show nearly constant CF values close to 2.9 for all birth cohorts. The CF values of Arab and Muslim women are much higher and reveal a very substantial and statistically significant decline in CF values over birth cohorts (see also Bystrov 2012). Trends in Arab cohort fertility are similar to those of Muslim cohort fertility, due to the numerical dominance of the Muslim group within the Arab population. While the 1948-1952 cohort averaged 6.1 children per Muslim woman, the 1968-1970 birth cohort averages only about 3.5 children per Muslim woman. This large decline in CF occurred over Muslim birth cohorts, many of which had their exposure to childbearing during years of stagnant period fertility rates (1985-2002). Thus, there is remarkably little similarity between trends in cohort and period fertility among Muslims in Israel.
Cohort completed fertility among Jews shows much greater variability with respect to religiosity (see also Bystrov 2012). Figure 5 shows that ultra-Orthodox women have levels of cohort fertility ranging from 6.2 to 8.0.11 Religious women have cohort fertility in the range of 4.0; the two groups of traditional women have cohort fertility in the range of 2.5 to 3.5, with a slight downward trend noticeable among traditional/religious women. Secular women have the lowest number of children on average, but maintain replacement-level or just above replacement-level cohort fertility across birth cohorts, with no statistically significant change over cohorts. With the exception of a short-lived peak in cohort fertility among the ultra-Orthodox, there is remarkably little trend in cohort fertility among any of the religiosity groups, or among Jews overall (Figure 3).
Figure 3: Completed or near completed fertility among women, by birth cohort, nationality and religion
Source: Israel Social Surveys 2002-2009, female respondents.
Notes: Women included in the sample were aged 40 and over during the survey year, except for women in the 1968-1970 birth cohort, who were aged 37 and over during the survey year.
* indicates that the cohort completed fertility is statistically significantly different than in the analogous 1948-1952 cohort, at the 5% level of significance, in a two-tailed test.
11 Based on a smaller and differently defined sample, Bystrov (2012) reports somewhat lower figures for
Figure 4: Completed or near completed fertility among Muslim women, by birth cohort and level of religiosity
Source: Israel Social Surveys 2002-2009, Muslim female respondents.
Notes: See notes to Figure 3. For the less-religious Muslims only, * indicates that the cohort completed fertility is statistically significantly different than in the analogous 1953-1957 cohort, at the 5% level of significance, in a two-tailed test. 'b' indicates that the cohort sample size is less than 30.
Figure 5: Completed or near completed fertility among Jewish women, by birth cohort and level of religiosity
Finally, Figure 6 presents cohort fertility for secular and non-secular women by nativity status. For reasons discussed above, we focus our attention on the fertility of the secular native-born group. We note that the secular native-born group has experienced statistically significant declines in cohort fertility, but still maintains levels of cohort fertility above replacement, at the level of 2.3 or so. In all birth cohorts considered, the CF among secular native-born Jews in Israel is higher than in the U.S. and nearly every European nation (values are close to those of national populations in Ireland, Iceland and New Zealand in some cohorts).
Figure 6: Completed or near completed fertility among Jewish women, by birth cohort, level of religiosity and nativity status
Source: Israel Social Surveys 2002-2009, Jewish female respondents. Notes: See notes to Figure 3.
4.2.3 Final parity distributions
In all of Europe, the two-child norm has been firmly entrenched for decades, and is very common for birth cohorts of the 1950s and 1960s, with roughly 40% or more of women having exactly two children by the end of their reproductive years (Frejka 2008).12 In the U.S., the mode of two children per woman has also been well established for birth cohorts from the 1950s and earlier. For example, 34% of the 1962-1966 birth cohort in
12 In spite of this, there are some signs of the incipient decline of the two-child family, with increasing
the U.S. have exactly two children (Hamilton and Cosgrove 2010). The analogous figure for Australia is 38% (Australian Bureau of Statistics 2007).
In Europe, the United States and Australia, the proportion of women at final parities other than two are much lower than the proportion with exactly two children (see Breton and Prioux 2009 for a discussion of childlessness and one-child families in Europe). For example in European cohorts born around 1965, the per cent of women with exactly one child ranges from a low of about 12% in England and Wales to a high of 37% in the Russian Federation, with typical values from 15%-25%. In Australia and the United States, 13% and 19% of women born during 1962-1966 eventually have exactly one child (Australian Bureau of Statistics 2007; Hamilton and Cosgrove 2010).
Proportions childless among cohorts born around 1965 are also much lower than proportions with exactly two children. In European cohorts born around 1965, final proportions childless range from a low of 5% in Portugal to a high of 24% in Italy, with typical values from 10%-20% (Frejka 2008). In the United States and Australia, values are within this range, with 15% and 16% of women born during 1962-1966 childless (Australian Bureau of Statistics 2007; Hamilton and Cosgrove 2010).
At the high-parity end, it has been noted that by the early 1960s birth cohorts, the prevalence of large families with four or more children had declined greatly in Europe and the United States, relative to birth cohorts of the 1930s and 1940s. In almost all cases, proportions of women in the early 1960s birth cohorts with four or more children did not exceed 20%, with typical values in the range of about 10% to 20% (Frejka and Sardon 2007). Proportions of the 1965 European birth cohorts with three or more children ranged from around 10% to 30%. In all cases, the proportions of mid-1960s European birth cohorts with three or more children are quite a bit lower than analogous proportions with two children (Frejka 2008). In the United States and Australia, the proportions of the 1962-1966 birth cohorts with three or more children are on the high side, at 32.1% and 32.5% (Australian Bureau of Statistics 2007; Hamilton and Cosgrove 2010). However, even there, the two-child mode is apparent.
Figure 7 presents the figures for all women in Israel. Stability characterizes the parity distributions of all women, with few large or statistically significant changes over birth cohorts. In all cohorts, approximately 60% of women have at least three children, with about 30% having exactly three children, close to a third of the women having at least four children, and 5-7% having at least seven children. On the lower parity end, only approximately 25% of women have exactly two children, 10% have exactly one child, and 5-10% are childless. Thus, women with two or fewer children make up less than half of each birth cohort, and childlessness and one child families are on the very low end of the range typical of most developed populations.
In contrast to the overall picture of stability portrayed in Figure 7, Figure 8 documents a very substantial decline over Arab birth cohorts in the proportion with very large families of seven or more children. This proportion dropped from over 30% in the 1948-1952 birth cohort to under 10% in the 1963-1967 birth cohort, and the change is statistically significant. There was also a corresponding drop of about 16 percentage points (77% – 61%) in the proportions with four or more children. Thus, there was a drop not only at the extremely high parities (7+), but also a shift out of the moderately high parities (4+) to parities of three and below. In particular, there was a statistically significant increase in the proportions with exactly three children, and smaller increases at parities 0, 1 and 2. There is a relatively high level of childlessness (12%) in the latest cohort of Arab women examined. The level of childlessness here is higher than in the overall population (Figure 7), despite the generally much higher than average level of fertility in the Arab population than in the overall population. As will be discussed below, the relatively high levels of childlessness are related to the prevalence of non-marriage.
Figure 9, which presents the parity distribution for Muslim women, shows a similar pattern of change as was seen for all Arab women13, with a particularly dramatic drop of roughly 30 percentage points in the proportion with 7 or more children (from nearly 40% to under 10%). Proportions with 4 or more children declined less dramatically, by 17 percentage points (from 82% to 65%). The change appears to have accelerated among the most recent birth cohorts examined. As in the case of all Arab women, there was a significant increase in the proportion with exactly 3 children, and smaller increases at parities 0, 1 and 2. We note that the level of childlessness among Muslims is even higher than among the overall Arab population, and is likely related to non-marriage. The picture of change for more religious Muslims women is very similar (Figure 10).
The Jewish population experienced much less cohort change in parity distribution than the Muslim and overall Arab populations (Figure 11). This finding is consistent with the rough stability in average parity described above (section 4.2.2). Statistically
13
significant changes occur only at the extremes of the parity distributions, with counterbalancing increases in the proportions with 7 or more children, and increases in the proportions with no children. Proportions with 7 or more children increase to over 5% in the last birth cohort examined, and levels of childlessness climb to 7%. In general, for all birth cohorts, three children is the modal value of completed fertility (just over 30%), with slightly lower and roughly equal proportions of 25% to 30% each, at parities 2 and 4+. Thus, compared with most developed societies in recent cohorts, the Jewish population has extraordinarily high proportions at the moderately high to high parities (4+), and low proportions childless or with one child.
Turning to Figures 12-16, we note the extraordinary variance in parity distributions across Jewish subpopulations defined by religiosity. As will be seen, there are clear distinctions between all religiosity subgroups. For ultra-Orthodox women (Figure 12), we note the remarkable 30 percentage-point increase in proportions with 7 or more children (a statistically significant increase from roughly 35% to over 65%). There is also a large and statistically significant 15 percentage-point increase in the proportions with 4 or more children, to a high of 96% with at least 4 children in the last birth cohort.
Among religious Jewish women (Figure 13), there is less systematic change, with a clear majority of women at moderately high to very high parities of four or more children. An additional 20% to 30% of religious women have exactly three children, and women with two or fewer children comprise only 15% to 20% in each cohort.
In contrast to religious Jewish women, who showed little sign of systematic cohort change in final parity distributions, traditional/religious women show clear signs of a shifting out of very high (7+) and moderately high (4+) parities (Figure 14). We see some indications of increases in proportions with exactly two or three children, with the latter change being statistically significant. By the last cohort examined, the three-child family is clearly numerically dominant.
In contrast to the traditional/religious women, traditional/less-religious women (Figure 15) have much lower proportions at moderately high and very high parities (4+), although they are at the very high end compared with most developed populations. Women with exactly three children make up nearly one-third of the last cohort examined, and women with three or more children make up more than one-half of the last cohort. Together with this, there is a statistically significant increase in the proportion of women with exactly two children.
although on the rise. Secular Jews in Israel, in contrast with most developed populations, have a higher proportion at three or more children than at exactly two children (see also Bystrov 2012). As can be seen in Figure 17, among native-born secular Jews, there is an even clearer and greater predominance of the three-child norm than among all secular Jews.
In summary, we see enormous heterogeneity between Muslim and Jewish populations regarding final parity distributions and trends in parity distributions. In particular, the Muslim population has higher proportions at the upper end and lower end of the parity distribution. Muslims in recent birth cohorts have higher proportions with 7 or more children than do analogous Jewish cohorts, although this proportion has declined greatly in recent cohorts. Muslims also have higher proportions childless than do Jewish populations. We also document extraordinary differences in final parity distributions within the Jewish population by level of religiosity. The only notable commonality among all Jewish religiosity subgroups is in the low levels of childlessness and one-child families. Only secular Jews have seen small but statistically significant increases in childlessness, and only native-born secular Jews have seen statistically significant increases in proportions with exactly one child.
Figure 7: Cumulative parity distribution and percent with 7 or more children: All women, by birth cohort
Source: Israel Social Surveys 2002-2009, female respondents.
Notes: Women included in the sample were aged 40 and over during the survey year.
* indicates that the per cent is statistically significantly different than in the analogous 1948-1952 cohort, at the 5% level of significance, according to a Pearson Chi-square test.
Figure 8: Cumulative parity distribution and percent with 7 or more children: Arab women, by birth cohort
Source: Israel Social Surveys 2002-2009, Arab female respondents.
Notes: See notes to Figure 7. Value labels for values smaller than 5% are not shown.
Figure 9: Cumulative parity distribution and percent with 7 or more children: Arab Muslim women, by birth cohort
Figure 10: Cumulative parity distribution and percent with 7 or more children: More religious Arab Muslim women, by birth cohort
Source: Israel Social Surveys 2002-2009, more religious Muslim female respondents. Notes: See notes to Figure 8. 'a' indicates that birth cohort sample size is less than 100.
Figure 11: Cumulative parity distribution and percent with 7 or more children: Jewish women, by birth cohort
Figure 12: Cumulative parity distribution and percent with 7 or more children: Ultra-orthodox Jewish women, by birth cohort
Source: Israel Social Surveys 2002-2009, Jewish Ultra-orthodox female respondents. Notes: See Notes to Figure 10.
Figure 13: Cumulative parity distribution and percent with 7 or more children: Religious Jewish women, by birth cohort
Figure 14: Cumulative parity distribution and percent with 7 or more children: Traditional/religious Jewish women, by birth cohort
Source: Israel Social Surveys 2002-2009, Jewish traditional/religious female respondents. Notes: See Notes to Figure 8.
Figure 15: Cumulative parity distribution: Traditional/less-religious Jewish women, by birth cohort
Source: Israel Social Surveys 2002-2009, Jewish traditional/less-religious female respondents. Notes: Women included in the sample were aged 40 and over during the survey year.
* indicates that the per cent is statistically significantly different than in the analogous 1948-1952 cohort, at the 5% level of significance, according to a Pearson Chi-square test.
Figure 16: Cumulative parity distribution: Secular Jewish women, by birth cohort
Source: Israel Social Surveys 2002-2009, Jewish secular female respondents. Notes: See Notes to Figure 15.
Figure 17: Cumulative parity distribution: Secular, native-born Jewish women, by birth cohort
4.3 Marriage
In this section, we consider two measures of marriage behavior: non-marriage among older women, and marriage postponement among younger women. Since the vast majority of childbearing in Israel occurs within marriage, non-marriage among older women can be associated with childlessness or, perhaps, with the occurrence of one-child families. Similarly, marriage postponement is often associated with fertility postponement among women in the childbearing ages. Consistency between marriage and fertility patterns across population groups will be discussed below, where relevant.
4.3.1 Non-marriage among women aged 40 and over
Non-marriage among cohorts of women aged 40 and over has been on the rise in most developed societies. For example, in many Northern and Western European countries, non-marriage began increasing during the 1950s cohorts, and reached levels generally in the range of 20% - 30% by the 1965 birth cohorts. The decline in marriage started later in most Southern, Central and Eastern European countries: during the 1960s birth cohorts, reaching levels of 10-15% in most countries by the 1965 birth cohort (Council of Europe 2005, pp. 71+). Among the English-speaking overseas populations, figures were intermediate to those in Europe, and ranged roughly between 15%-20%. For U.S., Australian, New Zealand, and Canadian cohorts of 1962-1966, 14.6%, 15.6%, 18.2%, and 21.5%, respectively, had never been married in 2006 (at ages 40-44) (Australian Bureau of Statistics no date; Statistics New Zealand 2009; Statistics Canada 2007; U.S. Census Bureau 2006). Thus, for most European and English-speaking overseas populations, the figures for non-marriage among those aged 40-44 around the 1965 birth cohort ranged from 10%-30%.
Relative to these figures, the values in Israel are quite low. Figure 18 shows statistically significant increases in non-marriage across birth cohorts, among all women aged 40 and over in Israel, although overall levels of non-marriage in cohorts born in the mid 1960s remain at the very low end (under 8%). Marriage, while clearly no longer nearly universal among women in Israel, is still a predominant form of behavior among women born during the 1950s and 1960s. However, as will be seen below, there is also heterogeneity in the extent of non-marriage.
among Muslim women (Hleihel 2009)14 Because non-marital childbearing is extremely rare in this subpopulation, we can understand the relatively high levels of childlessness discussed above (see Figures 8-10), in terms of the high levels of non-marriage. Although there does appear to be a steady increase in non-marriage among Muslim cohorts of women, the proportion who have never married by age 40 and over in the last cohort (11%) is not found to be statistically significantly different than the analogous proportion in the first cohort (5.5 %), based on the ISS samples.15 Regarding differences by levels of religiosity, we find small increases in non-marriage among the more religious Muslim population, and slightly lower levels of non-marriage among the more religious than among the less religious, but differentials and trends are not found to be large or statistically significant (Figure not shown but available from author).
Among Jewish women, the increase in non-marriage across cohorts, based on the ISS samples, is statistically significant (Figure 18), although overall levels of non-marriage among Jews remain quite low compared to most other developed societies16. Also, there are important differences in levels and trends in non-marriage by degree of religiosity among Jews. Figure 19 shows substantial and statistically significant increases in non-marriage among secular Jews as compared with rough stability at lower levels among all other religiosity groups. Among secular Jews, non-marriage increased to over 13% in the 1963-1967 cohort, whereas levels of non-marriage remained at or below 5% in all other religiosity groups born at the same time. Thus, the levels of non-marriage among seculars in the 1963-1967 cohort approach those of nationally representative cohorts of the mid-1960s in countries such as Italy, Spain, and Hungary. The significant increase in non-marriage across secular birth cohorts has occurred among the native-born as well as the foreign-born (Figure not shown, but available from author). In addition, the increase in non-marriage among secular groups may be one factor associated with the statistically significant increase in childlessness among secular Jews, discussed above (see Figures 16 and 17).
14 This suggestion is supported empirically by the extremely low proportions of Muslim men who remain
unmarried: fewer than 2% among Muslim men aged 40-44 in 2009, as compared with 13.4% among the analogous group of women (ICBS 2011).
15
Official statistics, however, do suggest a significant increase in non-marriage among Muslim women, with 8.9% of women aged 40-44 in 1996 never married, as compared with 13.4% among women of the same age in 2009 (ICBS 1999, 2011)
16 Official statistics also show increases in non-marriage among Jews, with 6.1% never married, among
Figure 18: Percent never married (%) among women aged 40 and over, by birth cohort, nationality and religion
Source: Israel Social Surveys 2002-2009, female respondents.
Notes: Women included in the sample were aged 40 and over during the survey year.
* indicates that the percent never married is statistically significantly different than in the analogous 1948-1952 cohort, at the 5% level of significance, according to a Pearson Chi-square test.
Figure 19: Percent never married (%) among Jewish women aged 40 and over, by birth cohort and level of religiosity
Source: Israel Social Surveys 2002-2009, Jewish female respondents.
Notes: See Notes to Figure 18. 'a' indicates that birth cohort sample size is less than 100.
4.3.2 Marriage postponement among young adults
Marriage postponement has been an indicator of family change in many developed societies over the last several decades (e.g. Lesthaeghe 2010; Sobotka and Toulemon 2008). Even in England and Wales, where the proportion of the adult population who are married is one of the highest in Europe, 83.4% of women and 89.6% of men aged 20-29 in 2010 had never married (Office for National Statistics 2011). Although the analogous figures in Australia, New Zealand, and Canada in 2006 are a bit lower, with about 75% and 85% of women and men unmarried at ages 20-29, a very large majority of young women and men in those countries have never married (Australian Bureau of Statistics no date; Statistics Canada no date; Statistics New Zealand 2012b).17 Proportions never married are lower in the United States, with 62.2% of young women and 73.0% of young men (aged 20-29) never married in 2006 (U.S. Census Bureau 2006).
Figure 20 reports proportions never married among women and men aged 20-29, by sex and period, for all Arabs, Muslims, Jews and for the overall population in Israel.18 The figure reports proportions never married in the sub-periods 2002-2005 and 2006-2009. Despite statistically significant increases over time, proportions never married at ages 20-29 remain generally low relative to the national populations mentioned above. For example, in the later sub-period, only 59% of all women and 63.5% of Jewish women remained never married. Differences across population subgroups are very large among women, with much lower proportions never married among Arab and Muslim women – 38.3% and 35.0%, respectively in the latter period. Although Arab and Muslim women have lower levels of never marrying among younger women (20-29), they have higher levels of non-marriage among older women (aged 40+) than do Jewish women (see Section 4.3.1).
Proportions never married among all men aged 20-29 are also rather low, although they are increasing and are roughly at U.S. levels in the latter sub-period. In contrast to the case of women, there is little difference across population subgroups in proportions never married among men.
A closer inspection of the marriage behavior of young Muslim women and men reveals differences across population subgroups defined by level of religiosity, with less religious women and men having higher levels of proportions never married than more religious women and men. Less religious men also showed statistically significant increases in never-marriage over the sub-periods (Figure 21).
17 Proportions never-married among persons aged 20-29 are 75.2% for women and 84.8% for men in
Australia; 77.6% for women and 85.3% for men in New Zealand; and 77.4% for women and 86.4% for men in Canada.
18 The data do not allow us to ascertain age at first marriage for all ever-married adults, because there is
Religiosity differentials tend to be even larger among young Jewish men and women, particularly the contrast with the ultra-Orthodox and religious groups (Figure 22) (see also Bystrov 2012). While young religious and ultra-Orthodox women and men have very low proportions never married, the traditional and secular groups have proportions never married that are closer to those in the United States or other countries mentioned above. All groups experienced increases in proportions never married, although not all increases are statistically significant, and the broad religiosity differentials are retained. These documented increases in proportions never married at ages 20-29 are likely to be associated with the postponement of the first birth in recent birth cohorts among seculars and both groups of traditional Jews (see Table 2). There was a particularly large increase in proportions never married among traditional/religious Jewish women, whose behavior in the later sub-period resembles that of traditional/less-religious women. Overall, there is a consistent ordering in terms of religiosity, such that the proportions never married increase as the level of religiosity declines. Proportions never married by religiosity and nativity status indicate that there were increases in marriage postponement for both secular groups, although increases were statistically significant only among native-born secular women (Figure not shown, but available from author).
Figure 20: Percent never married (%) among women and men aged 20-29, by period, nationality and religion
Source: Israel Social Surveys 2002-2009, male and female respondents.
Figure 21: Percent never married (%) among Muslim women and men aged 20-29, by period and level of religiosity
Source: Israel Social Surveys 2002-2009, Muslim male and female respondents. Notes: See Notes to Figure 20.
Figure 22: Percent never married (%) among Jewish women and men aged 20-29, by period and level of religiosity