DOI:10.5545/sv-jme.2019.6459 Original Scientific Paper Accepted for publication: 2019-11-15
*Corr. Author’s Address: University of Ljubljana, Faculty of Mechanical Engineering,
728
Review Paper —DOI: 10.5545/sv-jme.2017.4027 Accepted for publication: 2017-02-12
Semi-Analytical Multidimensional Algorithm for Aircraft Design
Optimisation: Student Design Build Fly (DBF) Competition
Viktor Šajn*
University of Ljubljana, Faculty of Mechanical Engineering, Slovenia
The winner of American Institute of Aeronautics and Astronautics (AIAA)/Textron Aviation/Raytheon Missile Systems Design/Build/Fly (DBF) Competition 2019 was Edvard Rusjan team from Faculty of Mechanical Engineering, University of Ljubljana, Slovenia. Edvard Rusjan team use a strict scientific approach to beat opposing teams from most prestigious US Universities. Team developed a semi-analytic multidimensional algorithm for aircraft design optimization with an aim to maximize competition score in accordance with the competition rules. Two intermediate prototype models were produced and tested for single ground and three flying missions to fine tune algorithm empirical coefficients. Aircraft model aerodynamics was predicted with RANS numerical simulations and dynamic stability with Inviscid Panel method. By measurement in Low Turbulence Wind Tunnel the low drag of selected aircraft external load configuration was verified. Wing and fuselage of competition aircraft model named by Ljubljana students "Pretty Boy" were made of carbon-glass sandwich composite and Aramide honeycomb as sandwich filler. At final fly-off at TIMPA field in Tucson, in final flight mission team pilot Timotej Hofbauer with "Pretty Boy" scored 18 laps in 10 minutes time slot which was absolute record of competition. Runner-up Georgia Institute of Technology team was22%slower and finished with 14 scored laps.
Keywords: carbon-glass sandwich composite construction, number of laps in time slot, take-off, design parameters, aerodynamic drag, DBF competition 2019, Edvard Rusjan team
Highlights
• Semi-analytic multidimensional algorithm for aircraft design optimization was developed. • A detail mathematical model of each flight mission was built.
• Algorithm predicts that in third Mission aircraft is capable of scoring 19 turns in 10 minutes. At competition team completed 18 laps. • NiMh battery cells capacity shows great level of uncertainty which degrade mathematical model accuracy.
• Wining aircraft "Pretty Boy" was made of carbon-glass sandwich composite and Aramide honeycomb as sandwich filler.
0 INTRODUCTION
The final fly-off 2018-19 American Institute of
Aeronautics and Astronautics (AIAA)/Textron
Aviation/Raytheon Missile Systems Design/Build/Fly Competition Fly-off was organized at TIMPA Field in Tucson, AZ from April 11 to 14, 2019. From 138 competition team proposals, 113 were invited to submit a formal report, which 104 did. Final fly-off attended 77 teams, 65 successfully completed tech inspection. Just 26 teams accomplished all four missions.
Every year there is a new contest theme, this year Aircraft Carrier Operations. Wingspan has to be larger than 4 foot, aircraft has to roll trough 3 foot x 2 foot box with folded wings, which unfold remotely.
Aircraft has to complete one ground and three flight mission, taking off from 4 foot by 10 foot platform. For the first mission aircraft without payload has to fly three laps in five minutes. In the second mission aircraft has to use radome in flight. The final mission included payload of foam toys with popular name attack stores. During the mission duration of 10
minutes aircraft has to make as many as possible laps while dropping one store per lap. Competition winning team was Edvard Rusjan of University of Ljubljana, Slovenia, second Georgia Institute of Technology and third FH Joanneum University of Applied Sciences.
Edvard Rusjan team introduced a series of optimization algorithms, procedures for aircraft design and production. Team also used special procedures and technique to build high-performance composite aircraft. In the paper we presented the whole path of winning aircraft creation: design, build, optimization and proof of concept by flying and winning the competition. Official competition system of units was Imperial.
1 CONCEPTUAL DESIGN
The main objective of the 2019 AAIA Design Build Fly competition was to design a multi-purpose aircraft to support carrier operations. The rules specify a ramp take-off and ground landing. The aircraft was designed for the optimal total score with the highest achievable
Strojniški vestnik - Journal of Mechanical Engineering 65(2019)11-12, 728-740Strojniški vestnik - Journal of Mechanical Engineering 63(2017)3, XXX-4
score in each mission. The totalSCORE is calculated
using Eq. (1).
SCORE=W RS·T MS, (1)
whereW RS is Written Report Score. The Total
Mission Score T MS is a sum of scores, obtained in
Ground MissionGM and Missions OneM1, TwoM2
and ThreeM3, as shown in Eq. 2 :
T MS=GM+M1+M2+M3. (2)
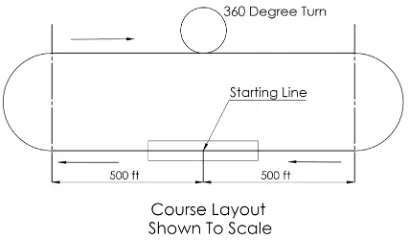
Each flight mission requires completion of a specified number of laps where each lap consists of
four individual sections: a 180◦turn, 1000 ft straight
flight with a 360◦turn, another 180◦turn and landing
at the end of specified mission time. The lap requires both left and right turns and a successful landing within the bounds of the runway. Fig. 1 shows the scheme of the official competition flight course [1].
Fig. 1.Official flight course
In Mission One the aircraft must take-off without
any payload on a 10 ft ramp at a roughly 5◦ angle,
complete three laps, and perform a successful landing in order to receive the full score shown in Eq. (3). This mission should be completed in a five minute time window. If the mission is successfully completed:
M1=1.0. (3)
In Second Mission the time frame, number of laps and take-off ramp are identical to Mission One, however, a rotating radome must be installed. The radome must start rotating at the command of a line judge while the aircraft is in flight. To receive a score as described in Eq. (4) a successful landing must be performed:
M2=1+Mintime
Ntime , (4)
where Mintime is the competition best achieved
time and Ntime team time. In third Mission, take-off
is the same as in previous missions with the added payload of attack stores, without the rotating radome. A scoring lap is one where the aircraft drops a single store on the down-wind leg of the lap. The time window for this mission is 10 minutes. The aircraft must complete a successful landing in order to get a score described by Eq. (5).
M3=2+Nscl ps, (5)
whereNscl ps is number od scoring laps. Ground
Mission is a timed mission for ground demonstrations of Missions 2 and 3. The Mission is broken down into 4 parts, two of which are timed. The first timed part is the remote command of the unfolding mechanism and the installing of the radome. Following is a non-timed demonstration of the radome rotation. The next part is a timed removal of the radome and an installation of 4 attack stores under the wing. The final part of the Ground Mission (GM) is not timed and consists of arming the aircraft and demonstrating the capability to remote drop the stores one by one, as well as the working of all propulsion and flight controls.
GM=Mintime
Ntime . (6)
The aircraft should be designed with regard to certain basic constraints. Any design is allowed except rotary wing or aircraft lighter than air. The electrical power must be provided from NiCd or NiMh batteries, no form of external take-off system is allowed. The propeller must be a commercially available model. The aircraft must be capable of carrying at least four stores under the wings, minimum 0.5 in clearance between stores and any part of the aircraft except the mounting hardware and be capable of remote detachment. The radome must be at least 12 in in diameter and a
minimum of 1inthick at the point of attachment must
be mounted on the aircraft centerline with a minimum of 3 in clearance between any part of the radome to any other part of the aircraft. It must be capable of spinning and stopping by remote command. The aircraft must be capable of taking off from a 10 ft ramp at a roughly
5◦ angle. Requirements for individual missions,
scoring equations and guidelines were inspected and translated into design parameters crucial for each
individual mission. The total score maximization
was approached with the analysis of different aircraft configurations and mission scoring. Translation of mission requirements into design requirements is shown in Table 1.
Table 1.Design parameters
Mission Problem statement Key design parameters
Ground Mission Fast mounting of attack stores and radome Time
Mission 2 High aircraft speed, secured rotating radome Power, remote rotation of radome Mission 3 High number of scoring laps, fast individual lap, take-off from the ramp Number of attack store, total weight, drag and power
1.1 Sensitivity Study of Design Parameters
The design parameters were analyzed in a quantitative way as much as possible. To achieve that, certain relationships had to be modelled mathematically. The first crucial relationship to determine was the effect of extra load on speed, endurance and take-off distance of the airplane. A mathematical model of each individual flight mission was created, which also included some
empirical data based on previous competitions [2].
Crucial identified design parameters were roughly evaluated.
Empty weight influences flight parameters (angle of attack, flight speed) and take-off requirements. Empty weight was estimated by calculating structural weight, wing weight, empennage weight
and propulsion weight. Propulsion weight was
approximated by estimating the weight of a battery pack and weight of Electric Motor (EM). A second-order equation was created to aid the comparison of weight to power for several different EM. Structural weight was roughly calculated by assessing the increase in weight for each additional
attack store. Wing weight was calculated by
finding the wing area required for the aircraft to fly. Empennage weight was estimated by calculating the desired volume coefficient. In Eq. (7) motor weight
Wmtsecond order prediction model is presented:
Wmt=km0+km1·Pmt+km2·Pmt2, (7)
wherePmt is motor power andkm0, km1andkm2
are weighting coefficients. Battery pack weightWbpis
a function of required energyEreq, cell energyEcelland
number of cellsmcell, (Eq. (8):
Wbp=EEreq
cell·mcell. (8)
Structure weightWstris calculated in Eq. (9):
Wstr=Wbase+Nattstr·ks1, (9)
whereWbase is base weight, Nattstr is a number
of attack stores andks1 weighting coefficient. Wing
weightWwingis calculated from wing area Awing and
wing surface densityρwing, Eq. (10):
Wwing=Awing·ρwing. (10)
Analogue equations are used to predict stabilizer and rudder weight. The number of attack stores is directly proportional to flight Mission 3 score, but it also increases aircraft weight due to higher required endurance and speed and the required thrust to ensure aircraft take-off from the ramp. In order to reduce stall speed and consequently the required take-off thrust, the aircraft needed to have a large wing area. Larger wing area meant larger induced drag, due to wingspan being limited and larger weight that affected take-off
distance. Stall velocityvstallis calculated from aircraft
take-off mass m, gravity constant g, air density ρ,
maximum lift coefficientCl,max and wing areaA, Eq.
(11):
vstall=
2·m·g
ρ·Cl,maxA. (11)
With every attack store, the aircraft take-off weight increased and consequently larger static thrust
was required. For every additional attack store,
an additional lap must be flown in M3, affecting the number of required battery packs to successfully complete the mission. Since mission time is limited to 10 minutes, the average speed must increase as well. A considerable aircraft limitation is the ability to take-off from the ramp. It is primarily influenced by stall speed, static thrust and aircraft weight and drag.
1.2 Aircraft Design
From three basic design configurations conventional design was chosen. With FOM analysis it was found superior to bi-fuselage and flying wing design. At first sight, the bi-fuselage configuration might offer better take-off capabilities and payload accommodation, but the team was confident to come up with other ways to increase payload capacity without negatively affecting take-off weight.
As the main configuration was chosen, the goal was to define some of the main aircraft parts
in greater detail. In order to reduce the drag
Strojniški vestnik - Journal of Mechanical Engineering 65(2019)11-12, 728-740Strojniški vestnik - Journal of Mechanical Engineering 63(2017)3, XXX-4
(a) (b)
Fig. 2.Final conceptual design; a) flightready, and b) stowed configuration
of each individual attack store while maintaining structural integrity and payload capacity, the following options were considered: round fuselage with attack stores attached without any drag reduction geometry, modified convectional fuselage design with attack stores as hidden inside as possible, and a combination of both. We chose the most aerodynamic version despite additional weight penalty. At the competition, we found that we are the only team which optimized attack stories drag by blending them into fuselage which gave us significant advance because our model was significantly faster.
Three different folding designs were compared: rotary, folding along the fuselage and collapsing wing folding; and two folding mechanisms: layered carbon spring and torsion spring. Rotary configuration consists of rotating an entire wing. Because the plane would not fit in bounding box dimensions, a fold was necessary. This demands a design of two different mechanisms; one to rotate the wing and another
one to unfold it. Wing Folding Along Fuselage:
With this positioning, we gain room in the bounding box, however, the centre of gravity moves too far back and the plane would tilt back. It is also too complicated to manufacture as it demands movement in multiple degrees of freedom. The team decided on Collapsing Wing Foldin option because the wings fold onto itself. This way the centre of gravity does not move and the same sort of mechanism is used on both wings in contrast to a rotary configuration. Two folding mechanisms were compared and tested: layered carbon spring and torsion spring. The torsion spring was chosen over the layered carbon spring due to easier implementation of the design.
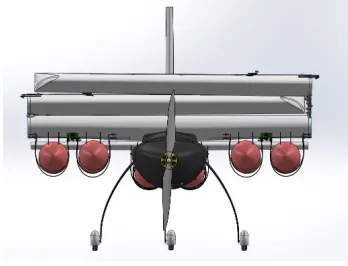
The final configuration consists of a high wing conventional aircraft with wings that can fold and roll through a 3 ft by 2 ft box, with a conventionally
designed tail that can carry up to 19 attack stores and a rotating radome. The aircraft has a conventional
landing gear and can take-off from a 10f t ramp at an
angle of 5◦. The final conceptual design is shown in
Fig. 2.
2 PRELIMINARY DESIGN
The aircraft design was further optimized by varying the parameters of the conceptual design in order
to maximize the final score. By taking into
account the sizing/design trades, aerodynamics, and mission model, the score analysis simulation (SAS),
programmed by Python computer language [3],
managed to calculate the optimal aircraft parameters and estimated mission performance.
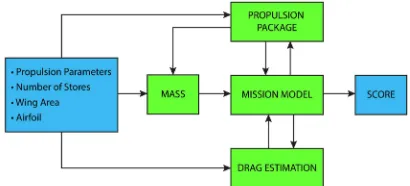
2.1 Design and Analysis Methodology
Due to its robustness and easy implementation, the iteration procedure which would yield the highest final score was used in determining the parameters of the aircraft. Over the course of the iteration, wing area, airfoils, number of attack stores and propulsion configurations (propellers, ESC, cell number, motor) were determined. The Score analysis simulation (SAS) scheme is shown in Fig. 3.
Fig. 3.Score analysis simulation diagram
Since the quantity of all parameter combinations would be too demanding for our processing capabilities, the iteration procedure was carried out in stages. In the first stage only the main parameters, such as wing area and number of attack stores, were iterated. Other parameters, such as airfoils, wingspan and empennage, were kept constant at this stage. Propulsion parameters were crudely estimated by estimating efficiency. In the second stage, the priority was to determine the optimal propulsion configuration and airfoil.
The optimal aircraft configuration was found to be the one that would perform best in mission 3, since the maximum score was not limited by the success of other competitors. Therefore the success in mission 3 was prioritized.
2.2 Design Trade Studies
The number of attack stores is directly proportional to the score achieved in mission 3. With each attack store an additional lap must be flown, which in turn meant that a faster aircraft with a heavier battery pack was needed. In Fig. 4 the relationship between the attack stores and weight can be seen.
Fig. 4. Relationship between the number of attack stores and estimated aircraft take-off weight for Mission 3
The aircraft must be able to take-off from a 10 ft ramp, which in turn meant that it must be able to achieve stall speed determined by considering aircraft take-off mass,Cl,max, lift increase by flaps, wing area,
drag coefficient and static thrust. Stall speed was determined by Eq. (11).
In Fig. 5 the relationship between the required
take-off force and wing area can be seen. The
required thrust was determined with Eq. (13) and by considering the Second Newton’s law.
The propulsion configuration was chosen through the iteration of 102 BLDC motors, 132 propellers, 10
Fig. 5.Relationship between static thrust, wing area and number of attack stores
electronic speed controls (ESC) and 3 different types of batteries. In each iteration, the of components were passed down to propulsion module, which produced the proper thrust curve for desired throttle settings. The obtained thrust curve was used as one of 4 nonlinear equations of motion of straight flight module, which is a submodule in the mission module of SAS. Propulsion module scheme along with its integration to straight flight module is presented in Fig. 6.
D, β, exp. data
Kv, I0, R
C, V, n, Imax
R, Imax Propeller
EM
Battery
ESC
Propulsion Module
Ft
Straight Flight Module (inside mission model)
Mission End
Time
Capacity Left
Throttle Setting V
Fig. 6.SAS propulsion module diagram
As mission 3 requires a 10 minute flight time at a relatively high velocity, propulsion endurance was greatly considered. SAS’s flight module offered
a time calculation of each lap. That, combined
with velocities of each lap, enabled the propulsion module to accurately determine burned battery pack capacity. Based on the required battery capacity for a 10 minute flight and high power to weight ratio, Scorpion SII-4035-450KV with APC 16x8 propeller and batteries wired two cells in parallel and 24 pairs in series 5000 mAh Turnigy cells were chosen to be the best fit for the propulsion configuration.
2.3 Mission Model
The missions were simulated by calculating the time
needed to complete each lap. A single lap was
Strojniški vestnik - Journal of Mechanical Engineering 65(2019)11-12, 728-740Strojniški vestnik - Journal of Mechanical Engineering 63(2017)3, XXX-4
simplified to four turns, two straight flights and one
take-off. Take-off vt f was modelled by solving Eq.
(13) given that the speed acquired by the end of the ramp was larger than stall speed:
mdvt f
dt =Ft−
ρv2
t f
2 ACd, (12)
vt f(t) =
2Ft
ρACdtanh
1 m
ACdFtρ
2 t
, (13)
whereCd is drag coefficient, t time and Ft trust
force. Take off time is very short and we assumed that trust forceFtis constant.
Straight flight was modeled by solving nonlinear Eqs. (14) and (15):
m·g−ρv
2
2 ClA=0, (14)
Ft(v)−ρv 2
2 ACd(Cl,Re) =0, (15)
whereFt(v)is propeller thrust. Turning flight was
simplified to take place at maximum lift the aircraft can produce. By solving Eqs. (16) and (17), turning speed
vturnand radiusRwere calculated for roll angleφ:
Ft(vturn)−ρv 2 turn
2 ACd,Cl,max=0, (16)
R=ρ 2·m
·A·Cl,max·sinφ . (17)
In Eq. (16) there was also included induced drag
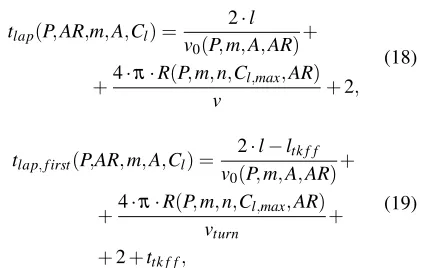
coefficientCind because of high g turn. Eqs. (18) and
(19) were later used to calculate lap times. Lap time was additionally increased by 2 seconds in order to compensate for the time needed to position the aircraft for turning manoeuvre.
tlap(P,AR,m,A,Cl) = 2·l
v0(P,m,A,AR)+ +4·π·R(P,m,n,Cl,max,AR)
v +2,
(18)
tlap,f irst(P,AR,m,A,Cl) =v 2·l−ltk f f 0(P,m,A,AR)+ +4·π·R(P,m,n,Cl,max,AR)
vturn +
+2+ttk f f,
(19)
whereARis wing aspect ratio, llength of single
lap andttk f f time required for take-off.
2.4 Aircraft Lift, Drag and Stability Characteristics
Choosing the correct airfoil was crucial for a fast and stable aircraft. The airfoil was chosen primarily
onCl,max due to extreme take-off requirements. The
aircraft must take-off from 10 ft ramp, with velocity
close to stall speed where Reynolds number isRe≈
3·105. To be on safe side airfoils were analyzed at
Reynolds number of Re=2·105. The three most
promising airfoils were chosen using SAS, they are shown in Fig. 7.
Fig. 7.Airfoil polars
Cl and Cd are airfoil lift and drag coefficients.
Finally, ClarkY (Fig. 8) was chosen for the final aircraft, since GOE387 was considered to be too thick and Eppler420 was having questionable characteristics at a lower Reynolds number. Airfoil polars were
obtained from Airfoil tools [4].
Fig. 8.ClarkY airfoil
The lift and drag analysis was carried out in 2 separate stages. During the iteration procedure the AVL analysis was too demanding, so cruise lift and drag coefficients, and max lift coefficients were calculated based on airfoil polars [4].
Drag coefficients from other components, such as the fuselage, were acquired by assuming turbulent flow
and using Schlighting’s empirical equation [5] for skin
friction drag. Drag from attack stores was determined experimentally. The described empirical function was properly adjusted in order to coincide with the drag coefficient values obtained from experiments. Drag contributions can be seen in Fig. 9.
Table 2 contains the lift and drag coefficients of initial optimal aircraft design. Since our main concern was the ability of the aircraft to take-off from the ramp, it was necessary to account for flaps in
0.60% 0.90% 1.08%
9.70%
11.35%
27.84% 48.40%
Rudder
Elevator
Induced
Wing
Fuselage
Other
A�ack Stores
Fig. 9.Drag contributions
Table 2.Initial lift and drag estimations during iteration process using SAS
Parameter Cl,max Cl,avg Cd,avg Value 1.75 0.16 0.07
calculation of Cl,max lift coefficient. Due to attack
stores being dropped in each lap the total drag of the aircraft was decreasing. By experimentation, we confirm the thesis that drag from wing-mounted attack stores was significantly larger than the drag from fuselage-mounted attack stores.
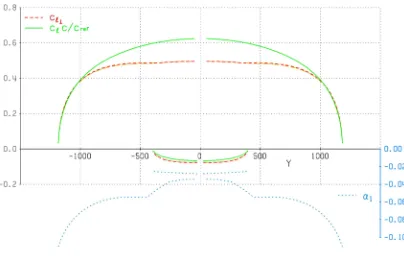
Fig. 10.Lift distribution
AVL [6] was further used to perform Treffz plane
analysis that enabled the determination of trimmed flight conditions as well as lift distribution across the wing and horizontal tail. The green curves in Fig. 10 denote normalized lift distributions across the wing and tail for M3. The result applies to cruise flight at 91.7 ft/s.
2.5 CFD Analysis
Several aerodynamic characteristics of the final model were determined with the use of computational fluid dynamics (CFD). The team was interested in determining the influence of the wingtip geometry on
lift and drag coefficients, as well as in calculating the aforementioned aerodynamic coefficients pertaining to the airplane fuselage. In both cases, CFD simulations were done using OpenFOAM for Windows 18.02 (version 1) [7].
The primary objective of fuselage analysis was to determine drag coefficient of the fuselage as a function of the free stream velocity. The computational mesh utilized in this simulation was based on the geometry of the bare airplane fuselage with no other aerodynamic surfaces and attack stores attached. A graphical representation of the calculated airflow velocity field and static pressure field acting on the airplane fuselage is shown in Fig. 11:
Fig. 11.Airflow velocity field and pressure field forv= 82.0 ft/s
We solved the momentum equations using the in-built SIMPLE algorithm (simpleFoam), and we
used thek−ωSST (Shear stress transport) turbulence
model as a means of equation closure. We resolved the boundary layer close to the wall with a very fine
computational mesh (y+<10). Computations were
done for free stream velocities of v1 = 49.2 ft/s and
v2= 82.0 ft/s.
Table 3.Additional relevant parameters for CFD analysis
Parameter ρ[lb/f t3] ν[f t2/s] Are f[f t2] Value 0.0765 16.2·10−5 27.0·10−2
The reference surface area Sre f, defined for
this calculation, is understood to be the fuselage cross section at the position of its maximum value. Additional parameters relevant to the simulation are displayed in Table 3.
Table 4.CFD analysis calculated aerodynamic coefficients
Parameter Value v[f t/s] 49.2 82.0 Cd[/] 0.361 0.357 Cl[/] -0.0427 -0.0525
Strojniški vestnik - Journal of Mechanical Engineering 65(2019)11-12, 728-740Strojniški vestnik - Journal of Mechanical Engineering 63(2017)3, XXX-4
Lift and drag coefficients, calculated via the simulation, are displayed in Table 4.
2.6 Wing Tip Analysis
The primary objective of the wing tip analysis was to determine the wing tip lift and drag coefficients as functions of the airflow velocity and wingtip geometry, that are characterized by the characteristic wingspan distance between the upper and lower edge of the wing
tip facet, which we denote as lw,ch . Computations
were made for the free stream velocity of v = 49.2
ft/s and characteristic lengths lw,ch of 0 in, 2.76 in,
3.94 in and 5.12 in. Computational meshes utilized in this simulation were based on the geometry of
the outer portion of the wing measuring l = 31.7 in
in length. The simulation settings were identical to those described in the previous section. The reference surface areaSre f, in this case, is the wing cross section
normal to the lift direction. Additional parameters which are relevant to the simulation are displayed in Table 5.
Table 5.Additional parameters
Parameter ρ[lb/f t3] ν[f t2/s] Are f[f t2] Value 0.0765 16.1·10−5 3.77
Lift and drag coefficients calculated via the simulation are displayed in Table 6.
Table 6.Calculated lift and drag coefficients
Parameter Value
lw,ch[in] 0 2.76 3.94 5.12
v[ft/s] 49.2 49.2 49.2 49.2 Cl[/] 0.434 0.434 0.444 0.446 Cd[/] 0.0304 0.0302 0.0310 0.0312
Airflow velocity field and static pressure field acting on the wing tip are graphically represented in Fig. 12.
Fig. 12.Airflow velocity field and pressure field forlw,ch= 2.76 in
The wing tip geometry was consequently chosen on the basis of simulation results, which suggest that there is an optimal characteristic length where the drag coefficient is minimal. It was concluded that out of the four wing tip geometries simulated, the second case
(lw,ch=2.76in.) has the most favourable aerodynamic
characteristics considering its coefficient of drag is lower than for the other three.
2.7 Stability and Control
One of the main issues was the aircraft stability. Due to a large centre of gravity (CG) uncertainty, a large CG envelope was required as well as a small aspect ratio. Stability derivatives were calculated via AVL and are located in Table 7 for M2 and Table 8 for M3.
Table 7.Static stability at take-off for M2
α β p q r
Cl -0.0 -0.022 -0.41 -0.0 0.064 Cm -3.327 0.00 0.00 -28.93 -0.00 Cn -0.00 0.15 0.010 -0.0 -0.227
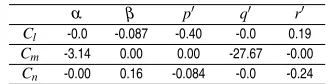
Table 8.Static stability at take-off for M3
α β p q r
Cl -0.0 -0.087 -0.40 -0.0 0.19 Cm -3.14 0.00 0.00 -27.67 -0.00 Cn -0.00 0.16 -0.084 -0.0 -0.24
For both missions, the derivatives were calculated at take-off speed. The neutral point for M3 was calculated at approximately 10.6in behind the leading edge of the wing, making the aircraft longitudinally stable according to Table 11. In M2 the effect of radome must be considered. We simulated this effect by replacing it with a lifting surface with similar surface area, as seen in Fig. 13.
Fig. 13.AVL geometry with radome attached
matrix for an empty and a loaded aircraft are shown in Table 9.
All poles of the system matrix except one, indicating spiral instability, lie in the left half of the plane (shown in Fig. 14), which indicates stable modes. Even though the aircraft is considered spirally unstable, the spiral mode time constant isTS,M2= 24.4 s andTs,M3 = 27 s, which gives pilot enough time to compensate.
Fig. 14.Real and imaginary components of eigenvalues for M2 and M3
3 DETAIL DESIGN
In accordance with all demands for aircraft design, the first draft was proposed. In Table 10 gross aircraft dimensions are presented.
The fuselage design was chosen based on testing, done in the wind tunnel. The final design enables attack stores mounted under the fuselage to produce minimal drag force as shown in Fig. 15. The front section was shaped aerodynamically to accommodate all propulsion components as well as the necessary
equipment to enable RC capabilities. From the
initial part the fuselage tappers towards a shape that enables the stores to have as much ground clearance as possible. Design shown in Fig. 15 enables the attack stores to be as hidden from the airflow as possible, while still maintaining a high moment of inertia.
To ensure that the wing weighs as little as possible and the shape is kept as close to the original profile and end design as possible, each section was made from a separate mould. Critical points were additionally reinforced with a carbon fibre mesh to ensure structural integrity.
The team wanted to go with a full carbon fibre design due to improved mechanical characteristics but decided against it as it would be too cost-prohibitive.
Fig. 15.Fuselage side view
The main structural support along the wings is provided by a vertically mounted balsa wood profile and carbon fiber mesh at the top and bottom part of the balsa wood with additional herex foam and fiberglass composite ribs for added structural rigidity. The flaps are located on the center plane of the wing, while ailerons are mounted as close to the edge of the wings as possible. The flaps follow a classic design as it was determined that more complex designs, such as Fowler flaps, are not necessary.
Fig. 16.Stowed configuration of the aircraf
The design shown in Fig. 16 enables a maximal wingspan while still maintaining centre of gravity at the same spot as when in the flight-ready configuration. This design permits the undercarriage to be as far forward as possible. The wings fold on top of the other as shown in Figure 16 to ensure the smallest possible stowed dimensions. The point of rotation of one wing is raised compared to the other, to enable the aforementioned stacking.
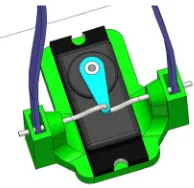
The momentum required is provided by two torsion springs on each wing, attached to the reinforced surface on the wings as shown in Fig. 17. Once the folding part crosses over the vertical point, the spring stops providing momentum and the force of gravity forces the wing to the final position where it is mechanically locked by three hooks on each side that hook to the underside of the wing.
The radome is attached behind the wing at the top of the aircraft, as shown in Fig. 18, to enable the
Strojniški vestnik - Journal of Mechanical Engineering 65(2019)11-12, 728-740Strojniški vestnik - Journal of Mechanical Engineering 63(2017)3, XXX-4
Table 9.Dynamic stability of empty and loaded aircraft
Eigenvalue Damping ratio Undamped frequency [Hz]
Longitudinal modes M2 M3 M2 M3 M2 M3
I Short Period −17.59±i15.39 −5.15±i5.47 0.659 0.73 23.37 7.51 II Phugoid −0.061±i0.45 −0.047±i0.47 0.991 1.00 0.45411 0.47
Lateral modes M2 M3 M2 M3 M2 M3
III Dutch Roll −2.98±i8.94 −1.05±i3.70 0.95 0.96 9.4236 3.85
IV Roll −28.501 −10.48 / / / /
V Spiral 0.041 0.037 / / / /
Table 10.Final aircraft dimensional characteristics
Fuselage Vertical Tail
Total Length [in] 77.55 Airfoil NACA 0010
Nose Length [in] 19.68 Span [in] 12.6
Tail Length [in] 57.87 Chord-base [in] 10.24
Width [in] 9.05 Chord-tip [in] 7.87
Height [in] 7.08 Wing area [in2] 114.1
Wing Aspect ratio 3.74
Airfoil CLARK Y Angle of attack [◦] 0
Span [in] 95.27 Horizontal tail
Chord-base [in] 19.68 Airfoil NACA 0010
Chord-tip [in] 15.75 Span [in] 31.50
Wing area [in2] 1627 Chord-base [in] 10.24
Aspect ratio 5.38 Chord-tip [in] 7.87
Angle of attack [◦] 3.5 Wing Area [in2] 285.2
Aspect ratio 3.48 Angle of attack [◦] 0
Fig. 17.Actuator torsion springs
least interference in flight. It enables easy assembly during the Ground Mission and while mounting the wing to the fuselage. An electric motor is attached within the fuselage and provides continuous rotation when necessary. The attachment point of the radome is a threaded nut attached to a threaded rod, with minimal thread engagement to ensure a fast mounting time crucial during the Ground mission. A 3D printed bushing, shaped as an aerodynamic drop, enables smooth rotation.
Each attack store is mounted on two carbon fibre sheets that act as a part of mounting hardware. The
Fig. 18.Rotating radome position
quick-release mechanism consists of plastic zip ties, attached to the wing at one end and a wire at the other.
Fig. 19.Attack store mounting
To release the store, the wire is pulled by a servomotor to disengage the wire and the attack store as shown in Figs. 19 and 20. To mount each store the plastic zip ties are tightened and the attack stores are squished to the mounting sheets.
Fig. 20.Attack store quick release
3.1 Weight and Balance
The correct centre of gravity (CG) location is crucial to achieve aircraft stability during flight. CG was determined by considering the weight of all aircraft components and their location on X axes. The weight of components was estimated based on CAD model or manufacturer specifications. The CG of aircraft in flight-ready configuration was calculated to be 17.91 in relative to X axis, as seen in Fig. 21.
81.34
16.20
6
7.
2
3.36 15. 76
19.81
15.82
10.24 7.87
17.91 X Y
Fig. 21.Airplane centre of gravity, units [in]
Table 11 contains complete weight and balance data for all flight missions. Flight parameters for each individual mission are gathered in Table 12 where Cl,avgis average lift coefficient andCd,0zero lift drag
coefficient.
4 TESTING AND COMPETITION
A number of tests of key components are necessary to compare theoretical knowledge and predictions to real life situations and to achieve the top scores. Testing enables a quick check for errors in decision making, regarding aerodynamic performance, stability, control and propulsion performance. Detailed and extensive testing objectives were proposed for that purpose.
The purpose of the initial tests was to improve the accuracy of SAS as seen in Fig. 3, later tests served as a validation of proposed changes based on the initial tests. Laboratory and field tests were performed.
To determine the effects of aerodynamic drag of the attack stores attached to the wings and the fuselage we conducted a wind tunnel test. The aim was to understand the relationship that the stores have on the flight dynamics, drag and take-off distance. Drag force was measured with an external scale, velocity was measured with Pitot tube as in Fig. 22 . It was
Table 11.Airplane weight and balance
Aircraft component Weight [lb] X [in] M1
Fuselage 1.95 31.4
Wing 4.08 19.2
Tail 0.82 72.6
Motor 0.96 -1.3
Propeller 0.13 -3.1 Flight batteries 7.61 10.4 Front landing gear 0.29 3.2 Rear landing gear 0.71 20.3 Miscellaneous 1.05 20
Total 17.6 17.9
M2
Rotating radome 0.08 34.6 Flight batteries 7.61 10.2
Total 17.68 17.9
M3
Attack store #1 0.1375 11.2 Attack Store #19 0.1375 66.4 Flight batteries 7.61 8
Total-start 20.21 18.9 Total-finish 17.6 17.9
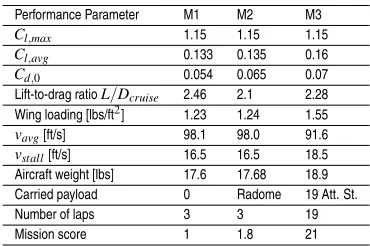
Table 12.Performance parameters for final design
Performance Parameter M1 M2 M3
Cl,max 1.15 1.15 1.15
Cl,avg 0.133 0.135 0.16
Cd,0 0.054 0.065 0.07
Lift-to-drag ratioL/Dcruise 2.46 2.1 2.28 Wing loading [lbs/ft2] 1.23 1.24 1.55 vavg[ft/s] 98.1 98.0 91.6
vstall[ft/s] 16.5 16.5 18.5
Aircraft weight [lbs] 17.6 17.68 18.9 Carried payload 0 Radome 19 Att. St.
Number of laps 3 3 19
Mission score 1 1.8 21
found that attack store in a free-stream has high drag
coefficient Cd,as =0.32 [8]. The aircraft will have
much lower drag if stores are hidden from air-stream by putting them in the line attached on the fuselage than locating them on the wing and accumulating enormous drag.
Strojniški vestnik - Journal of Mechanical Engineering 65(2019)11-12, 728-740Strojniški vestnik - Journal of Mechanical Engineering 63(2017)3, XXX-4
Fig. 22.Attack store during drag testing
attack stores as is presented in Fig. 23. It was found that with 10 stores (five in file, two in the line) drag coefficient of fuselage was still in the rangeCd,f s=0.2
Fig. 23.Fuselage drag measurement in wind channel
4.1 Test Flights and Fly-off
In order to understand the aircraft flight capabilities and increase pilot familiarity with the chosen design, numerous flight tests were conducted with a purpose-build Arduino-based data collection system with an SD-cared based storage unit on board. In this way, the team gained better insights into the flight characteristics, instead of pilot feedback only. During the majority of the tests the system was mounted on the aircraft and recorded GPS data, height, velocity, accelerations, voltage and current.
At the testing, it was found that aircraft with a maximum of 19 attack stores shows instability
in flight but was still manageable. In presented
configuration was found that during flight Mission 3, aircraft is capable of safely scoring just 17 laps in 10 minutes time slot. The problem was located in the unpredictability of NiMh cells (mandatory usage) internal resistance. The team decided to fly a third Mission at competition with the same number of attack stores.
At TIMPA Field in Tucson, Edvard Rusjan team successfully finish all missions at first flying day of
competition without notable problems. Despite 10 % lower air density in Tucson than in Ljubljana, aircraft was capable of performing take-off with full weight from the ramp. In Fig. 24 moment of aircraft take-off from the 10 ft ramp is presented.
Fig. 24."Pretty Boy" take-off at TIMPA field in Tucson
The aircraft successfully finished the third flying
mission with 17 attack stores and 12th of April
officially finished all task with huge advance regarding to other teams. In Fig. 25 "Pretty Boy" aircraft was shown flying 17 attack stores onboard.
Fig. 25."Pretty Boy" at TIMPA Field in Tucson with 17 attack stores
Still, team members were not satisfied with results and wanted to return to the competition to repeat Mission 3 and improve the result. Residual cell energy capacity after the third mission was measured and was found that there is no enough energy left in battery cells for an additional lap. Decision was made to extend battery pack with 4 additional cells and try to fly 18 laps. Battery and software upgrade was done on
April 13th. Pilot was warned that in new configuration
take-off. On April 14th, last day of competition, team pilot Timotej Hofbauer scored 18 laps in 10 minutes time slot which was an absolute record of the competition.
5 CONCLUSIONS
Edvard Rusjan team from Faculty of Mechanical Engineering, University of Ljubljana, Slovenia is the winner of DBF 2019 competition. The success is result of strict scientific approach in optimizing of aircraft design to maximize its score in the competition. Team developed semi-analytic multidimensional algorithm for aircraft geometry and functionality optimization. With measurements of prototypes performance in flight and in wind tunnel algorithm coefficients value were fine tuned. By measurement of attack stores drag it was found that the best position is in line on the fuselage instead on widely accepted wings. New arrangement was found to have much lower drag and enables higher aircraft velocities with the same trust force. With the fundamental advantage in lower aerodynamic drag, aircraft of Edvard Rusjan team at final fly-off at TIMPA Field in Tucson scored 18 laps in 10 minutes time slot. Second best team from Georgia Institute of technology was 22 % slower and finish with 14 scored laps.
6 ACKNOWLEDGEMENTS
Members of Edvard Rusjan team are specialist for wide fields of activities, from process modelling, CAD/CAM, composite structure building, etc. Every member has the unique task and just as a group they are successful. Author of the paper would like to thank every member of the team for their contribution to team success.
List of Edvard Rusjan team members (Faculty of Mechanical Engineering, University of Ljubljana,
Slovenia), which attended the final fly-off
Design/Build/Fly Competition at TIMPA Field in Tucson, AZ from April 11 to 14, 2019 and won competition: Timotej Hofbauer (pilot and student leader), Vid Pugelj, Viktor Govže, Matej Gorjan, Jaka Romih, Nejla Kambiˇc, Emil Zubalic, Martin Kocijanˇciˇc, Filip Plešnik, Klemen Ambrož, Andraž Vene, Tilen Košir, Enej Isteniˇc, Patrik Tarfila, Klemen Mlakar, Andraž Kladnik, and Viktor Šajn as Faculty advisor. In Fig. 26 is Edvard Rusjan team at DBF 2019 winner announcement.
Fig. 26.DBF 2019 winning Edvard Rusjan team
7 REFERENCES
[1] DBF Rules 2018-2019. AIAA [online], Previous Competitions, from http://www.aiaadbf.org/, accessed on 2019-11-13.
[2] Edvard Rusjan Team (2019). Pretty Boy, AIAA Design/Build/Fly, 2018-2019 Design Report. AIAA [online], Previous Competitions, from
http://www.aiaadbf.org/, accessed on 2019-11-13. [3] PythonCoreTeam (2019). Python: A dynamic open
source programming. Python Software Foundation [online], from https://www.python.org, accessed on 2019-11-13.
[4] Airfoil tools (2017). Airfoil database [online], from
http://airfoiltools.com/, accessed on 2019-11-13. [5] Schlichting, H. (1979). Turbulent Boundary Layers
at Zero Pressure Gradient; Flat Plate; Rotating Disk; Roughness, Boundary Layer Theory. 7th ed. McGraw-Hill, New York, p. 635-667.
[6] Drela, M., Youngren, H. (2017). Athena Vortex Lattice [Computer software]. from
http://web.mit.edu/drela/Public/web/avl/, accessed on 2019-11-13.
[7] Greenshields, C.J. (2019). OpenFOAM, User Guide, ver. 7. OpenFOAM Foundation Ltd.[online], from
https://openfoam.org, accessed on 2019-11-13. [8] Anderson, J.D.Jr. (2011). Fundamentals of inviscid
incompressible flow.Fundamentals of Aerodynamics. 5th ed., McGraw-Hill, New York, p. 177-276.