DEMOGRAPHIC RESEARCH
VOLUME 30, ARTICLE 40, PAGES 1157-1188
PUBLISHED 10 APRIL 2014
http://www.demographic-research.org/Volumes/Vol30/40/ DOI: 10.4054/DemRes.2014.30.40
Research Article
Anticipatory child fostering and household
economic security in Malawi
Lauren K. Bachan
c
2014 Lauren K. Bachan.
2 Households and child fostering in sub-Saharan Africa 1159
3 Household economics and fostering 1160
3.1 Epidemiological context 1161
3.2 Competing hypotheses on economic outcomes for receiving households 1162
4 Data, measures, and methods 1163
4.1 Data 1163
4.2 Measures 1164
4.2.1 Household wealth 1164
4.2.2 Child fostering 1165
4.2.3 Control variables 1167
4.3 Analytic approach 1167
5 Results 1168
5.1 Multivariate analysis 1170
5.1.1 Fostering as a binary status 1171
5.1.2 Fostering conditioned by anticipation 1171
6 Summary and discussion 1175
7 Acknowledgments 1178
References 1179
Appendix A: Supplementary tables 1184
Anticipatory child fostering and household
economic security in Malawi
Lauren K. Bachan1
Abstract
BACKGROUND
While there is a rich literature on the practice of child fostering in sub-Saharan Africa, little is known about how fostering impacts receiving households, as few studies con-sider household conditions both before and after fostering. Despite the fact that circum-stances surrounding fostering vary, the literature’s key distinction of fostering is often drawn along the simple line of whether or not a household is fostering a child. This paper argues that anticipation of fostering responsibilities, in particular, is a useful dimension to distinguish fostering experiences for receiving households.
OBJECTIVE
This paper examines the relationship between receiving a foster child and subsequent changes in household wealth. Particular emphasis is placed on how these changes are conditioned by differing levels of anticipation of the fostering event.
METHODS
This study uses data from Tsogolo la Thanzi (TLT), a longitudinal survey in Balaka, Malawi. Using data from 1754 TLT respondents, fixed effects pooled time-series mod-els are estimated to assess whether and how receiving a foster child changes household wealth.
RESULTS
This paper demonstrates the heterogeneity of fostering experiences for receiving house-holds. The results show that households that anticipate fostering responsibilities experi-ence a greater increase in household wealth than both households that do not foster and those that are surprised by fostering.
1The Pennsylvania State University. 211 Oswald Tower. University Park, PA 16802, USA. Tel: 617-997-9078.
CONCLUSION
Households that anticipate fostering responsibilities exhibit the greatest increase in house-hold wealth. While fostering househouse-holds that do not anticipate fostering responsibilities may not experience these gains, there is no evidence to indicate that such households are negatively impacted relative to households that do not foster. This finding suggests that additional childcare responsibilities may not be as detrimental to African households as some researchers have feared.
1.
Introduction
Child fostering—the custom of children living outside of the natal home—is practiced throughout much of sub-Saharan Africa (Bledsoe 1990; Bledsoe and Isiugo-Abanihe 1989; Goody 1982; Madhavan 2004; Monasch and Boerma 2004; Urassa et al. 1997). Although the practice varies from region to region, fostering is commonly thought to be a mutually beneficial arrangement between sending and receiving households (Bled-soe 1990; Caldwell 1997; Drah 2012; Isiugo-Abanihe 1985). Empirical work recognizes child fostering as a strategy African households use to distribute the cost of childrearing and offset economic insecurities by sending children to be fostered by other households (Akresh 2005; Eloundou-Enyegue and Shapiro 2004).
Three facts about child fostering have been well established in the qualitative and ethnographic literature but are underdeveloped in survey research. First, child fostering is part of a larger negotiation process that takes place among extended family networks (Akresh 2005; Caldwell 1997). Second, receiving a foster child happens under a variety of circumstances (Bledsoe and Isiugo-Abanihe 1989; Goody 1982). Third, ethnographies further suggest that households that receive foster children benefit from the added labor of the foster child and from the social insurance of investing in other people’s children (Bledsoe 1990; Caldwell 1997). However, the tangible benefits for receiving families remain largely unexplored and are less established in quantitative research.
into how receiving households are affected by child fostering and how the heterogeneity of the fostering experience differentially contributes to household economic outcomes.
2.
Households and child fostering in sub-Saharan Africa
Households are units that consist of individuals who make joint decisions regarding con-sumption and production, labor force participation, savings, and capital acquisition (Becker 1991). The description of a household as an economic unit is particularly rele-vant in much of sub-Saharan Africa, where subsistence agriculture is a primary livelihood for many people. Household structure in sub-Saharan Africa tends to be complex, with members extending beyond the nuclear family. While the specifics vary from society to society, households containing multiple generations (vertical complexity) and extended family members (horizontal complexity) are common throughout the region (Bongaarts 2001; McDaniel and Zulu 1996; Van de Walle 2006).
Child fostering adds to the compositional complexity of households in sub-Saharan Africa. Unlike Western societies, where fostering is regulated by state governments, the vast majority of child fostering in Africa is akin to informal parenting, namely when a child is reared by another family (or multiple families) for extended periods of time in the absence of government intervention (Goody 1982). Much of the classic fostering lit-erature focuses on West Africa, but the practice of child fostering is widespread across other regions of Africa as well (Bicego, Rutstein, and Johnson 2003; Madhavan 2004; McDaniel and Zulu 1996; Monasch and Boerma 2004; Urassa et al. 1997). Furthermore, fostering in Africa takes place under a variety of circumstances. Children are fostered when their natal parents can no longer fulfill their parental roles because of illness, di-vorce, or death (Goody 1982). Foster children are also frequently sent to live with non-natal family members as part of a deliberate, and often mutually-beneficial, arrangement (Madhavan 2004; McDaniel and Zulu 1996).
3.
Household economics and fostering
Studies of the various purposes of child fostering have emphasized that the practice of sending and receiving children is a strategy households employ to distribute the costs and benefits of children. In other words, child fostering is one way in which households can offset economic insecurities (Akresh 2005; Caldwell 1997; Eloundou-Enyegue and Shapiro 2004; Isiugo-Abanihe 1985). Such frameworks imply that the consequences of fostering for receiving households should be measured in economic terms. However, de-spite the theoretically established economic links between receiving and households, the questions of whether and to what extent fostering triggers changes in wealth for receiving households remain unanswered.
This gap stems from two fundamental characteristics of the literature. First, since the onset of the AIDS epidemic in the region, research on fostering in Africa has almost en-tirely focused on the educational, health, and developmental disadvantages of children— particularly of orphans (Beegle et al. 2010a; Beegle et al. 2010b; Case et al. 2004; Cluver et al. 2007; Cluver and Orkin 2009; Deininger et al. 2003; Monasch and Boerma 2004; Subbarao et al. 2001; for a notable exception, see Ainsworth and Filmer 2006). Evidence that foster children—especially those who are not biologically related to the household head—face disadvantages has given the impression that households have been struggling to meet the demands of fostering. However, there are reasons to believe that fostering is not overwhelming families. In the face of the AIDS epidemic, households have shown a remarkable ability to care for both orphaned and non-orphaned foster children (Caldwell 1997; Grant and Yeatman 2012; Hosegood et al. 2007a; Monasch and Boerma 2004).
Second, the small literature thatdoes consider fostering and household economics focuses primarily on the absolute differences between fostering and non-fostering house-holds.2 From this body of research we know that foster children tend to live in wealthier
households (Beegle et al. 2010a; Bicego, Rutstein, and Johnson 2003; Weinreb, Gerland, and Fleming 2008), suggesting that selection effects are key in understanding foster child placement. However, without explicitly measuringchangein wealth in response to fos-tering a child, we cannot discern with any certainty whether foster children are initially placed in wealthier households or whether households become wealthier as a result of receiving.
Further complicating matters is the fact that empirical research treats fostering con-ceptually and methodologically as an “unanticipated shock” (literally, such as in Deininger et al. 2003). Much of the broader literature, however, indicates that fostering happens
un-2One notable exception comes from a case study in Uganda, for which researchers used two waves of panel
der a variety of circumstances (Goody 1982; Madhavan 2004; McDaniel and Zulu 1996), and research on decision-making and networks in Africa suggests that fostering a child isnotnormally an unanticipated shock. Rather, fostering is part of a process of constant negotiation and risk-assessment, in which social networks and extended family play inte-gral roles (Akresh 2005; Caldwell 1997). Foster parents often volunteer to take children (Bledsoe and Isiugo-Abanihe 1989) or, at a minimum, anticipate that they will do so in the future (Johnson-Hanks 2006; Ntozi 1995; Trinitapoli and Weinreb 2012). Such evidence suggests that anticipation is an important dimension by which to examine the fostering experiences of receiving households.
3.1 Epidemiological context
Over the past 30 years the AIDS epidemic is thought to have disrupted the long-standing fostering process by increasing the number of orphans.3 Evidence that less-preferred types of caretakers (e.g., poor or non-traditional family members) are beginning to play a larger role in fostering children (Howard et al. 2006; Nyambedha, Wandibba, and Aagaard-Hansen 2003) indicates that AIDS has altered the normative patterns of foster-ing. For instance, in her in-depth study of three communities across Botswana (a country with high HIV-prevalence), Dahl (2009) finds that many community members believe that traditional kin-based fostering is failing to provide sufficient care for children.
Despite any disruptions to fostering in the context of the AIDS epidemic, the nature of the disease may have elongated the fostering negotiation/expectation process, making anticipation of fostering responsibilities a pertinent dimension by which to evaluate if and how receiving a foster child impacts household wealth. AIDS has a long latent period, and its symptoms are almost certainly diagnosed by family members and friends as the disease progresses. Sick parents make contingency plans for their children in preparation for their own impending mortality (Klaits 2010). For example, when Malawian parents know they are HIV positive, they are more likely to invest in their children’s future by enrolling them in school (Grant 2008). Across sub-Saharan Africa, children are at the forefront of AIDS-related decision making and conversations (Dahl 2009). In rural Malawi, people recognize AIDS as a “profound danger” to children (Watkins 2004:694) and often evoke child wellbeing into the discourse on prevention strategies (Smith and Watkins 2005; Watkins 2004).
3Between 1990 and 2009, the number of children in sub-Saharan Africa who were orphaned due to AIDS
3.2 Competing hypotheses on economic outcomes for receiving households
In the simplest terms there are two ways in which fostering a child could impact the wealth of a receiving household: Wealth could either increase or decrease in response to fostering. Existing empirical and theoretical evidence lends support for both competing possibilities.
Drawing from Caldwell’s wealth flow theory (1976; 1983), which acknowledges the unique value of children in developing settings, fostering a child may increase household wealth through added domestic labor. Foster children (especially girls) can be sources of cheap domestic labor within fostering households (Ainsworth and Filmer 2006; Bledsoe 1990; Goody 1982), freeing up time for other household members to participate in eco-nomically productive endeavors.4 Benefits of fostering can also extend beyond what a household receives from the foster child. Mende grandmothers in Sierra Leone and Igbo women in Nigeria often receive food and money from natal parents in return for fostering their grandchildren (Bledsoe and Isiugo-Abanihe 1989; Isiugo-Abanihe 1985). In other contexts, people who take in children from outside their kin group do so with the explicit expectation of receiving material compensation (Dahl 2009). Taken together, this evi-dence suggests the following:
Hypothesis 1:Household wealth will increase in response to receiving a foster child.
Adding a young dependent to a household could, on the other hand, drain family re-sources leading to a decrease in household wealth. This may be especially true when households are already impoverished and/or when fostering takes place in response to a family crisis. Households that foster children in response to parental illness or death often suffer financially, as other ill effects of a family crisis (e.g., funeral and/or medical costs) are exacerbated by increased dependency ratios (Hosegood et al. 2007b). Additionally, the current AIDS epidemic and resulting increase in the number of orphans in the re-gion may be intensifying the challenges foster families face (Grant and Yeatman 2012; Hosegood et al. 2007b). Recent studies show that in high HIV-prevalent areas, poorer households are playing a larger role in child fostering today than they have in the past (Bicego, Rutstein, and Johnson 2003). While we have thus far been unable to establish if these households were poor when they began fostering or became poorbecauseof
foster-4Wealth flow perspectives also highlightdisincentivesfor natal families to out-foster their children. Because
ing, the following could be true:
Hypothesis 2:Household wealth will decrease in response to receiving a foster child.
4.
Data, measures, and methods
4.1 Data
To test these competing hypotheses, this study focuses on Malawi, a country with a strong tradition of child fostering (Bandawe and Louw 1997; Munthali 2002). In 2010, approxi-mately 28% of households were fostering a child under the age of 18 (National Statistical Office and ICF Macro 2011). Malawi is experiencing one of the most severe AIDS epi-demics in sub-Saharan Africa, with an adult prevalence rate estimated at 11%. AIDS alone has orphaned more than half a million children in the country (UNAIDS 2010). Because institutionalized foster care is considered a last resort in Malawi, the majority of additional child care responsibilities resulting from the AIDS epidemic takes place within households (Munthali 2002).
The data used come from Tsogolo la Thanzi (TLT), a panel study fielded in the Balaka district of southern Malawi. TLT collected eight waves of data at four-month intervals between June 2009 and January 2012 from an initial random sample of 1500 female and 600 male respondents (initial response rate of 95.6%). Respondents were randomly selected from a sampling frame of 15- to 25-year-olds living in census enumeration areas within seven kilometers of the district capital—an area including Balaka township and the surrounding rural villages. I use data from Waves 1-8, making adjustments to the data structure to reflect the sequencing of events and the changes being measured (discussed in greater detail below).
Three features make the TLT data uniquely suitable for assessing changes within households. First, TLT gathers both individual-level characteristics and household-level information, including ownership of household goods and household rosters, which each respondent updates at every wave. Second, the longitudinal design is optimal for measur-ing change over time. Finally, the short intervals between survey waves allow economic fluctuations to be examined over brief periods of time, something researchers are often unable to examine in panel studies in which years pass between data collection waves.
the respondent’s characteristics (e.g., income, education, etc.) reasonably reflect their household.
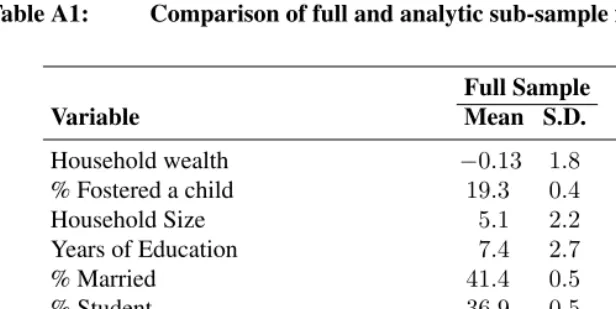
I restrict the TLT sample in four ways. First, to accommodate my analytic approach (discussed below), I omit data from Wave 1—with the exception of the anticipation measure—from the analysis. This omission results in the exclusion of 143 individuals who only contributed data to Wave 1 or who provided fewer than two waves of data in Waves 2-8 (the average number of waves per respondents is 6.3). Second, because I am interested in households, I remove 41 respondents who are living primarily in educational institutions (e.g., boarding schools or universities) rather than a traditional household. Third, 119 households in the TLT sample contain more than one respondent. In these cases I randomly select one member to represent his or her household. This results in re-moving 129 respondents.5 Finally, I further restrict the sample to respondents for whom complete information was available on the measures used in this analysis. Missing data are rare and employing listwise deletion removed an additional 13 respondents, result-ing in a final study sample of 1754 individuals who contribute 10,987 person-waves to the pooled data. As shown in Appendix A (Table A1), the initial and analytic samples are quite comparable, suggesting that sample selection bias is not introduced by these restrictions.
4.2 Measures
4.2.1 Household wealth
The outcome measure is the household’s wealth. Wealth is measured on a linear index comprising nine durable goods and one household asset. Unlike wealth indices that in-clude several structural assets (e.g., flooring material, water supply, sanitation, etc.), this index relies heavily on durable goods within the household in order to better capture eco-nomic fluctuation over the relatively short timespan of the study. The goods used in the index include a bed with a mattress, a television, a radio, a landline or mobile phone, a re-frigerator, a bicycle, a motorcycle, an animal-drawn cart, and an automobile. The wealth measure also considers whether or not the household has electricity.
Weights are calculated for each asset using principal-components analysis following the same procedure used to construct the Demographic Health Survey wealth index. The resulting index places households on a continuous scale relative to the sample (Filmer and Pritchett 2001; Howe, Hargreaves, and Huttly 2008; Rutstein and Johnson 2004). This approach to measuring wealth–something difficult to accurately estimate in
devel-5In some cases, there were more than two respondents per household, which is why more than 119 respondents
were removed at random. Supplementary analyses includingallrespondents showed that the results are not
oping countries–has been validated by previous researchers (Filmer and Pritchett 2001; Howe, Hargreaves, and Huttly 2008). To ensure factorial invariance, the weights are kept consistent across waves. No item received a negative weight. In this study, television and electricity are assigned the largest weights and the lowest weights are given to an animal-drawn cart and bicycle.
4.2.2 Child fostering
To explore the effect of fostering on household wealth, I measure the incidence of fos-tering within the study period. Because it is impossible to know whether a respondent’s household was fostering a child before the TLT study began, I assume that no households were fostering at the baseline wave. While it is likely that some respondents’ house-holds were fostering a child at the outset of the study, this assumption is reasonable for the purpose of making inferences about the consequences ofnewfostering experiences. The incidence of child fostering is measured in two distinct ways. First, based on each respondent’s self-report of having a non-biological child join his or her household since his or her last interview, I use a binary indicator for whether each respondent’s household fostered a child between waves (1=yes, 0=no).
The second measure is a categorical variable that takes into account respondents’ an-ticipation of the fostering event. I created this variable using the binary indicator in com-bination with information about anticipation from the preceding wave. At each wave, respondents were asked, “In the next year, how likely is it that you will foster a new child in your household?”. Responses were measured through an interactive technique wherein the respondent was given a set of 10 beans and asked to shift the number of beans to a small plate to represent the likelihood of a future event, with a greater number of beans indicating a higher likelihood.6 Combining answers to this question with the report of whether the respondent’s household fostered a child in the subsequent wave, I categorize respondents into four groups: 1) respondents whose household fostered a child but indi-cated in the previous wave that there was no likelihood of their household fostering in the coming year (zero beans at the previous wave), 2) those whose household fostered and anticipated those responsibilities (10 beans at the previous wave), 3) respondents whose household fostered a child but were uncertain about whether or not they would foster in the future (one to nine beans at the previous wave), and 4) respondents whose household did not foster between waves (reference group). These cut-points for the categories were
6The interviewer introduces this method of questioning by asking respondents simple questions about frequent
not determined empirically to ensure any specific distribution or results, but were defined conceptually.7
To clarify the complexity of this measure, Figure 1 illustrates how the longitudinal data were leveraged to create the categorical fostering variable. Figure 1 depicts hypo-thetical Respondents A, B, and C, all of whom fostered a child at least once during the seven-wave interval, while hypothetical Respondent D did not foster during this time pe-riod. Respondent A reported fostering a child at Wave 2 after indicating at Wave 1 that there was no likelihood (zero beans) of doing so. Respondent A is a fosterer in the binary sense and, specifically, a “surprised fosterer” in categorical terms from Wave 2 onward. At Wave 4, Respondent B reported fostering a child and is treated as a fosterer over the subsequent waves. Because Respondent B did not contribute data to Wave 3, her level of anticipation at Wave 2 (10 beans) was used, categorizing her as an anticipated fosterer.8 Respondent C reported fostering twice: both at Wave 3 and Wave 5.9 This respondent re-mained a fosterer, in binary terms, from Wave 3 onward, but moved from an “uncertain” fosterer to an “anticipated” fosterer in the categorical measure based on the different level of anticipation preceding the second fostering event.
Figure 1: Construction of the anticipatory fostering variable
Wave 1 Wave 2 Wave 3 Wave 4 Wave 5 Wave 6 Wave 7 Wave 8
Respondent A
Respondent B
Respondent C
Respondent D
0 beans (Surprised) Fosterer
5 beans 10 beans missed wave
(Anticipated) Fosterer
10 beans 6 beans
(Uncertain) Fosterer10 beans
(Anticipated) Fosterer
0 beans 0 beans 5 beans 7 beans 5 beans 3 beans
Fostering event
Number of beans indicates level of anticipation of fostering within the next year.
Non-Fosterer Non-Fosterer
Non-Fosterer Non-Fosterer
Indicates length of time spent in given fostering status (Type of status in italics. Anticipatory category in parentheses).
Connects the fostering event to the wave at which level of anticipation is used to categorize fostering by type.
7Ancillary models were estimated to test different categories that define surprised, anticipated, and uncertain
fostering. Expanding the surprised and anticipated categories by one bean each and restricting the uncertain category by two beans did not change the results of the multivariate analysis. A discussion and presentation of these models can be found in Appendix B.
8There were only eight respondents who fostered a child and did not contribute data to the preceding wave. In
these cases, the anticipation used to categorize them was always obtained from within one year prior to fostering.
9For respondents who reported fostering more than one time over the course of the study, the categorical
4.2.3 Control variables
I adjust for time-varying socio-demographic variables that the literature establishes as im-portant predictors of wealth. All control variables are treated as intervening variables— that is, they happen after fostering has occurred. Household size is a continuous measure of the number of people who regularly sleep at the respondent’s house and was derived from the household roster, which was updated at every wave. To measure the effect of adding additional household members other than a foster child and to ensure the effect of fostering is not captured in changes in household size, one household member was sub-tracted for households that fostered. Marital status is a binary measure that distinguishes respondents who are currently single from those who are married or cohabiting. Edu-cational attainment is a continuous measure of the highest level of education completed by the respondent. In addition to educational attainment I include a dummy variable that signifies whether the respondent was enrolled in school at each interview wave. Income is measured in Malawian Kwacha, and represents the amount of money the respondent reported making in the month preceding his or her interview (referred to as “monthly income” in subsequent tables). An indicator of survey wave is included as a proxy for time and adjusts for any maturation effect as individuals move through the life course.10
Finally, a dummy variable for whether the respondent moved houses between interviews is included to account for discontinuity in the household rosters.
4.3 Analytic approach
I use fixed-effects pooled time series models to estimate the effect of fostering on subse-quent changes in household wealth. Fixed effects procedures use within-individual differ-ences to estimate the difference between person-level variance across groups that did and did not experience a given event within the observed time period. Fixed effects models have several advantages for estimating the effects of events on continuous outcomes in panel data, two of which are particularly salient for the present study (see Allison 1994 and Johnson 1995 for a detailed description of the costs and benefits of this modeling strategy). First, fixed effects models allow for the inclusion of respondents who have not contributed information to every wave. This is especially appropriate for intensive lon-gitudinal studies, such as TLT, in which respondents may miss waves due to temporary migration or illness without attriting from the sample entirely. Second, fixed-effects pro-cedures account for both observed and unobserved time-invariant characteristics. This
10After respondents who skipped an interview or interviewed at an unscheduled time have been accounted for,
ensures the model estimates are independent of selection bias and all other time-invariant differences between respondents (Allison 1994).
Fixed effects models rely on a mean-deviation algorithm that computes the means over time for all time-varying variables (both dependent and independent) for each indi-vidual. These person-specific means are then subtracted from the observed values of each variable and the difference in the dependent measure is regressed on the difference in the independent variable(s) (Allison 2009). Like other family transitions, the full effects of fostering on households may not be instantaneous. Therefore, comparing household wealth pre- and post-fostering is more appropriate than estimating the immediate effect of receiving a foster child in a one-wave interval. Thus for fixed effects estimation, once a respondent’s household has fostered a child, I considered it a fostering household in all subsequent waves (as indicated in Figure 1).
To ensure that exposure to fostering precedes changes in household wealth, I structure the data so that anticipation and reported fostering are combined (discussed above) and are used to predict changes infuturehousehold wealth. In other words, fostering a child between Waves 1 and 2 is used to assess changes in household wealth that take place from Wave 3 onward. Similarly, fostering that occurred between Waves 5 and 6 is used to assess changes in household wealth in Waves 7 and 8. This technique ensures that a contemporaneous change in household wealth can not be confused with a real effect of fostering or that a change in household wealth prompted a household to foster a child.
5.
Results
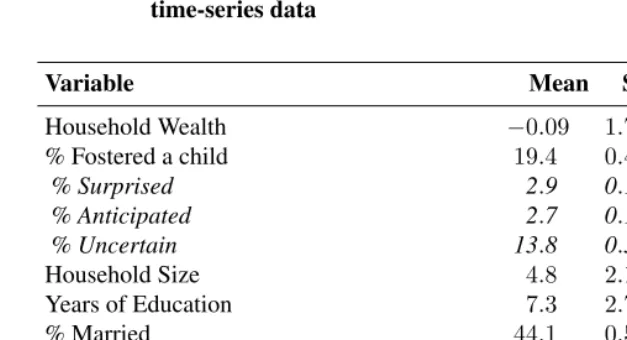
Table 1: Fostering characteristics and descriptive statistics for pooled time-series data
Variable Mean S.D. Range
Household Wealth −0.09 1.70 –1.85 – 9.36
% Fostered a child 19.4 0.40 0 – 1
% Surprised 2.9 0.17 0–1
% Anticipated 2.7 0.16 0–1
% Uncertain 13.8 0.35 0–1
Household Size 4.8 2.18 1 – 18
Years of Education 7.3 2.73 0 – 13
% Married 44.1 0.50 0 – 1
% Student 34.1 0.47 0 – 1
Monthly Income(thousands of Kwacha) 2.3 6.99 0 – 250
% Moved household 12.6 0.33 0 – 1
N=10,987 person-waves representing 1754 individuals
Over the course of the study, most households experienced a net gain in wealth, but this gain was not universal across households. An examination of the household wealth measure (not shown) reveals that 42% of households experience a net increase in wealth between Waves 2 and 8. Approximately one third (31%) of households experienced a net decline in household wealth, while about a quarter showed no net change over the same time period.
Within each wave analyzed, the incidence of new fostering among households ranged between 4 and 11%. Exposure to fostering within the pooled data represents 19% of all person-waves analyzed. Table 1 shows the percent of fostering experiences disaggregated into anticipation categories. Surprised and anticipated fostering make up roughly equal proportions of fostering experiences (15% and 13%, respectively), while, as expected, uncertain fostering represents the majority of fostering circumstances.
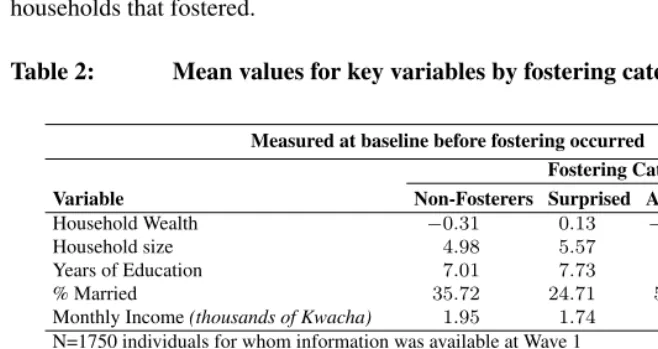
Table 2 shows the bivariate association between the fostering categories and key in-dependent variables. This table is split into two panels: the top panel, which measures variables at Wave 1 of the study before the measured fostering events took place,11 and
a bottom panel, which shows the average across all observations in the pooled dataset. The top panel reveals that at the beginning of the observed interval, respondents whose household eventually fostered a child are, on average, more educated and wealthier than
11The most recent fostering experience was used to categorize respondents whose household fostered multiple
respondents whose household did not foster a child. Interestingly, households that even-tually fostered and anticipated doing so began the study with lower household wealth than households that fostered under other circumstances. This suggests that wealth is not necessarily a pre-requisite for the ability to anticipate fostering responsibilities.
The patterns in the top panel of Table 2 are largely reflected in the pooled data (bot-tom panel of Table 2). The notable exception is among households who fostered a child and anticipated doing so. When observations are averaged across the pooled data, house-holds that fostered out of anticipation are not less notably less wealthy than other types of households that fostered.
Table 2: Mean values for key variables by fostering categories
Measured at baseline before fostering occurred Fostering Category
Variable Non-Fosterers Surprised Anticipated Uncertain
Household Wealth −0.31 0.13 −0.12 0.20
Household size 4.98 5.57 4.88 5.01
Years of Education 7.01 7.73 7.24 7.55
% Married 35.72 24.71 50.00 38.14
Monthly Income(thousands of Kwacha) 1.95 1.74 2.58 2.32
N=1750 individuals for whom information was available at Wave 1
Pooled time-series data
Household Wealth −0.17 0.31 0.23 0.25
Household Size 4.95 4.78 4.52 4.29
Years of Education 7.19 8.23 7.55 7.79
% Married 42.90 31.33 58.02 50.95
Monthly Income(thousands of Kwacha) 2.21 1.78 4.16 2.55
N=10,987 person-waves representing 1754 individuals
5.1 Multivariate analysis
5.1.1 Fostering as a binary status
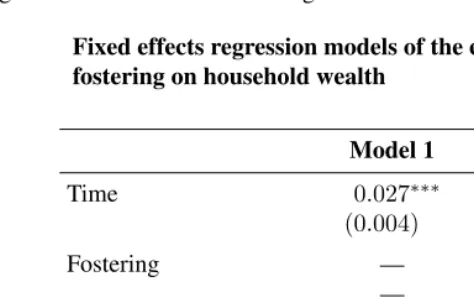
Model 1 in Table 3 contains the results of the first fixed-effects time series model, which simply evaluates how household wealth changed over the observed interval. In the ab-sence of any controls, household wealth in this sample increased marginally over time. Model 2 in Table 3 estimates the effect of fostering, as a binary status, on household wealth, controlling for time. This model indicates that fostering a child is not associated with statistically discernible changes in household wealth. This suggests that child foster-ing has no impact on the wealth of receivfoster-ing households. However, evidence from previ-ous studies indicates that receiving a foster child is a heterogeneprevi-ous experience. Because fostering may matter for households under certain circumstances, I turn my attention to evaluating whether the effect of fostering is conditioned by anticipation.
Table 3: Fixed effects regression models of the effect of time and
fostering on household wealth
Model 1000000 Model 2
Time 0.027∗∗∗ 0.026∗∗∗
(0.004) (0.004)
Fostering —000000 0.022
—000000 (0.032)
Constant −0.223∗∗∗ −0.221∗∗∗
(0.019) (0.019)
Person-waves 10,987000000 10,987000
Individuals 1754000000 1754000
Within-individual R2 0.006 0.006
Notes: Standard errors in parentheses. *** p<0.001, ** p<0.01, * p<0.05
5.1.2 Fostering conditioned by anticipation
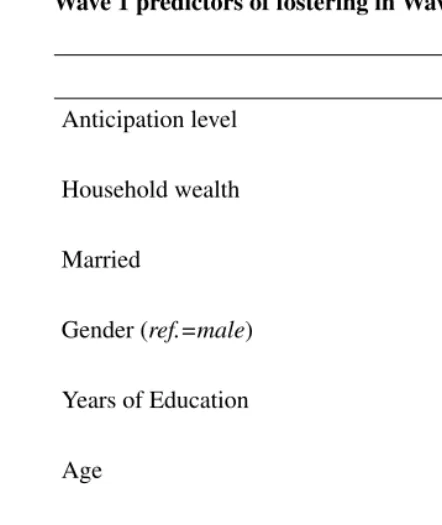
The positive relationship between anticipation and future fostering is robust to a num-ber of controls. Using logistic regression, I regress fostering at Wave 2 (1=yes, 0=no) on Wave 1 levels of anticipation, controlling for basic sociodemographic characteristics such as gender, age, household wealth, and marital status (also measured at Wave 1). The results indicate that the measure of anticipation is a meaningful predictor of future fostering, with a person’s odds of fostering a child at Wave 2 increasing by 5% for every additional bean he or she shifted to the “positive” side of the plate in Wave 1 (p<0.05) (see Table A3 in Appendix A for full model estimates). Further investigation of the anticipa-tion measure shows that anticipaanticipa-tion of future fostering operates similarly across different types of respondents within the TLT sample. Supplementary analyses testing for interac-tion effects with anticipainterac-tion provided no evidence to suggest that the predictive ability of anticipation of fostering differs by respondent’s age, marital status, gender, education level, or socioeconomic status (models not shown but available upon request).
Figure 2: Relationship between anticipation of fostering and subsequent
fostering
0
.1
.2
Proportion Fostered a Child at Wave 2
0 2 4 6 8 10
Beans, wave 1
Despite the strong relationship between anticipation of fostering responsibilities and subsequent fostering, surprised fostering happened within the TLT sample. Nearly 10% of people who reported fostering at Wave 2 indicated at Wave 1 that there was no chance of their household fostering a child within the next year. Likewise, slightly less that 15% of those reporting fostering at Wave 2 had completely anticipated doing so during their Wave 1 interview.
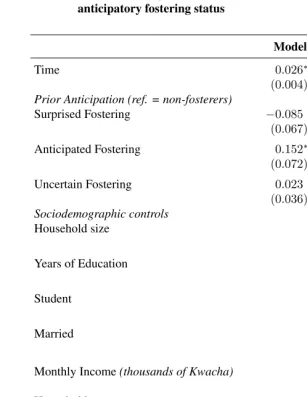
Model 3 in Table 4 estimates the impact of fostering categorized by prior anticipation on change in household wealth. This model reveals that fostering had a statistically signif-icant positive effect on household wealth when it was anticipated. Fostering under these circumstances was associated with a 0.15 gain in the household wealth score compared to respondents whose household did not foster within the observation period. Restructuring the data to ensure fostering preceded changes in household wealth allows us to reasonably interpret this as an actual gain in wealth rather than a selection effect.
For households that fostered under surprised or uncertain circumstances, we observe no such advantage. These households experienced neither a significant increase nor de-crease in wealth in comparison to households that did not experience fostering within the interval observed. However, rotating the reference categories to examine pairwise relationships shows that fostering had different consequences for those households that anticipated the event and those that were surprised by it (model not shown). Specifically, households that anticipated fostering experience a 0.24 increase in wealth over households that fostered by surprise (p<0.05). Uncertain fostering households, however, remain sta-tistically indistinguishable from anticipated fosterers in terms of changes to household wealth.12
One explanation for these findings could be that the anticipation of fostering— irrespective of actually fostering a child in the future—is itself associated with an in-crease in wealth. Perhaps people expect that their household will come into wealth in the near future, prompting them to also anticipate helping extended family by taking on ad-ditional childcare responsibilities. To rule out this possibility, I estimate the effect of the change in the anticipation of future fostering on future changes in household wealth. This analysis shows that anticipation in and of itself has no relation to household wealth (see Table A4 in Appendix A). Additionally, there are only weak correlations (r<0.3) between respondents’ anticipation of fostering and their anticipation of other wealth-related future events, such as the ability to save money, open a bank account, and/or open a business. Taken together, this suggests that people who anticipate their household will foster are not simultaneously anticipating an increase in wealth.
Table 4: Fixed effects regression models of the effect on household wealth by anticipatory fostering status
Model 3000 Model 4
Time 0.026∗∗∗ 0.023∗∗∗
(0.004) (0.004)
Prior Anticipation (ref. = non-fosterers)
Surprised Fostering −0.085 −0.032
(0.067) (0.067)
Anticipated Fostering 0.152∗ 0.192∗∗x
(0.072) (0.071)
Uncertain Fostering 0.023 0.072∗
(0.036) (0.036)
Sociodemographic controls
Household size 0.064∗∗∗
(0.007)
Years of Education 0.047∗
(0.020)
Student 0.098∗∗x
(0.033)
Married 0.142∗∗∗
(0.036)
Monthly Income(thousands of Kwacha) 0.006∗∗∗
(0.002)
Household move 0.023
(0.025)
Constant −0.221∗∗∗ −0.990∗∗∗
(0.019) (0.150)
Person waves 10,98700000 10,987000
Individuals 175400000 1754000
Within-individual R2 0.007 0.020
Turning to Model 4 in Table 4, we see that the intervening sociodemographic controls do not explain how anticipation of fostering acts further increase household wealth. After controlling for a host of other changes, the significant effect of anticipated fostering on household wealth remains and even increases in effect size and significance. We also see that uncertain fostering is associated with a small increase in household wealth in this model. However, supplementary analyses suggest this latter effect is weak and more sensitive to the techniques used to categorize fostering (see Table B1 in Appendix B). Other covariates operate in ways consistent with what we would expect. The addition of a household member above and beyond the foster child increases household wealth, likely because the addition of an adult is accompanied by that individual’s capital. In addition, being enrolled in school and an increase in the respondent’s previous month’s income act to increase the wealth of a respondent’s household.
6.
Summary and discussion
Child fostering in sub-Saharan Africa has long been regarded as a beneficial practice for households and children. However, little empirical work has explored the impact of fostering a child for receiving families. This study provides further insight into how fostering households cope with extra childcare responsibilities over time by testing two competing hypotheses about how fostering a child effects household wealth. Importantly, this study takes the perspective that fostering experiences are heterogeneous. Treating child fostering as conditioned by prior anticipation acknowledges the reciprocal nature of decision-making among African kin networks.
By illustrating the role of anticipation in outcomes for foster families, this research demonstrates the importance of accounting for circumstantial factors in research on child fostering. In this research, the empirical results show that when fostering is treated simply as an event that either happened or did not happen, fostering does not seem to impact a household’s wealth within the approximately two-and-a-half years of the study period. However, conditioning the fostering experience on prior anticipation reveals that house-hold wealth does change in response to fostering a child under certain circumstances. Households that anticipated fostering responsibilities experienced significant gains in wealth. This finding is robust to a host of controls and lends support for Hypothesis 1, which predicted that household wealth increases in response to fostering a child.
gen-eralizing the findings for these types of households. It is possible that such households may not experience the benefits associated with anticipated fostering due to unfavorable dependency ratios.
A related concern is that this study uses the anticipation reported by one household member as a proxy for the level of anticipation of the household. However, given the collective nature of fostering decisions, it is likely that all household members have some awareness of future fostering—though not all equally. Because of the significant predic-tive ability of the anticipation measure, and because anticipation does not operate differ-ently for different types of people, the anticipation of the respondent as a representative household member is validated.
Second, there are limits to relying on a household wealth index as the dependent variable. Although the use of wealth indices has numerous benefits in contexts for which data on income and consumption are limited (Filmer and Pritchett 2001; Rutstein and Johnson 2004), such a measure may not accurately capture the entire picture of wealth in all developing contexts (Bingenheimer 2007). Like many standard wealth indices, the wealth index used in this study does not include measures of livestock and land ownership. While these are more traditional forms of wealth in many sub-Saharan African countries, TLT only measured these assets at the first and last wave of the study—an interval that is too wide for the present analysis. Therefore, the study’s findings should be interpreted in relation to more modern, cash-oriented forms of wealth.
contribute to the household or may negotiate a favorable arrangement with the sending family.
An alternative explanation may be that anticipating fostering represents a number of other qualities that make fostering households more likely to experience an increase in wealth. For example, anticipation could represent better communication within the household and between extended kin networks outside the household. If such superior communication extends into the community at large, it may be indicative of the status of a household within a community or, at a minimum, serve as a proxy of that household’s ample access to information and resources.
Prior knowledge of an event reduces uncertainty and increases the ability to plan ac-cordingly. Thus, anticipation of fostering could allow households to mobilize the neces-sary resources in advance of receiving a foster child, making the household better able to productively leverage additional household members. It could be argued that patterns of superior communication and planning at the household level protect households against instability more generally. Thus, to the extent that anticipation captures these two at-tributes, it may represent greater stability within the household.
Fostering households that do not fully anticipate fostering responsibilities may not experience the same gains in wealth that are associated with anticipated fostering. How-ever, the fact that these fostering households are not significantly worse-off than their non-fostering counterparts is encouraging, especially considering that these households— particularly the “surprised” households—may have experienced fostering as a true “shock.” In other words, despite recent concerns about the toll that orphanhood and child care responsibilities are taking on African families (Barnett and Blaikie 1992; Gregson, Mushati, and Nyamukapa 2007), fostering under perhaps less-than-optimal circumstances may not be hurting households economically. Still, more research is needed to tease out how the variety of circumstances under which fostering takes place differentially effects fostering households.
focus-ing on fosterfocus-ing households should also explore changes in household food security and members’ health to understand other ways receiving a foster child impacts households.
While the orphan crisis is certainly impacting sub-Saharan Africa, additional caretak-ing responsibilities may not be as detrimental to the African household as conventional wisdom suggests or as other scholars have speculated. In the current study context, child fostering does not seem to damage the wealth of host households. In fact, under some cir-cumstances, households that absorb a foster child may experience net economic benefits over time. This supports the idea that child fostering continues to be a highly functional system in certain sub-Saharan African contexts. The findings also indicate that the system of child fostering deserves to be examined in more complexity.
7.
Acknowledgments
This research was supported by funding from the Eunice Kennedy Shriver National Insti-tute of Child Health and Human Development of the National InstiInsti-tutes of Health (Popu-lation Research Infrastructure Grant R24HD041025, Family Demography Training Grant T32HD007514). The content is solely the responsibility of the author and does not nec-essarily represent the official views of the National Institutes of Health. Special acknowl-edgments are due to Jenny Trinitapoli, Michelle Frisco, David Johnson, Kevin Thomas, Emily Smith-Greenaway, and Adam Lippert for their comments on early drafts of this manuscript.
References
Ainsworth, M. (1996). Economic Aspects of Child Fostering in Cote d’Ivoire. Research in Population Economics8: 25–62.
Ainsworth, M. and Filmer, D. (2006). Inequalities in Children’s Schooling: AIDS, Orphanhood, Poverty, and Gender. World Development 34(6): 1099–1128.
doi:10.1016/j.worlddev.2005.11.007.
Akresh, R. (2005). Risk, Network Quality, and Family Structure: Child Fostering De-cisions in Burkina Faso. Illinois: University of Illinois at Urbana-Champaign. (IZA Discussion Paper 1471).
Akresh, R. (2009). Flexibility of Household Structure. Journal of Human Resources
44(4): 976–997. doi:10.1353/jhr.2009.0011.
Allison, P.D. (1994). Using Panel Data to Estimate the Effects of Events. Sociological Methods & Research23(2): 174–199. doi:10.1177/0049124194023002002.
Allison, P.D. (2009). Fixed Effects Regression Models. Los Angeles, CA: Sage Publica-tions, Inc.
Andvig, J.C., Canagarajah, S., and Kielland, S. (1999). Child labor in Africa: The issues.
Unpublished mimeo. World Bank, Social Protection Sector.
Bandawe, C.R. and Louw, J. (1997). The experience of family foster care in Malawi: A preliminary investigation.Child Welfare76(4): 535–47.
Barnett, T. and Blaikie, P. (1992). AIDS in Africa: Its Present and Future Impact. New York: Guilford Press.
Becker, G.S. (1991). A Treatise on the Family. Cambridge, MA: Harvard University Press.
Beegle, K., Filmer, D., Stokes, A., and Tiererova, L. (2010a). Orphanhood and the living arrangements of children in sub-Saharan Africa. World Development38(12): 1727– 1746.doi:10.1016/j.worlddev.2010.06.015.
Beegle, K., Weerdt, J.D., and Dercon, S. (2010b). Orphanhood and human capital destruction: Is there persistence into adulthood? Demography 47(1): 163–180.
doi:10.1353/dem.0.0094.
Bicego, G., Rutstein, S., and Johnson, K. (2003). Dimensions of the emerging or-phan crisis in sub-Saharan Africa. Social Science & Medicine 56(6): 1235–1247.
Bingenheimer, J.B. (2007). Wealth, wealth indices and HIV risk in east africa. Interna-tional Family Planning Perspectives33(2): 83–84.doi:10.1363/3308307.
Bledsoe, C. (1990). The politics of children: Fosterage and the social management of fertility among the Mende of Sierra Leonne. In: Handwerker, W. (ed.).Births and Power: Social Change and the Politics of Reproduction. Boulder, CO: Westview Press: 81–100.
Bledsoe, C. and Isiugo-Abanihe, U. (1989). Strategies of child-fosterage among Mende grannies in Sierra Leone. In: Lesthaeghe, R.J. (ed.).Reproduction and Social Organi-zation in sub-Saharan Africa. Berkley, CA: University of California Press: 443–475.
Bongaarts, J. (2001). Household size and composition in the developing world in the 1990s.Population Studies55(3): 263–279. doi:10.1080/00324720127697.
Caldwell, J. (1976). Toward a restatement of demographic transition theory. Population and Development Review2(3/4): 321–366. doi:10.2307/1971615.
Caldwell, J. (1983). Direct economic costs and benefits of children. In: Bulatao, R.A. and Lee, R.D. (eds.).Determinates of Fertility in Developing Countries. New York: Academic Press: 458–493, vol. 1.
Caldwell, J. (1997). The impact of the African AIDS epidemic.Health Transition Review
7(Supplement 2): 169–188.
Case, A., Paxson, C., and Ableidinger, J. (2004). Orphans in Africa: Parental death, poverty, and school enrollment. Demography 41(3): 483–508.
doi:10.1353/dem.2004.0019.
Cluver, L., Gardner, F., and Operario, D. (2007). Psychological distress amongst AIDS-Orphaned children in urban South Africa.Journal of Child Psychology and Psychiatry
48(8): 755–763.doi:10.1111/j.1469-7610.2007.01757.x.
Cluver, L. and Orkin, M. (2009). Cumulative risk and AIDS-Orphanhood: interactions of stigma, bullying and poverty on child mental health in South Africa.Social Science & Medicine69(8): 1186–1193.doi:10.1016/j.socscimed.2009.07.033.
Dahl, B. (2009). The “Failures of culture”: Christianity, kinship, and moral dis-courses about orphans during Botswana’s AIDS crisis. Africa Today56(1): 23–43.
doi:10.2979/AFT.2009.56.1.22.
Delavande, A. and Kohler, H.P. (2009). Subjective expectations in the context of HIV/AIDS in Malawi. Demographic Research 20: 817–874.
doi:10.4054/DemRes.2009.20.31.
Drah, B. (2012). Orphans in Sub-Saharan Africa: The Crisis, the Interventions, and the Anthropologist. Africa Today59(2): 2–21. doi:10.2979/africatoday.59.2.3.
Eloundou-Enyegue, P. and Shapiro, D. (2004). Buffering inequalities: The safety net of extended families in Cameroon. Ithaca, NY: Cornell Univ., Cornell Food and Nutrition Policy Program. (SAGA Working Paper).
Filmer, D. and Pritchett, L.H. (2001). Estimating wealth effects without expenditure data– or tears: An application to educational enrollments in states of India. Demography
38(1): 115–132.
Goody, E.N. (1982). Parenthood and Social Reproduction: Fostering and Occupational Roles in West Africa. Cambridge: Cambridge University Press.
Grant, M.J. (2008). Children’s school participation and HIV/AIDS in rural Malawi: The role of parental knowledge and perceptions. Demographic Research19: 1603–1634.
doi:10.4054/DemRes.2008.19.45.
Grant, M.J. and Yeatman, S. (2012). The relationship between orphanhood and child fostering in sub-Saharan Africa, 1990s–2000s. Population Studies 1–17.
doi:10.1080/00324728.2012.681682.
Gregson, S., Mushati, P., and Nyamukapa, C. (2007). Adult mortality and erosion of household viability in AIDS-Afflicted towns, estates, and villages in eastern Zim-babwe. JAIDS Journal of Acquired Immune Deficiency Syndromes 44: 188–195.
doi:10.1097/01.qai.0000247230.68246.13.
Hosegood, V., Floyd, S., Marston, M., Hill, C., McGrath, N., Isingo, R., Crampin, A., and Zaba, B. (2007a). The effects of high HIV prevalence on orphanhood and living arrangements of children in Malawi, Tanzania, and South Africa. Population Studies
61(3): 327–336. doi:10.1080/00324720701524292.
Hosegood, V., Preston-Whyte, E., Busza, J., Moitse, S., and Timaeus, I.M. (2007b). Revealing the full extent of households experiences of HIV and AIDS in rural South Africa. Social Science & Medicine 65(6): 1249–1259.
doi:10.1016/j.socscimed.2007.05.002.
27.doi:10.1186/1471-2458-6-27.
Howe, L.D., Hargreaves, J.R., and Huttly, S.R. (2008). Issues in the construction of wealth indices for the measurement of socio-economic position in low-income coun-tries.Emerging Themes in Epidemiology5: 3. doi:10.1186/1742-7622-5-3.
Isiugo-Abanihe, U.C. (1985). Child fosterage in West Africa. Population and Develop-ment Review11(1): 53–73.doi:10.2307/1973378.
Johnson, D.R. (1995). Alternative methods for the quantitative analysis of panel data in family research: Pooled time-series models. Journal of Marriage and Family57(4): 1065–1077.doi:10.2307/353423.
Johnson-Hanks, J.A. (2006).Uncertain Honor: Modern Motherhood in an African Crisis. Chicago, IL: University of Chicago Press.
Klaits, F. (2010). Death in a Church of Life: Moral Passion during Botswana’s Time of AIDS. Berkeley, CA:University of California Press, 1st ed.
Lloyd, C. and Desai, S. (1992). Children’s living arrangements in developing countries.
Population Research and Policy Review11(3): 193–216. doi:10.1007/BF00124937.
Madhavan, S. (2004). Fosterage patterns in the age of AIDS: continuity and change.
Social Science & Medicine58(7): 1443–1454.doi:10.1016/S0277-9536(03)00341-1.
McDaniel, A. and Zulu, E. (1996). Mothers, fathers, and children: Regional patterns in child-parent residence in sub-Saharan Africa.African Population Studies11(1): 1–28.
Monasch, R. and Boerma, T.J. (2004). Orphanhood and childcare patterns in sub-Saharan Africa: An analysis of national surveys from 40 countries. AIDS 18: S55–S65.
doi:10.1097/00002030-200406002-00007.
Munthali, A. (2002). Adaptive strategies and coping mechanisms of families and commu-nities affected by HIV/AIDS in Malawi. Geneva: United Nations Research Institution for Social Development.
National Statistical Office and ICF Macro (2011). Malawi demographic and health survey 2010. Zomba, Malawi and Calverton, MD.
Ntozi, J. (1995). High Fertility in Rural Uganda: The Role of Socioeconomic and Bio-logical Factors. Kampala: Fountain Publishers.
Nyambedha, E.O., Wandibba, S., and Aagaard-Hansen, J. (2003). Changing patterns of orphan care due to the HIV epidemic in Western Kenya. Social Science & Medicine
57(2): 301–311.doi:10.1016/S0277-9536(02)00359-3.
Smith, K.P. and Watkins, S.C. (2005). Perceptions of risk and strategies for prevention: Responses to HIV/AIDS in rural Malawi. Social Science & Medicine60(3): 649–660.
doi:10.1016/j.socscimed.2004.06.009.
Subbarao, K., Mattimore, A., and Plangemann, K. (2001). Social protection of Africa’s orphans and other vulnerable children: Issues and good practice program options. Washington, D.C.: The World Bank. (Africa Region Human Development Working Paper Series).
Trinitapoli, J. and Weinreb, A. (2012). Religion and AIDS in Africa. New York: Oxford University Press.doi:10.1093/acprof:oso/9780195335941.001.0001.
Trinitapoli, J. and Yeatman, S. (2011). Uncertainty and fertility in a gen-eralized AIDS epidemic. American Sociological Review 76(6): 935–954.
doi:10.1177/0003122411427672.
UNAIDS (2007). Report on the global AIDS epidemic. United Nations.
UNAIDS (2010). Report on the global AIDS epidemic. United Nations.
Urassa, M., Boerma, J.T., Ng’weshemi, J.Z.L., Isingo, R., Schapink, D., and Kumogola, Y. (1997). Orphanhood, child fostering and the AIDS epidemic in rural Tanzania.
Health Transition Review7(Supplement 2): 141–153.
Van de Walle, E. (2006). African Households: Censuses And Surveys. New York: M.E. Sharpe Inc.
Watkins, S.C. (2004). Navigating the AIDS epidemic in rural Malawi. Population and Development Review30(4): 673–705.doi:10.1111/j.1728-4457.2004.00037.x.
Appendix A: Supplementary tables
Table A1: Comparison of full and analytic sub-sample for key variables
Full Sample Analytic Sample
Variable Mean S.D. Mean S.D.
Household wealth −0.13 1.8 −0.09 1.7
% Fostered a child 19.3 0.4 19.4 0.4
Household Size 5.1 2.2 4.8 2.2
Years of Education 7.4 2.7 7.3 2.7
% Married 41.4 0.5 44.1 0.5
% Student 36.9 0.5 34.1 0.5
Monthly Income(thousands of Kwacha) 2.3 7.2 2.3 7.0
Moved house 12.8 0.3 12.6 0.3
Person-waves 14,555 10,987
Individuals 2080 1754
Table A2: Cross-sectional description of sample at the beginning of the
observed interval (Wave 2)
Variable Mean S.D. Range
Household wealth −0.11 1.73 –1.85 – 8.15
Household Size 5.10 2.18 1 – 14
Years of Education 7.11 2.72 0 – 13
% Married 39.00 0.49 0 – 1
% Student 43.1 0.50 0 – 1
Table A3: Wave 1 predictors of fostering in Wave 2
Odds Ratio
Anticipation level 1.053∗
(0.026)
Household wealth 1.180∗∗∗
(0.052)
Married 1.820∗∗x
(0.383)
Gender (ref.=male) 1.195
(0.239)
Years of Education 1.061
(0.036)
Age 0.970
(0.031)
Monthly Income(thousands of Kwacha) 1.00
(0.014)
Constant 0.084∗∗∗
(0.050)
Individuals 1668000
Table A4: Fixed effects regression model of the independent effect of anticipation on household wealth
Coefficient
Fostering(ref. = non-fosterers) 0.022
(0.032)
Anticipation of Fostering −0.001
(0.003)
Time 0.026∗∗∗
(0.004)
Constant −0.219∗∗∗
(0.021)
Person Waves 10,987000
Individuals 1754000
Within individual R2 0.006
Notes: Standard errors in parentheses. *** p<0.001, ** p<0.01, * p<0.05
Appendix B: Expanding the definition of anticipated and surprised
fostering
Table B1: Fixed effects regression models of the effect on household wealth by anticipatory fostering status (expanded anticipation cut-points)
Model 1 Model 2
Time 0.026∗∗∗ 0.024∗∗∗
(0.004) (0.004)
Prior Anticipation (ref. = non-fosterers)
Surprised Fostering −0.049 0.007
(0.057) (0.057)
Anticipated Fostering 0.171∗∗x 0.202∗∗x
(0.066) (0.065)
Uncertain Fostering −0.004 0.044
(0.040) (0.038)
Sociodemographic controls
Household Size 0.064∗∗∗
(0.007)
Years of Education 0.047∗
(0.020)
Student 0.099∗∗x
(0.033)
Married 0.141∗∗∗
(0.036)
Monthly Income(thousands of Kwacha) 0.006∗∗∗
(0.002)
Household Move 0.023
(0.025)
Constant −0.222∗∗∗ −0.981∗∗∗
(0.019) (0.150)
Person-waves 10,987000 10,987000
Individuals 1754000 1754000
Within individual R2 0.007 0.020