Response surface methodology for optimization of culture conditions for
dye decolorization by a fungus,
Aspergillus niger
HM11 isolated from dye
affected soil
Karthikeyan K1,2*, Nanthakumar K2, Shanthi K3, Lakshmanaperumalsamy P4
1Gujarat Institute of Desert Ecology, Mundra Road, Bhuj-Kachchh -370001, Gujarat, India. 2Department of Env. Sciences, Bharathiar University, Coimbatore-641 046, Tamil Nadu, India. 3Department of Env. Sciences, P.S.G.C.A.S, Coimbatore-641 014, Tamil Nadu, India. 4Karpagam
University, Eachanari Post, Coimbatore-641 021, Tamil Nadu, India.
Received: June 2010, Accepted: August 2010.
ABSTRACT
Background and Objectives: Discharge of wastewater from textile dyeing industries has been a problem in terms of pollution and treatment of these waters is a great task. Keeping this in mind, the aim of our current research is to study the effect of
various bioprocess variables on decolorization of an azo dye, Congo red, by a fungal isolate, Aspergillus niger HM11.
Materials and Methods: Central composite design (CCD) and response surface methodology (RSM) have been applied to design experiments to evaluate the interactive effects of the operating variables: on the decolorization of Congo red. A total of 30 experiments were conducted in the present study and a regression coefficient between the variables was generated.
Results: The RSM indicated that pH 6.0, 150 rpm agitation, incubation time of 36 hrs and a glucose concentration of 1.0% were optimal for maximum decolorization of Congo red and the response indicated excellent evaluation of experimental data.
Conclusion: From this study, it is very obvious that the fungal isolate, Aspergillus niger HM11 can be used as a promising microbial strain for decolorization of textile dyeing effluent containing similar dyes.
Keywords: Decolorization, Congo red, Aspergillus niger HM11, RSM, CCD.
* Corresponding Author: Dr. Kannan
Address: Gujarat Institute of Desert Ecology, P.B.No. 83, Mundra Road, Bhuj-Kachchh, 370001, Gujarat, India. E-mail: [email protected]
213
INTRODUCTION
Azo dyes are the most commonly used dyes in textile dyeing/finishing and also in food, paper and cosmetic industries. Approximately 10,000 different dyes and pigments are in industrial use, representing an annual consumption of around 7×10⁵ tonnes
worldwide (1). According to the statistics, India, the former USSR, Eastern Europe, China, South Korea and Taiwan consume approximately one thousand tons (kt) of dye annually (2).
Color can be removed from effluents by chemical and physical methods including adsorption,
coagulation-flocculation, ion-exchange, oxidation and electrochemical methods (3, 4). The above ways for clean-up are expensive, which limit their application (5). Over past decades, many microorganisms have been found to be capable of degrading dyes including bacteria (6, 7), filamentous fungi (8, 9, 10), yeasts (11, 12), actinomycetes (13) and algae (14). Anaerobic reduction and decolorization often generates aryl amines that can be transformed to highly reactive electrophiles and form covalent adducts with DNA, thereby posing a health risk (15, 16). Alternatively, dye decolorization using microbial enzymes has received great attention in recent years due to its efficient application (17, 18).
195, Reactive Yellow 145 and Reactive Black 5 by four fungal strains: Lentinus edodes CCT 4519,
Trametes versicolor CCT 4521, Phanerochaete chrysosporium ATCC 24725 and Trametes villosa CCT 5567. Combination of environmental conditions, culture technique and bioreactor design should be taken into account to produce high titres of enzyme (20). The fungal mycelia have an additive advantage over single cell organisms by solubilizing the insoluble substrates by producing extracellular enzymes and due to an increased cell-to-surface ratio, fungi have a greater physical and enzymatic contact with the environment. The extracellular nature of the fungal enzymes is also advantageous in tolerating high concentrations of the toxicants. However, it is reported that even low enzyme activity is sufficient to catalyze the decolourization of the dye solution (21).
Response surface methodology (RSM) is an efficient experimental strategy to determine optimal conditions for a multivariable system rather than optimization by the conventional method which involves changing one independent variable while keeping the other factors constant. These conventional methods are time-consuming and incapable of detecting the true optimum, especially the absence of interactions among factors (22) and in defining the effect of the independent variables, alone or in combination, on the processes (23, 24). Optimization of conditions for maximum removal of Congo red by statistical approach has been planned to determine the exact conditions for removal by A. niger HM11 which would be useful for industrial applications. Hence, the present study was aimed to examine the most influential variables for maximum decolorization of Congo red through Plackett -Burman design using
A. niger HM11.
MATeRIAL AND MeTHODS
Chemicals. Dyes and other chemicals used in the experiments were purchased from Hi-Media, Mumbai and were of the highest purity.
Microorganism. The fungal strain was isolated from dye contaminated soil collected from a local textile industry situated in Coimbatore, Tamilnadu, India. Further, identification of the fungal isolate was carried out at Agharkhar Research Institute, Pune, India and was identified to be A. niger and designated as A. niger HM11.
Culture conditions. Sabouraud’s dextrose agar (SDA) plates were prepared. Purified fungal isolates from slants were streaked onto SDA plates and incubated at 30°C for 5 days. After good growth, mycelial discs of 0.6 cm diameter were cut with a flame sterilized cork-borer and used as inoculum. For liquid cultures, Sabouraud’s dextrose broth was used.
Response surface methodology (RSM). RSM approach is used to generate the best conditions for a system comprising many variables to calculate the combined effect of selected variables (22- 24). In the present study, RSM was employed to identify the interactions between the operational variables such as pH, temperature (oC), agitation (rpm), incubation time
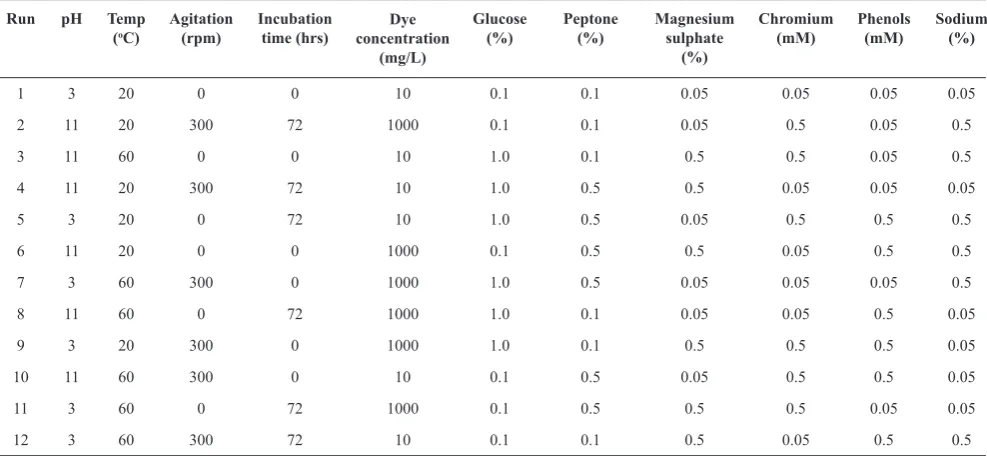
(hrs), dye concentration (mg/L), glucose concentration (%), peptone (%), magnesium sulphate (%), heavy metal chromium (mM), phenols (mM) and sodium (%) at various concentrations. We selected Plackett Burman design for the study on the interactions of different variables. Various concentrations of pH (3.0-11.0), agitation (0-300 rpm), incubation time (0-72 hrs) and glucose (0.1 – 1.0 %) were chosen as the critical variables and dye decolorization experiments were carried out according to the arrangement presented in the Table 1.
Medium optimization for decolorization of Congo red by A. niger HM11. The major conventional strategy used for optimal operating condition of a parameter is optimized by changing one parameter at a time and keeping the others at a constant level. This method often does not yield reliable results, is laborious, time consuming and impractical (22). In this regard, RSM is a useful model for studying the effect of several factors by varying them simultaneously and carrying out a limited number of experiments. This methodology consists of the Plackett – Burman design as the first optimization step, Central Composite design as a second step to optimize the factors that have significant effects, and response surface analysis.
Screening of important nutrient components using Plackett – Burman design. This study was done for screening medium components with respect to their main effects and not their interaction effects (25) on decolorization of Congo red by A. niger
for eleven variables at two levels; maximum and minimum using Plackett – Burman design. The design and levels of each variable is shown in Table 1. The medium was formulated as per the design and the flask culture experiments on dye decolorization was assayed as described earlier and the response was calculated as the rate of dye decolorization and expressed in percent.
The effect of each variable was calculated using the following equation; (25).
E is the effect of tested variable, M+ and M-are
responses (dye decolorization) of trials at which the parameter was at its higher and lower levels respectively and N is the number of experiments carried out.
The standard error (SE) of the variables was the square root of variance and the significance level (p – value) of each variable was calculated by using Student’s t – test (E xi is the effect of the tested variable).
Optimization of concentrations of the selected varibles using RSM. RSM approach was used to identify the optimum conditions for a multivariable system, and it can predict the combined effect of some variables. The screened medium components affecting dye decolorization were optimized using central composite design (CCD) (26, 27). According to this design, the total number of treatment combinations is 2k+2k + n0 where ‘k’ is the number of independent
variables and n0 is the number of experiment repetitions
at the center point. For statistical calculation, the
variables Xi have been coded as xi according to the following transformation (25):
Xi = Xi _ X0/δX
where xi is a dimensionless coded value of the variable Xi, X0 is the value of the Xiat the center point,
and δXis the step change. A 2k-factorial design with
eight axial points and six replicates at the center point with a total number of 30 experiments was employed for optimizing the medium components (25).
The behavior of the system was explained by the following quadratic equation:
Y= β0 + ∑ βi Xi +∑ βij Xi2
+ ∑ βij Xi Xi
where Y is the predicted response, β0 the intercept
term, βiis the linear effect, βii is the squared effect, and
βijis the interaction effect (25). The statistical model was validated with respect to dye decolorization under the conditions predicted by the model in flask conditions. Samples were withdrawn at the desired intervals and dye decolorization was determined as described above.
ReSULTS
Optimization of bioprocess variables using RSM and factorial design. Plackett Burman design (25) was constructed to determine the nutritional requirements for color removal. Among the variables screened, the most influencing factors for decolorization with high significance level indicated by Pareto chart were in the order of agitation, incubation time, pH and glucose
Run pH Temp
(oC) Agitation(rpm) Incubationtime (hrs) concentrationDye
(mg/L)
Glucose
(%) Peptone(%) Magnesium sulphate (%)
Chromium
(mM) Phenols(mM) Sodium(%)
1 3 20 0 0 10 0.1 0.1 0.05 0.05 0.05 0.05
2 11 20 300 72 1000 0.1 0.1 0.05 0.5 0.05 0.5
3 11 60 0 0 10 1.0 0.1 0.5 0.5 0.05 0.5
4 11 20 300 72 10 1.0 0.5 0.5 0.05 0.05 0.05
5 3 20 0 72 10 1.0 0.5 0.05 0.5 0.5 0.5
6 11 20 0 0 1000 0.1 0.5 0.5 0.05 0.5 0.5
7 3 60 300 0 1000 1.0 0.5 0.05 0.05 0.05 0.5
8 11 60 0 72 1000 1.0 0.1 0.05 0.05 0.5 0.05
9 3 20 300 0 1000 1.0 0.1 0.5 0.5 0.5 0.05
10 11 60 300 0 10 0.1 0.5 0.05 0.5 0.5 0.05
11 3 60 0 72 1000 0.1 0.5 0.5 0.5 0.05 0.05
12 3 60 300 72 10 0.1 0.1 0.5 0.05 0.5 0.5
Run A B C D e F G H J K L % decolorization
1 3 20 0 0 10 0.1 0.1 0.05 0.05 0.05 0.05 2.98
2 11 20 300 72 1000 0.1 0.1 0.05 0.5 0.05 0.5 71.21
3 11 60 0 0 10 1.0 0.1 0.5 0.5 0.05 0.5 7.75
4 11 20 300 72 10 1.0 0.5 0.5 0.05 0.05 0.05 74.95
5 3 20 0 72 10 1.0 0.5 0.05 0.5 0.5 0.5 6.04
6 11 20 0 0 1000 0.1 0.5 0.5 0.05 0.5 0.5 8.47
7 3 60 300 0 1000 1.0 0.5 0.05 0.05 0.05 0.5 65.42
8 11 60 0 72 1000 1.0 0.1 0.05 0.05 0.5 0.05 46.97
9 3 20 300 0 1000 1.0 0.1 0.5 0.5 0.5 0.05 30.66
10 11 60 300 0 10 0.1 0.5 0.05 0.5 0.5 0.05 54.45
11 3 60 0 72 1000 0.1 0.5 0.5 0.5 0.05 0.05 29.54
12 3 60 300 72 10 0.1 0.1 0.5 0.05 0.5 0.5 69.98
Table 2. Plackett - Burman design for evaluating factors influencing Congo red degradation by A. niger HM11
A: pH B: Temperature (oC) C: Agitation (rpm)
D: Incubation time (hrs) E: Dye concentration (mg/L) F: Glucose (%)
G: Peptone (%) H: Magnesium sulphate (%) J: Chromium (mM)
K: Phenol (mM) L: Sodium salts (%)
were identified and selected for further optimization.
Plackett -Burman design. The influence of eleven factors (A -L) namely pH, temperature, agitation, incubation time, dye concentration, glucose, ammonium nitrate, magnesium sulphate, chromium, phenols and trace salts in the dye decolorization was investigated in 12 runs using Plackett – Burman design. Table 2 represents the Plackett–Burman design for 11 selected variables and the corresponding response for dye decolorization varied from 2.98 to 74.95 %.
The Pareto chart illustrates the order of significance (agitation, incubation time, pH and glucose) of the variables affecting dye decolorization (Fig. 1). In the present study, statistical analysis demonstrates that the model F value of 0.75 is significant. The values of p < 0.05 indicate model terms are significant (Table 3). Regression analysis was performed on the results and first order polynomial equation was derived representing dye decolorization (Congo red) as a function of the independent variables.
% Decolorization = 39.04 + 4.93 A + 22.08 C + 10.75 D + 3.01 F
The magnitude of the effects indicates the level
of significance of the variable on decolorization of Congo red. Consequently, statistically significant variables with positive effect were further investigated to find the optimal range of these variables.
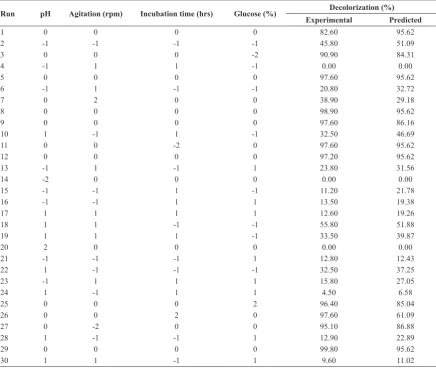
Central Composite Design (CCD). The result of 30 run CCD in four variables; pH, agitation, incubation time and glucose, chosen for optimization of dye decolorization process by A. niger HM11, are shown in Table 4. The table shows percent decolorization corresponding to combined effect of four components in their specified ranges.
Decolorization varied markedly with the conditions tested, in the range of 0 – 99.8 %. Lowest decolorization was observed when agitation was high with low pH value (run 4, 14 and 20). Decolorization value of 99.8 % was observed at pH 6, agitation of 150 rpm, incubation time of 36 h and glucose of 1.0 g/L (run 29). The experimental results suggest that these variables strongly affect the decolorization process.
The results obtained were subjected to analysis of variance with the regression model given as:
Source Sum of square Degree of freedom Mean square F – Value p - Value
Model 8571.060 7 1224.440 0.758 0.003 Significant
A-pH 291.856 1 291.856 6.855 0.059
C-Agitation 5848.550 1 5848.550 137.365 0.000
D-Incubation time 1385.890 1 1385.890 32.550 0.005
F-Glucose 7.239 1 7.239 0.170 0.701
Residual 170.307 4 42.577
Cor Total 8741.360 11
Table 3. Analysis of variance for Congo red decolorization.
C D -31.15 A2 -14.40 B2 -6.75 C2 -7.74 D2 where, Y is the response value (% decolorization) and A, B, C and D are the coded levels of pH, agitation, incubation time and glucose concentration, respectively. The adequacy of the model was checked using analysis of variance and the results are presented
in Table 5.
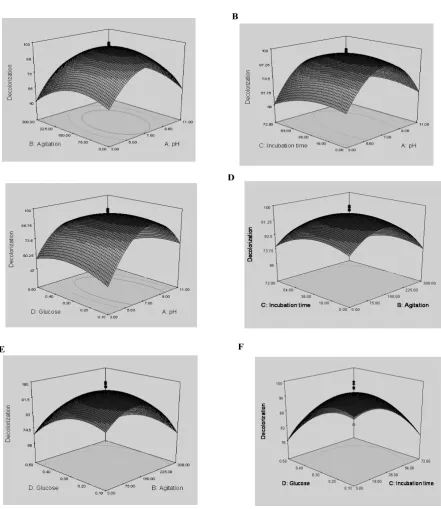
Interaction effects and optimal levels of the variables were determined by plotting the response surface contour plots (Fig. 2) which showed the behavior of response (% decolorization) with respect to simultaneous change in two variables.
Run pH Agitation (rpm) Incubation time (hrs) Glucose (%) Decolorization (%)
experimental Predicted
1 0 0 0 0 82.60 95.62
2 -1 -1 -1 -1 45.80 51.09
3 0 0 0 -2 90.90 84.31
4 -1 1 1 -1 0.00 0.00
5 0 0 0 0 97.60 95.62
6 -1 1 -1 -1 20.80 32.72
7 0 2 0 0 38.90 29.18
8 0 0 0 0 98.90 95.62
9 0 0 0 0 97.60 86.16
10 1 -1 1 -1 32.50 46.69
11 0 0 -2 0 97.60 95.62
12 0 0 0 0 97.20 95.62
13 -1 1 -1 1 23.80 31.56
14 -2 0 0 0 0.00 0.00
15 -1 -1 1 -1 11.20 21.78
16 -1 -1 1 1 13.50 19.38
17 1 1 1 1 12.60 19.26
18 1 1 -1 -1 55.80 51.88
19 1 1 1 -1 33.50 39.87
20 2 0 0 0 0.00 0.00
21 -1 -1 -1 1 12.80 12.43
22 1 -1 -1 -1 32.50 37.25
23 -1 1 1 1 15.80 27.05
24 1 -1 1 1 4.50 6.58
25 0 0 0 2 96.40 85.04
26 0 0 2 0 97.60 61.09
27 0 -2 0 0 95.10 86.88
28 1 -1 -1 1 12.90 22.89
29 0 0 0 0 99.80 95.62
30 1 1 -1 1 9.60 11.02
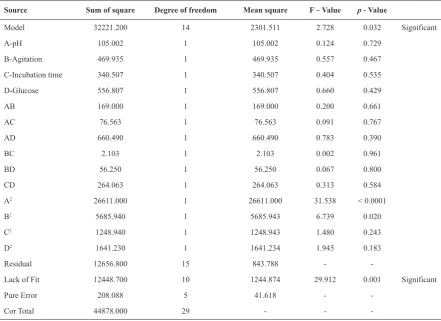
Table 5. ANOVA for the experimental results of the central composite design (quadratic model)
Source Sum of square Degree of freedom Mean square F – Value p - Value
Model 32221.200 14 2301.511 2.728 0.032 Significant
A-pH 105.002 1 105.002 0.124 0.729
B-Agitation 469.935 1 469.935 0.557 0.467
C-Incubation time 340.507 1 340.507 0.404 0.535
D-Glucose 556.807 1 556.807 0.660 0.429
AB 169.000 1 169.000 0.200 0.661
AC 76.563 1 76.563 0.091 0.767
AD 660.490 1 660.490 0.783 0.390
BC 2.103 1 2.103 0.002 0.961
BD 56.250 1 56.250 0.067 0.800
CD 264.063 1 264.063 0.313 0.584
A2 26611.000 1 26611.000 31.538 < 0.0001
B2 5685.940 1 5685.943 6.739 0.020
C2 1248.940 1 1248.943 1.480 0.243
D2 1641.230 1 1641.234 1.945 0.183
Residual 12656.800 15 843.788 -
-Lack of Fit 12448.700 10 1244.874 29.912 0.001 Significant
Pure Error 208.088 5 41.618 -
-Cor Total 44878.000 29 - -
-CV - 6.03; R2 - 0.7180
Fig. 1. Pareto chart for Plackett Burman design for 11 factors on Congo red decolorization by Aspergillus niger HM11.
Fig.1.
Pareto chart for Plackett Burman design for 11 factors on Congo red
decolorization by
Aspergillus niger
HM11
A: pH B: Temperature C: Agitation D: Incubation time E: Dye concentration F: Glucose
G: Ammonium nitrate H: Magnesium sulphate J: Chromium
K: Phenols L: Trace salts
Positive Effects
Negative Effects
t-value of (
e
ffect)
11.72
8.79
5.86
2.93
0.00
Rank PAReTO CHART
Bonferroni limit 5.74851
t-value limit 2.77645
1 2 3 4 5 6 7 8 9 10 11
A D C
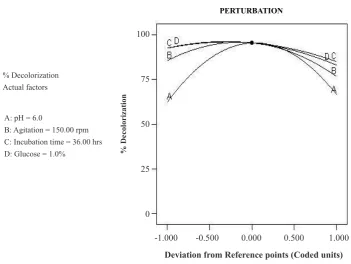
Validation of the model. The application of an experimental design for optimization of the decoloriza-tion ability of fungal strain A. niger HM 11 on Congo red was performed. The maximum experimental response for dye decolorization was 99.80 % whereas the predicted value was 95.62 % indicating a strong
concurrence between them. The optimum values of the tested variables are pH (6.0), agitation (150 rpm), incubation time (36 hrs) and glucose (1.0%) as shown in perturbation graph (Fig. 3). In this case, the value of the determination coefficient indicates the reliability of the model.
A B
C D
e F
Fig. 2. Three dimensional response surface plot for the effect of (A) pH, agitation; (B)
pH, incubation time; (C) pH, glucose; (D) agitation, incubation time; (E) agitation, glucose; (F) incubation time, glucose on decolorization of Congo red byAspergillus niger HM11
A B
C D
e F
Fig. 2. Three dimensional response surface plot for the effect of (A) pH, agitation; (B)
pH, incubation time; (C) pH, glucose; (D) agitation, incubation time; (E) agitation, glucose; (F) incubation time, glucose on decolorization of Congo red byAspergillus niger HM11
DISCUSSION
Microorganisms are capable of utilizing a variety of complex chemicals including dyes as their sole source of carbon but only few researchers have been successful in isolating such culture (28). Among the variables screened, the most effective factors with high significance level indicated by Pareto chart were agitation, incubation time, pH and glucose, in that order. In line with our studies, Mohana et al. (29) observed glucose was the best carbon source supporting maximum decolorization of anaerobically treated distillery effluent. Similar reports were given by Thongchai and Worrawit (30) reporting decrease in decolorization pattern of Fast red (FR) might be due to the reduction reaction involving the nitrogen in the medium and the nitrogen in the dyes and they have stated that increase in glucose, KH2PO4,
MgSO4.7H2O, and NaCl levels had a positive effect on FR decolorization ,whereas, contrarily, increase in (NH4)2SO4 and K2HPO4 concentrations led to a negative effect on decolorization of FR.
Data of Table 4 shows percent decolorization corresponding to combined effect of four components in their specified ranges. The analysis of variance of the quadratic regression model suggested that the model is very significant as was evident from the
Fisher’s F – test. The R2 value (multiple correlation
coefficient) closer to 1 denotes better correlation between the experimental and predicted responses. In the present case, a low CV (6.03) denotes the experiments performed are reliable. The p value denotes the significance of coefficients and is also important in understanding the pattern of mutual interactions between the variables. Similar R2 values
were reported which confirmed that coefficient of determination (R2) equation was highly reliable and
can be concluded that such studies are therefore very useful to predict variables for effective dye removal (31).
The 3D response surface plots described by the regression model were drawn to illustrate the effects of the independent variables and combined effects of each independent variable upon the response variable. In line with the present findings, similar reports on such decolorization pattern with similar bioprocess variables was observed during decolorization of 100 mg/L of Reactive Blue-25 by A. ochraceus NCIM-1146 at pH 5.0 (32), agitation speed of 100 – 150 rpm influenced better decolorization of Astrazon red FBL by Funalia trogii (33). Tatarko and Bumpus (34) showed 500mg/L of Congo red was 70% decolorized in 2 days by Phanerochaete chrysosporium. Similar to the present study, 3.0 g/L of glucose was used for
Fig. 3. Perturbation graph showing the optimum values of the tested variables.
PeRTURBATION
Fig. 3.
Perturbation graph showing the optimum values of the tested variables
% Decolorization Actual factors
A: pH = 6.0
B: Agitation = 150.00 rpm C: Incubation time = 36.00 hrs D: Glucose = 1.0% % Decolorization
100
75
50
25
0
-1.000 -0.500 0.000 0.500 1.000
decolorization of textile wastewater employing A. niger to obtain maximum decolorization (35).
The overall results show that this fungus has great possibilities to decolorize the textile dyes present in the effluents of textile industries and further reactor scale studies are required for actual industrial applications.
ACKNOWLeDGeMeNTS
K. Karthikeyan acknowledges UGC, New Delhi, India and K. NanthakumaracknowledgeCSIR, New Delhi, India for providing financial support and Department of Environmental Sciences, Bharathiar University, Coimbatore, Tamilnadu, India for providing facilities for the study.
ReFeReNCeS
Akhtar S, Khan AA, Husain Q. Potential of immobilized 1.
bitter gourd (Momordica charantia) peroxidases in
the decolorization and removal of textile dyes from
polluted wastewater and dyeing effluent. Chemosphere
2005;60: 291-301.
Ishikawa Y, Esker T, Leder A. Chemical Economics 2.
Handbook: Dyes. 2000; SRI, Menlo Park, CA. Lin SH, Peng FC. Treatment of textile wastewater by 3.
electrochemical methods. Water Res 1994; 28: 277-282.
Lin SH, Peng FC. Continuous treatment of textile 4.
wastewater by combined coagulation, electrochemical
oxidation and activated sludge. Water Res 1996; 30:
587-592.
Moreira MT, Mielgo I, Feijoo G, Lema JM. Evaluation 5.
of different fungal strains in the decolorization of
synthetic dyes. Biotechnol Lett. 2000; 22: 1499-1503.
Zimmerman T, Kulla HG, Leisinger T. Properties of 6.
purified orange II azo reductase, the enzyme initiating
azo dye degradation by Pseudomonas KF46. Eur J
Biochem 1982; 129: 197-203.
Sani RK, Banerjee UC. Decolorization of 7.
triphenylmethane dyes and textile and dye-stuff
effluent by Kurthia sp. Enzyme Microb Technol 1999; 24:
433-437.
Gold MH, Alic M. Molecular biology of lignin-8.
degrading basidomycete Phanerochaete chrysosporium.
Microbiol Rev 1993; 57: 605-622.
Swamy J, Ramsay JA. The evaluation of white rot fungi 9.
in the decolorization of textile dyes. Enzyme Microb
Technol 1999; 24: 130-137.
Balan DSL, Monteiro RTR. Decolorization of textile 10.
indigo dye by ligninolytic fungi. J Biotechnol 2001;
89:141-145.
Martins MAM, Cardoso MH, Queiroz MJ, Ramalho 11.
MT, Carnpos AMO. Biodegradation of azo dyes by the
yeast Candida zeylanoides in batch aerated cultures.
Chemosphere 1999; 38: 2455-2460.
Meehan C, Bannat IM, McMullan G, Nigam P, Smyth 12.
F, Marchant R. Decolorization of Remazol black-B
using a thermotolerant yeast, Kluyveromyces marxianus
IBM3. Environ Int 2000; 26: 75-79.
Zhou W, Zimmermann W. Decolorization of industrial 13.
effluents containing reactive dyes by actinomycetes.
FEMS Microbiol Lett 1993; 107: 157-162.
Dilek FB, Taplamacioglu HM, Tarlan E. Color and 14.
AOX removal from pulping effluents by algae. Appl
Microbiol Biotechnol 1999; 52: 581-591.
Tarpley WG, Miller JA, Miller EC. Adducts from the 15.
reaction of N-benzyloxy-N-methyl-4-aminoazobenzene
with deoxyguanosine or DNA in vitro and from hepatic
DNA of mice treated with N-methyl-or N,N
-dimethyl-4-aminoazobenzene. Cancer Res. 1980; 40: 2493-2499.
Yoo ES, Libra J, Adrian L. Mechanism of decolorization 16.
of azo dyes in anaerobic mixed culture. J Environ Eng.
2001;127: 844-849.
Zille A, Tzanov T, Gubitz GM, Cavaco-Paulo M. 17.
Immobilized laccase for decolorization of Reactive
black 5 dyeing effluent. Biotechnol Lett 2003; 25:
1473 -1477.
Couto SR, Sanroman MA, Gubitz GM. Influence of 18.
redox mediators and metal ions on synthetic acid dye
decolorization by crude laccase from Trametes hirsuta.
Chemosphere 2005;58: 417-422.
Minussi RC, Moraes SG, Pastore GM, Duran N. 19.
Biodecolourization screening of synthetic dyes by four white-rot fungi in a solid medium: possible role of
siderophores. Lett Appl Microbiol 2001; 33: 21-25.
Couto SR, Moldes D, Liebanas A, Sanroman A. 20.
Investigation of several bioreactor configurations for
laccase production by Trametes versicolor operating in
solid-state conditions. Biochem Eng J 2003; 15: 21-26.
Blanquez P, Caminal G, Sarra M, Vicent T. The effect 21.
of HRT on the decolourisation of the Grey Lanaset G
textile dye by Trametes versicolor. Chem Eng J 2007;
126: 163-169.
Liu BL, Tzeng YM. Optimization of growth medium for 22.
production of spores from Bacillus thuringiensis using
response surface methodology, Bioprocess Eng 1998;
18: 413-418.
Anjum MF, Tasadduq I, Al-Sultan K. Response surface 23.
methodology: A neural network approach. Eur J Oper
Res 1997; 101: 65-73.
Myers RH, Montgomery DC. Response surface 24.
methodology: Process and product optimization using designed experiments. 1995; New York: John Wiley & Sons, Inc.
Plackett RL, Burman JP. The design of optimum 25.
multifactorial experiments. Biometrica. 1946;33: 305-325.
Box GEP, Wilson KB. On the experimental attainment 26.
of optimum conditions. J Roy Stat Soc B 1951; 13:
1-45.
Box GEP, Hunter JS. Multifactor experimental design 27.
for exploring the response surfaces. Ann Math Stat
1957; 28: 195-242.
Sarnaik S, Kanekar P. Biodegradation of Methyl 28.
Violet by Pseudomonas mendocina MCM B-402. Appl
Mohana S, Desai C, Madamwar D. Biodegradation 29.
and decolorization of anaerobically treated distillery
spent wash by a novel bacterial consortium. Bioresour
Technol 2007; 98: 333-339.
Thongchai PM, Worrawit L. Decolorization of reactive 30.
dyes with different molecular structures under different
environmental conditions. Water Res 2000;34: 4177-4184.
Li X, Jia R, Li P, Ang S. Response surface analysis for 31.
enzymatic decolorization of Congo red by manganese
peroxidase. J Mol Catal B: Enzymatic 2009; 56: 1-6.
Parshetti GK, Kalme SD, Gomare, SS. Biodegradation 32.
of Reactive blue 25 by Aspergillus ochraceus
NCIM-1146. J Biotechnol 2007; 98: 3638-3642.
Yesilada O, Chin S, Asma D. Decolourisation of 33.
the textile dye Astrazon red FBL by Funalia trogii.
Bioresour Technol 2002;81: 155-157.
Tatarko M, Bumpus JA. Biodegradation of Congo red 34.
by Phanerochaete chrysosporium. Water Res 1998; 32: 1713-1717.
Assadi, MM, Jahangiri MR. Textile wastewater 35.
treatment by Aspergillus niger. Desalination 2001; 141: