Research Paper:
Comparing Steady-State Visually Evoked
Potentials Frequency Estimation Methods in Brain-Computer
Interface With the Minimum Number of EEG Channels
Mehrnoosh Neghabi1 , Hamid Reza Marateb1* , Amin Mahnam1
1. Department of Biomedical Engineering, Faculty of Engineering, University of Isfahan, Isfahan, Iran.
* Corresponding Author: Hamid Reza Marateb, PhD.
Address: Department of Biomedical Engineering, Faculty of Engineering, University of Isfahan, Isfahan, Iran.
Tel: +98 (31) 37935616
E-mail: [email protected]
Introduction:Brain-Computer Interface (BCI) systems provide a communication pathway between users and systems. BCI systems based on Steady-State Visually Evoked Potentials (SSVEP) are widely used in recent decades. Different feature extraction methods have been introduced in the literature to estimate SSVEP responses to BCI applications.
Methods:In this study, the new algorithms, including Canonical Correlation Analysis (CCA), Least Absolute Shrinkage and Selection Operator (LASSO), L1-regularized Multi-way CCA (L1-MCCA), Multi-set CCA (MsetCCA), Common Feature Analysis (CFA), and Multiple Logistic Regression (MLR) are compared using proper statistical methods to determine which one has better performance with the least number of EEG electrodes.
Results: It was found that MLR, MsetCCA, and CFA algorithms provided the highest performances and significantly outperformed CCA, LASSO, and L1-MCCA algorithms when using 8 EEG channels. However, when using only 1 or 2 EEG channels d, CFA method provided the highest F-scores. This algorithm not only outperformed MLR and MsetCCA when applied on different electrode montages but also provided the fastest computation time on the test set.
Conclusion:Although MLR method has already demonstrated to have higher performance in comparison with other frequency recognition algorithms, this study showed that in a practical SSVEP-based BCI system with 1 or 2 EEG channels and short-time windows, CFA method outperforms other algorithms. Therefore, it is proposed that CFA algorithm is a promising choice for the expansion of practical SSVEP-based BCI systems.
Article info:
Received: 18 Jun 2017
First Revision: 25 Jul 2017
Accepted: 03 Jun 2018
Available Online: 01 May 2019
Keywords:
Brain-Computer Interface
(BCI), Electroencephalogram (EEG), Feature extraction, Steady-State Visually Evoked Potential (SSVEP)
Citation Neghabi, M., Marateb, H. R., & Mahnam, A. (2019). Comparing Steady-State Visually Evoked Potentials Frequency Estimation Methods in Brain-Computer Interface With the Minimum Number of EEG Channels. Basic and Clinical Neurosci-ence, 10(3), 245-256. http://dx.doi.org/10.32598/bcn.9.10.200
: http://dx.doi.org/10.32598/bcn.9.10.200 Use your device to scan
and read the article online
1. Introduction
rain-Computer Interface (BCI) can pro-vide a new way of communication and control between the human brain and ex -ternal devices. Although this communica -tion method could be used by everyone, its applications have been mostly used for the patients with disabilities so far (Resalat & Saba, 2016) to improve their quality of life (Tello, Mül
-ler, Bastos-Filho, & Ferreira, 2014). Recently, many new BCI applications have been validated for disabled people, including neuroprostheses, spelling for commu -nication, control of artificial hands and legs, and playing with games (Zhang, Xu, Cheng, & Yao, 2014a).
There are different techniques to detect brain activities for the realization of a BCI system, including Electro -encephalography (EEG), functional near-infrared spec -troscopy, Magnetoencephalography (MEG) and func -tional Magnetic Resonance Imaging (fMRI). Recording EEG signals from the scalp is a common approach with the neural data signals for BCI devices since it can be
easily recorded in most of the circumstances by rather simple equipment. Also, it has a high temporal resolution (Zhang, Zhou, Jin, Wang, & Cichocki, 2014b).
A variety of EEG-based BCI paradigms have been proposed based on different brain responses to transfer the user intent to the computer, such as Sensorimotor Rhythms (SMRs), Slow Cortical Potentials (SCPs), P300 Event-Related Potentials (ERPs), and Steady-State Visu -ally Evoked Potentials (SSVEP) (Zhang et al., 2014b). Recently research on SSVEP-based BCI systems has been extended because of their high Information Trans -fer Rate (ITR) and easy training phase (Ge et al., 2017).
SSVEP is a neurophysiological reaction excited in the oc -cipital and occipitoparietal region of the brain by a flicker -ing visual stimulus at a specified frequency. Responses of SSVEP contain the basic frequency of the visual stimulus and some of its harmonics are sometimes accompanied with a sub-harmonic. Therefore, SSVEP-based BCI sys -tems understand the user commands when the user looks at one stimulus by identifying the corresponding frequency components in the EEG (Wang et al., 2016).
Highlights
• The Common Feature Analysis (CFA) method provides the highest F-scores in comparison with Multivariate Linear Regression (MLR) and Multiset Canonical Correlation (MsetCCA) when only one or two EEG channels are used.
• The MLR method could use information in multichannel EEG towards providing higher F-scores.
• The CFA method was less sensitive to the placement of Oz electrode compared with the other methods.
• Oz-Pz montage has better F-score value than the other monopolar montages.
• The CFA algorithm takes the lowest computational time which is important for online implementation of the brain-computer interface system.
Plain Language Summary
Brain-Computer Interface (BCI) is a new way of communication for people with disabilities to improve their qual -ity of life. Applications include spelling for communication, control of artificial limbs, and home automation systems. Steady-State Visual-Evoked Potential (SSVEP)-based BCI systems are widely used in recent decades because of their high information transfer rate and easy training phase. Different methods have been introduced in the literature to estimate SSVEP responses for BCI applications. In this study, these new algorithms are compared using proper statisti -cal methods to determine which one has better performance when a few numbers of EEG electrodes are used. This is important for developing a practical BCI system. Our results show that the Common Feature Analysis (CFA) method provides the highest accuracy in comparison with the other methods when only one or two EEG channels are used. Also, it is less sensitive to the placement of the electrodes compared with the other methods, and it has the lowest computational time (which is important for online implementation of a BCI system). Therefore, the CFA method is a promising choice for the expansion of practical SSVEP-based BCI systems.
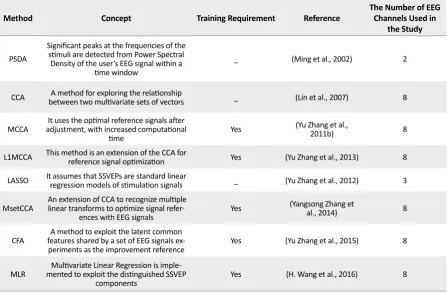
Different approaches have been introduced in the lit -erature to estimate SSVEP responses for BCI applications (Liu, Chen, Ai, & Xie, 2014). A conventional method is the Power Spectral Density Analysis (PSDA) (Wei, Xiao, & Lu, 2011). However, when using this algorithm, the length of processing time window has to be typically more than 3 s to have acceptable frequency resolution, resulting in low ITR (Ming, Xiaorong, Shangkai, & Dingfeng, 2002).
Canonical Correlation Analysis (CCA) (Lin, Zhang, Wu, & Gao, 2007) is a method for exploring the re -lationships between two multivariate sets of vectors. One of these variables is the EEG signal from various channels and the other is the artificial sine-cosine sig -nal. Researchers have demonstrated that CCA usually outperforms PSDA (Wang et al., 2014). Moreover, high accuracy BCI systems could be developed using CCA in which their required data frame is as short as 2 s (Zhang, Jin, Qing, Wang, & Wang, 2012).
Zhang et al. (2011)(Cited byWang et al., 2016) pro-posed a multi-way development of standard CCA (MCCA) by inspecting the correlation among various variables, including space and trial modes of multidi -mensional EEG data and sine-cosine signals. MCCA and its L1-regularized development (L1-MCCA) (Zhang et
al., 2013) have been introduced to supply refined SS -VEP recognition fulfillment in comparison with standard CCA (Wang et al., 2016).
Least Absolute Shrinkage and Selection Operator (LASSO) algorithm (Zhang et al., 2012) is another method proposed in the literature for computing the contribution of different stimulus frequencies and their harmonics in the recorded EEG signal. The frequency with maximum contribution degree was identified as the goal frequency. LASSO algorithm has been shown to improve frequency identification performance with a shorter time window compared with CCA algorithm (Liu et al., 2014).
Zhang et al. (2014b) introduced a Multi-set CCA meth -od (MsetCCA) for frequency identification in SSVEP. In this method, training information is used for reference signals (Zhang et al., 2014b). Accuracy of MsetCCA ap -proach is more than CCA and MCCA methods when us -ing time windows shorter than 2 s (Zhang et al., 2014b).
Zhang et al. (2015) considered that a set of EEG signals would share certain common components in response to a specified stimulus on different subjects. These EEG signals contain common components which may have
Table 1. Different methods used for SSVEP recognition in BCI
Method Concept Training Requirement Reference The Number of EEG Channels Used in
the Study
PSDA
Significant peaks at the frequencies of the stimuli are detected from Power Spectral Density of the user’s EEG signal within a
time window
_ (Ming et al., 2002) 2
CCA between two multivariate sets of vectors A method for exploring the relationship _ (Lin et al., 2007) 8
MCCA adjustment, with increased computational It uses the optimal reference signals after
time Yes
(Yu Zhang et al.,
2011b) 8
L1MCCA This method is an extension of the CCA for reference signal optimization Yes (Yu Zhang et al., 2013) 8
LASSO It assumes that SSVEPs are standard linear regression models of stimulation signals _ (Yu Zhang et al., 2012) 3
MsetCCA An extension of CCA to recognize multiple linear transforms to optimize signal refer
-ences with EEG signals Yes
(Yangsong Zhang et
al., 2014) 8
CFA features shared by a set of EEG signals exA method to exploit the latent common
-periments as the improvement reference Yes (Yu Zhang et al., 2015) 8
MLR mented to exploit the distinguished SSVEP Multivariate Linear Regression is imple
characteristics of SSVEP responses. Therefore, these components could be further efficient reference data for SSVEP identification in using correlation methods. So they proposed a Common Feature Analyzes (CFA) method (Zhang, Zhou, Jin, Wang, & Cichocki, 2015). It outperformed SSVEP identification accuracy compared with those of the CCA and the MCCA methods in a 0.5-s time window (Zhang et al., 2015).
Another approach that has been recently proposed for distinguishing features of SSVEP is Multivariate Linear Regression (MLR) (Wang et al., 2016). This algorithm outperformed CCA and MCCA algorithms and especially provided higher classification accuracies when using a short-time window of 1 s (Wang et al., 2016). The above-mentioned methods and their properties are listed in Table 1.
With the advancement in BCI research, these systems are coming out of the lab for practical applications. In addition to high accuracy and information transfer rate, user comfort is critical. It must be met at least in a level that a potential user accepts and continues to work with the system (Qing, Zheng, Yue, Yuankui, & Ge, 2015).
One of the significant factors to ensure user comfort is that the BCI system works with only a few EEG elec -trodes. A large number of electrodes increases the prepa -ration time beyond the acceptable level for practical use and increases the size and final cost of the system. On the other hand, achieving high and or enough accuracy and information transfer rate with a minimum number of electrodes is challenging due to the reduction of their available information. As shown in Table 1, most of the studies that proposed and compared algorithms for SS -VEP detection used a large number of EEG channels.
The goal of this study was to ascertain which of the newly-proposed algorithms (reviewed above) is more appropriate for the development of a practical SSVEP-based BCI system with high accuracy and information transfer rate when using a minimum number of elec -trodes. Here CCA (Lin et al., 2007), LASSO (Zhang et al., 2012), L1MCCA (Zhang et al., 2013), MsetCCA (Zhang et al., 2014b), CFA (Zhang et al., 2015) and MLR (Wang et al., 2016) methods are compared using proper statistical methods to determine their performance in real applications.
The rest of the paper is organized as follows. In the next section, information about the experimental protocol and the BCI methods used in this study as well as the statisti -cal methods are presented. Section 3 supplies the results
of the performance assessment. Ultimately, the discus -sion is provided in Section 4.
2. Methods
Numerous methods have been proposed for SSVEP frequency recognition in the literature. Of those, LASSO (Zhang et al., 2012), L1-MCCA (Zhang et al., 2013), MsetCCA (Zhang et al., 2014b), CFA (Zhang et al., 2015), and MLR (Wang et al., 2016) have demonstrated better performances and therefore we selected them for this study. Also, CCA method is a benchmark method and thus we selected it for this study. These algorithms are described as follows: SSVEP detection based on CCA; SSVEP detection based on LASSO; SSVEP de -tection based on L1MCCA; SSVEP de-tection based on MsetCCA; SSVEP detection based on CFA; SSVEP de -tection based on MLR.
CCA is a multivariate statistical method to explore the underlying correlation between two sets of data. The first set (X) is the EEG recorded from several channels while the second one (Y) is the sine-cosine reference signals reconstructed as below:
(1)
Y= ; t= , , ..., 1 2F n
S FS FS sin(2π(ƒi )t)
sin(2π(Nƒi )t)
cos(2π(ƒi )t)
cos(2π(Nƒi )t)
, where N refers to the number of harmonics, fi denotes the ith stimulus frequency (fundamental frequency), n
represents the number of sampling points, and Fs is the sampling rate.
CCA tries to seek a pair of linear transforms, Wx and Wythat maximizes the correlation between x=XTW
x and
y=YTW
y. The following optimization problem is solved
for each frequency (Zhang et al., 2011).
(2)
pi= max E[xTy] = WxTXYTWy E[xTx]E[yTy] W
xTXXT WxYTWyYTWy WxWy
, where pi is the association between the recorded sig -nals and the synthetic waveform of the ithfrequency. The
In LASSO algorithm, each EEG trial assumes that SS -VEPs are standard linear regression models (Eq. 1) for the response y ∈ Rn.
(3)
y=Xβ+ε
, where X=(x1,x2,...,xp) denotes the predictor variables, y is the response, and ε represents a noise vector. LASSO approximation is given by:
(4)
β=argmin(||y-Xβ||2 2+λ||β||1) ̂
β
, where , ||·||1, ||·||2 demonstrate the l1-norm and l2-norm, respectively (Tibshirani, 2011) and λ is a penalty parameter. The optimization problem demonstrated by Eq. (2) was re -solved by quadratic programming (Schittkowski, 1986).
To create the model of SSVEP identification, a sym -metric square-wave signal X, corresponding to the stim -ulus frequencies, is considered as the reference signal shown in Eq. (3).
(5)
X= ;t= , ,...,1 2F n
S FS FS sin(2π(ƒi )t)
sin(2π(Nƒi )t)
cos(2π(ƒi )t)
cos(2π(Nƒi )t)
, where N refers to the number of harmonics, fi denotes the ith
stimulus frequency (fundamental frequency), n represents the number of sampling points, and FS is the sampling rate.
The LASSO estimator β ̂ among the EEG signals y and the artificial reference set X were calculated by Eq. (2).
Then the contribution degree of each stimulus frequen -cy is calculated for all the recorded channels of EEG as:
(6)
CDi=∑Mk=1∑2Kj=1|βki,j| M
, where M equals the number of channels, K denotes the number of harmonics, and CDirefers to the contribu -tion degree of the ith square-wave in the signal. The max -imum contribution implies the target frequency which the subject gazing at (Zhang et al., 2012).
L1-regularization (L1-MCCA) was proposed in the lit -erature to give a function which can automatically select features for optimizing reference data in SSVEP-BCI detection (Zhang et al., 2017).
To construct the SSVEP recognition model, consider a three-way tensor X ∈ RI×n×K (channel×time×experiment)
formed by EEG signals recorded from some channels out of numerous experiments with a particular stimulus frequency and a signal collection Y ∈ R2N×n shown in Eq. (3).
The optimization problem in L1-MCCA is formulated as:
w1,w3,v=arg min 1
2||X×1w1T×3w3T-vTY||22+λ1||w1||1+λ2 ||v||1+λ3||w3||1
w1,w3,v
(7)
s.t. ||w1||2=||w3||2=||v||2=1
, where w1 ∈ RI , w
3 ∈ RK , v ∈ R2N are projection vec
-tors and λ1, λ2.λ3 are adjustment parameters. The LASSO estimation is equivalent to (5) (Tibshirani, 2011; Zhang et al., 2012) when any two of w1, w3 , and v are con -stant. This problem would be resolved by an alternating LASSO method (Zhang et al., 2013).
The Multiset CCA (MsetCCA) method was recently proposed for reference data optimization from a common component in numerous calibration experiments (Nakani
-shi, Wang, Wang, & Jung, 2015). MsetCCA was extended for correlation maximization among canonical variables from numerous collections of random variates with distin -guishing multiple linear transforms (Zhang et al., 2014b). Assume numerous groups of random variables Xi∈ RIi×J
(i=1,2,…,N). In order to maximize the throughout corre -lation across canonical variables, the MAXVAR objective function is characterized as:
(8)
max ρ=∑N
i≠jwiT Cij wj w1,…,wN
s.t.1N ∑N
i=1wTiCiiwi=1,
, where Cij=XiXjTis the between-set covariance matrix,
(9)
(R-S)w=ρSw
, where
R=
S= W=
,
, .
C11
C11 W1
CN1
0 WN
C1N
0 CNN
CNN ...
... ...
...
...
...
...
... ...
...
...
Assume, X1,m, X2,m, ..., XN,m ∈ RC×P (C channels×P points)
demonstrate EEG signals groups, including experiments at the m-th stimulus frequency fm. The MsetCCA is performed to distinguish numerous spatial filters w1,m, w2,m, ..., wN,m, to maximize throughout correlation between the canonical variables z ̃ ̃1,m, z2,m, ...,z ̃ with the linked spatial filtering Nm
zi,m=wT i,mXi,m
̃ (i=1,2,…,N). These canonical variables show the common components between numerous training sig -nals considered to have better accuracy of the real SSVEP specifications in comparison with sine-cosine reference sig -nals. Canonical variables were combined to construct the reference signal optimization at frequency fm. These opti -mized reference signals are defined as:
(10)
Ym=[z1,mT,z
2,mT,…,zN,mT]T
̃ ̃ ̃ .
For each stimulus frequency fm, the corresponding refer -ence signal Ymis consumed for computing the maximum correlation coefficients with the EEG signals (Zhang et al., 2014b).
Another approach is to explicitly model the common and distinct components. This approach has a similar concept with the multiset approach (Wang et al., 2016) to exploit the common features which multiple EEG signals share at the same stimulus frequency.
In this method, a set of matrices X={Xk ∈XIk×T:k=1,2,…,K}
, share at least one common dimension T. They can be, for example, a set of multichannel EEG signals (channel×time×point) recorded for the same visual stimulus but from different subjects. These data matrices can be factor -ized in a linked way shown in Eq. (9):
(11)
Xk= = AkBT+A
kBTk=Xk+Xk AkBT
K=[AkA ̌k ] - B-T
BT k
̌ - -- ̌ ̌ - ̌
k=1,2,…,K
, where B-∈RT×C, B k∈RT×R
̌ ̃ k, R
k=R ̃k+C is the number
of latent components with Rk<Ik and C is the number of common components. Finally, Āk and Ăk are the parti -tions of the mixing coefficients Ak corresponding to B- and B ̌ . For M stimulus frequencies, the common features k B-k(k=1,2,..., K) at each frequency would be exploited for a new test signal x ̌∈XRT; the target frequency is identified as (Zhang et al., 2015):
(12)
ft=arg max||xTB
k||2, (k=1,2,…,K) fk ̂
MLR is a technique for modeling the relationship between a scalar dependent vector and one or more independent vec -tors. Consider EEG training data X=[x1,x2,…,xN]∈RD×N,
where D demonstrates the dimension of feature (D=C channels×P temporal points) and N is the number of signal points. Corresponding to the training points, a matrix of the label is created, using one of M class coding. The goal of MLR is to find distinguished subspaces by minimizing the objective function as follows:
(13)
min12||(y(i)-(WTx(i)+b)||2 2
̃
W,b
, where W=[w1,w2,…,wC]∈RS×C demonstrates the projec
-tion matrix and b is the model separa-tion.
The model of MLR is then considered as:
(14)
W=arg min12 ∑N
i=1||y(i)-(WTx(i))||22
W ̃
or in the vectorized form:
(15)
W=arg min1
2||Y-WTX̃||2F W
, where ||.||F demonstrates the Frobenius norm. Then, the optimal solution is provided by:
(16)
W=(X̃X̃T)†X̃YT
, where (.)† demonstrates the Moore-Penrose pseudoin
2.1. Data Description
EEG data from an online available dataset (Wang et al., 2016) were used in our study. The dataset contained data from ten subjects (all males, aged from 21 to 27 years) and recorded from 8 channels (P7, P3, Pz, P4, P8, O1, Oz and O2). The sampling rate was fixed at 250 Hz. During the experiment, the participants were seated in a comfortable armchair 60 cm away from the center of the monitor. The experiment was performed in a shielded room. The EEG data were then bandpass filtered from 4 to 45 Hz. Four frequencies (6, 8, 9, and 10 Hz) were adopted in a recording session. The subjects were asked to gaze at each stimulus frequency for 4 s. Overall, there are 80 trials in this dataset. This dataset has been wide -ly used in the literature as the benchmark (Wang et al., 2016; Zhang et al., 2012;Zhang et al., 2014b;Zhang et al., 2013;Zhang et al., 2015).
2.2. Experimental evaluation
In this study, the new algorithms, including MLR and CFA are compared with MsetCCA, L1MCCA, LASSO, and CCA algorithms to assess their efficacy for target frequency detection in a practical BCI system. The num -ber of harmonics needed to define reference signals was set to 2 for CCA, LASSO, and L1-MCCA algorithms.
In LASSO and L1-MCCA methods, the lambda pa -rameters were set to 0.5 and 0.02, respectively (Zhang et al., 2012;Zhang et al., 2013). The leave-one-run-out cross-validation was used to assess the average detec -tion accuracy in the entire analyzed methods. The signals from 19 runs were used as training signals whereas the signals from the left-out runs were used for validation (Zhang et al., 2014b).
2.3. Validation
The performance of the methods was assessed using the F-score (F1 score). It was shown in the literature that this criterion is more suitable than the overall accuracy of multi-class problems (Sokolova & Lapalme, 2009) because the latter index overestimates the performance of the analyzed methods. Moreover, by using F-score, it is possible to analyze the performance of the system for each class better than the traditional accuracy mea -surements. For the calculation of F-score, first, the multi-class confusion matrix of four frequencies is created. Then, precision, sensitivity, and F-score are calculated for each frequency class as below:
(15)
Pr= TP
TP+FP
, where Pr is the precision TP and FP and are the num -ber of true and false positive predictions for each class.
(16)
Se= TP
TP+FN
, where Se is the sensitivity and FN is the number of false negative predictions for each class.
(17)
F-score= 2×Pr×Se Pr+Se
, where F-score is the harmonic mean of the preci -sion and sensitivity (=recall) of the corresponding class. This parameter is not dependent on TN (True Negative), and thus the performance of the analyzed system is not overestimated (Marateb, Mansourian, Adibi, & Farina, 2014).
2.4. Statistical methods
It is important to use proper statistical tests for rigor -ous comparison between different approaches, other -wise random or insignificant differences are considered as significant (Bossuyt et al., 2015;Karimimehr et al., 2017). The McNemar’s test (Webb & Copsey, 2011) was used to identify SSVEP frequency estimation algorithms outperforming the other methods. Pairwise comparisons were performed using the McNemar’s test. Then, the methods with higher and significant performance were shown as significantly outperforming methods.
For further analysis, GEE (Generalized Estimating Equation) (Hardin & Hilbe, 2007) was applied to de -termine any significant differences among the selected algorithms when different electrode montages (monopo -lar or bipo-lar) and the number of channels (1 or 2 chan -nels) were used with repeated measurements in the time windows of 1 second. The level of statistical significance was considered 0.1 to be on the safe side and not to miss significant differences in this small sample size data (Lavrakas, 2008).
3. Results
when all 8 channels of recorded EEG were used. MLR method outperformed the other 6 methods in terms of mean F-score performance for the time windows of 0.5 to 1.5 s. MsetCCA and CFA methods were ranked sec -ond, while the performance of the CFA method was sig -nificantly higher than that of MsetCCA method for the time window of 0.5 s (P<0.05). Overall, LASSO had the lowest performance compared with the others.
Overall, pairwise McNemar’s test of these results demonstrated that MLR, MsetCCA, and CFA algo -rithms significantly outperformed the other analyzed methods in the detection of gazed frequencies using 8 EEG channels (P<0.05). In fact, in the entire analysis windows, MLR, MsetCCA, CFA, L1-MCCA, CCA, and LASSO significantly outperformed 5, 3, 3, 2, 1, and 0 times in pairwise comparisons. Thus, only those
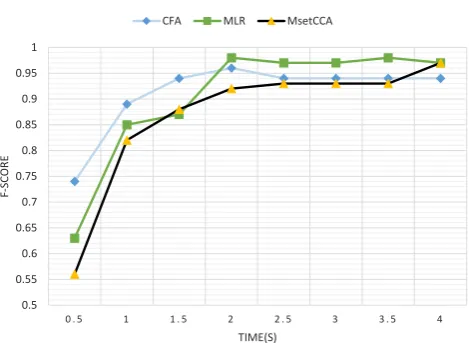
three methods were studied in the rest of the paper. In a practical SSVEP-based BCI system, when only one channel of EEG is used, the performance of the algo -rithms might change compared with when using more channels. Therefore, the F-score measures of MLR, MsetCCA, and CFA algorithms were compared when only one channel of EEG (Oz-Pz channel) is used (Diez, Mut, Laciar, & Avila, 2010)(Figure 2).
For one-channel EEG, McNemar’s test was imple -mented to determine significant differences between CFA, MLR, and MsetCCA methods in different time windows (Table 2). In time windows smaller than 2 s, the CFA method had better F-score in target frequency recognition than MLR and MsetCCA methods. To do further extensive analysis, the F-score values for MLR, CFA, and MsetCCA methods were calculated for a time
0.3 0.4 0.5 0.6 0.7 0.8 0.9 1
0 . 5 1 1 . 5 2 2 . 5 3 3 . 5 4
F-SC
OR
E
TIME(S) 8Channels
CFA MLR MsetCCA L1MCCA LASSO CCA
0.5 0.55 0.6 0.65 0.7 0.75 0.8 0.85 0.9 0.95 1
0 . 5 1 1 . 5 2 2 . 5 3 3 . 5 4
F-SC
OR
E
TIME(S) 1CHANNEL
CFA MLR MsetCCA
Figure 1. F-score of various methods for 8-channel analysis
0.3 0.4 0.5 0.6 0.7 0.8 0.9 1
0 . 5 1 1 . 5 2 2 . 5 3 3 . 5 4
F-SC
OR
E
TIME(S) 8Channels
CFA MLR MsetCCA L1MCCA LASSO CCA
0.5 0.55 0.6 0.65 0.7 0.75 0.8 0.85 0.9 0.95 1
0 . 5 1 1 . 5 2 2 . 5 3 3 . 5 4
F-SC
OR
E
TIME(S) 1CHANNEL
CFA MLR MsetCCA
window of 1 s, when different electrode montages (mo -nopolar or bipolar) and the number of channels (1 or 2 channels) were used (Table 2).
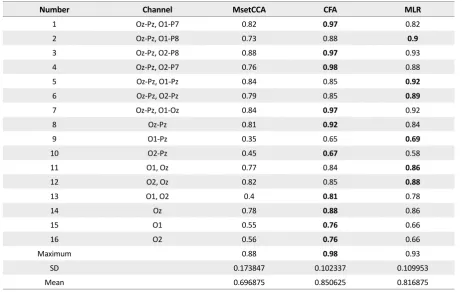
The results are based on leave-one-out cross-validation test on all 20 trials of the data. CFA and MLR methods outperformed MsetCCA in the entire scenarios. More -over, on average, CFA outperformed MLR method. Generalized Estimating Equation (GEE) test was ap -plied to determine any significant differences between these algorithms when different scenarios (Table 3) were used. The result showed that CFA method significantly outperformed the other two algorithms (P<0.07). Also,
MLR significantly outperformed MsetCCA method (P=0.001).
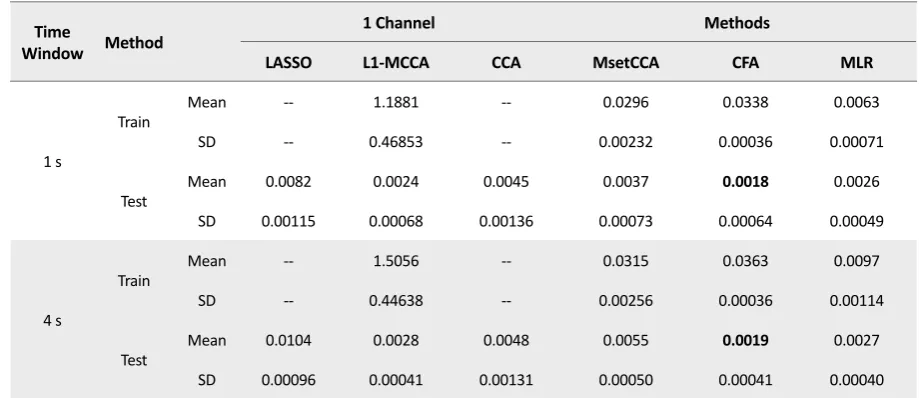
The other important factor in the development of an online BCI system is the computational cost of the al -gorithms. The average running time for 19 runs of al -gorithms was obtained on a laptop with Windows 8.1 Operating System and 2.6 GHz Intel Core i5 CPU with 2 GB RAM and all of the algorithms were implemented in MATLAB 2014a (Table 4). It should also be stated that the MLR and CFA methods were implemented in the vectorized form.
Table 2. Statistical analysis of F-score using McNemar's test
Time, s
Methods 0.5 1 1.5 2 2.5 3 3.5 4 0.5-4
CFA vs. MLR NS NS NS NS NS NS NS NS NS
CFA vs. MsetCCA CFA NS NS NS NS NS NS NS CFA
CFA vs. CCA CFA CFA CFA CFA CFA NS NS NS CFA
MLR vs. MsetCCA NS NS NS NS NS NS NS NS MLR
MLR vs. CCA NS NS NS MLR MLR MLR MLR MLR MLR
MsetCCA vs. CCA NS NS NS NS NS NS NS MsetCCA MsetCCA
NS: There is not a significant difference
Table 3. F-score with different electrode montages and the number of channels
MLR CFA
MsetCCA Channel
Number
0.82
0.97
0.82 Oz-Pz, O1-P7
1
0.9
0.88 0.73
Oz-Pz, O1-P8 2
0.93
0.97
0.88 Oz-Pz, O2-P8
3
0.88
0.98
0.76 Oz-Pz, O2-P7
4
0.92
0.85 0.84
Oz-Pz, O1-Pz 5
0.89
0.85 0.79
Oz-Pz, O2-Pz 6
0.92
0.97
0.84 Oz-Pz, O1-Oz
7
0.84
0.92
0.81 Oz-Pz
8
0.69
0.65 0.35
O1-Pz 9
0.58
0.67
0.45 O2-Pz
10
0.86
0.84 0.77
O1, Oz 11
0.88
0.85 0.82
O2, Oz 12
0.78
0.81
0.4 O1, O2
13
0.86
0.88
0.78 Oz
14
0.66
0.76
0.55 O1
15
0.66
0.76
0.56 O2
16
0.93
0.98
0.88 Maximum
0.109953 0.102337
0.173847
SD
0.816875 0.850625
0.696875 Mean
In the training phase, MLR is the fastest algorithm and L1-MCCA is the most time-consuming algorithm. However, in applying the tuned algorithm to frequen -cy detection in the test set, CFA provided the fastest computations, while LASSO took the longest compu -tational time.
4. Discussion
In a practical SSVEP-based BCI system, it is important to use accurate frequency detection algorithms when a short-time window with only a few EEG channels are used for analysis. In this study, the state-of-the-art algo -rithms for SSVEP detection, including CCA, LASSO, L1-MCCA, MsetCCA, CFA, and MLR were compared on a benchmark database. The results demonstrated higher F-scores for MsetCCA, CFA and MLR meth -ods in comparison with CCA, LASOO, and L1-MCCA methods for entire time windows when 8 channels of EEG are used. These results are in accordance with the results reported by Wang et al. (2016), demonstrating a higher performance for MLR method in comparison with CFA, MCCA, and CCA methods. Zhang et al. (2014b) suggested that MsetCCA provided a higher ac -curacy in comparison with MCCA and CCA methods.
Here it is demonstrated that MsetCCA also outper -forms L1-MCCA. In another study, Zhang et al. (2015) showed that the CFA method provided higher accuracies than MCCA and CCA methods. Here it is demonstrated that CFA method also provides higher F-scores in com -parison with L1-MCCA.
Further analysis demonstrated that while MLR method outperforms the other two algorithms when several EEG channels are used for analysis, it is the CFA method that provides the highest F-scores when only 1 or 2 EEG channels are used. We also compared the performance of CCA with a set of monopolar signals such as Oz and Pz or bipolar (Oz-Pz) signal with that of the other meth -ods in Figure 2 (namely as CFA, MLR, MsetCCA). The results did not change and CFA and MLR methods still outperformed the other two algorithms for time windows shorter than 1 s.
The results presented in Table 3 can also be examined by another aspect. The 8th row in Table 3 represents the F-scores for Oz-Pz EEG channel, while in rows 1 to 7, the F-scores are provided when an additional bipolar channel was used. In most cases, the MLR method could effectively use additional information provided by the extra channels to improve the F-score of the system. In the CFA method, although the F-scores are higher, using an extra EEG channel does not have a consistently posi -tive effect on the F-scores and the same can be observed for MsetCCA method. This capability of the MLR tech -nique can also be observed when comparing the F-scores for Oz montage with Oz, O1 and Oz, O2 montages. Therefore, the MLR method could use information in multichannel EEG towards providing higher F-scores.
In practical applications of an SSVEP-based BCI sys -tem without the help of experts, the proper positioning of the electrodes is also a challenging issue. Therefore, another question is how much the algorithms should be Table 4. The average computational time (s) of various methods
Time
Window Method
1 Channel Methods
LASSO L1-MCCA CCA MsetCCA CFA MLR
1 s
Train Mean -- 1.1881 -- 0.0296 0.0338 0.0063
SD -- 0.46853 -- 0.00232 0.00036 0.00071
Test Mean 0.0082 0.0024 0.0045 0.0037 0.0018 0.0026
SD 0.00115 0.00068 0.00136 0.00073 0.00064 0.00049
4 s
Train Mean -- 1.5056 -- 0.0315 0.0363 0.0097
SD -- 0.44638 -- 0.00256 0.00036 0.00114
Test Mean 0.0104 0.0028 0.0048 0.0055 0.0019 0.0027
SD 0.00096 0.00041 0.00131 0.00050 0.00041 0.00040
robust to correct the position of electrodes. The results provided in Table 3 demonstrated that the performance of frequency detection algorithms is quite sensitive to the placement of Oz electrode. In fact, changing the posi -tion of this electrode to O1 or O2 considerably degrades the F-score of the system.
This result can be observed when Oz or Oz-Pz mon -tages were used. However, the results show that the CFA method was less sensitive to the placement of Oz electrode compared with other methods. The compari -son of F-score values between monopolar and bipolar montages in Table 3 indicates that Oz-Pz montage has better F-score value than other monopolar montages. This result is in accordance with the result reported by Diez et al. (2010).
The CFA algorithm also has the lowest computational time which is important for online implementation of a BCI system. Therefore, it is proposed that the CFA algorithm may be a proper choice in the development of practical SSVEP-based BCI systems. In the litera -ture, different methods were only compared with CCA and MCCA methods (Zhang et al., 2012;Zhang et al., 2014b; Zhang et al., 2013;Zhang et al., 2015). Our study suggests that newly-developed algorithms could also be compared with CFA due to its higher performance for short-time windows when few EEG channels are used.
The limitations of the study are the small dataset, a small number of participants, and the limited number of frequencies. Therefore it is suggested to test these methods on a larger dataset. Moreover, more detailed analysis of sensitivity on the electrode placement can be performed when a large number of electrodes are used.
Ethical Considerations
Compliance with ethical guidelines
There was no ethical considerations to be considered in this research.
Funding
This research did not receive any specific grant from funding agencies in the public, commercial, or not-for-profit sectors.
Authors' contributions
Conceptualization: Amin Mahnam; Methodology: Amin Mahnam, Hamid Reza Marateb; Investigation: All authors; Writing original draft: Mehrnoosh Neghabi;
Writing, review and editing: All authors; Resources: Amin Mahnam; and Supervision: Hamid Reza Marateb, Amin Mahnam.
Conflict of interest
The authors declared no conflict of interest.
References
Bossuyt, P. M., Reitsma, J. B., Bruns, D. E., Gatsonis, C. A., Glaszi-ou, P. P., Irwig, L., et al. (2015). STARD 2015: An updated list of essential items for reporting diagnostic accuracy studies.
BMJ: British Medical Journal, 351, h5527. [DOI:10.1136/bmj. h5527] [PMID] [PMCID]
Diez, P. F., Mut, V., Laciar, E., & Avila, E. (2010). A comparison of monopolar and bipolar EEG recordings for SSVEP detection. Paper presented at the 2010 Annual International Conference of the IEEE Engineering in Medicine and Biology, Buenos Aires, Argentina, 31 August-4 September 2010. [DOI:10.1109/ IEMBS.2010.5627451]
Ge, S., Wang, R., Leng, Y., Wang, H., Lin, P., & Iramina, K. (2017). A double-partial least-squares model for the detec-tion of steady-state visual evoked potentials. IEEE Journal of Biomedical and Health Informatics, 21(4), 897-903. [DOI:10.1109/ JBHI.2016.2546311]
Hardin, J. W., & Hilbe, J. M. (2007). Generalized estimating equa-tions: Wiley encyclopedia of clinical trials. Hoboken, New Jersey: John Wiley & Sons. [DOI:10.1002/9780471462422.eoct485]
Karimimehr, S., Marateb, H. R., Muceli, S., Mansourian, M., Ma-anas, M. A., & Farina, D. (2017). A real-time method for decoding the neural drive to muscles using single-channel intra-muscular EMG recordings. International Journal of Neural Systems, 27(6), 1750025. [DOI:10.1142/S0129065717500253] [PMID]
Lavrakas, P. (2008). Encyclopedia of Survey Research Meth-ods. Thousand Oaks, California: Sage Publications
[DOI:10.4135/9781412963947]
Lin, Z., Zhang, C., Wu, W., & Gao, X. (2007). Frequency recogni-tion based on canonical correlarecogni-tion analysis for SSVEP-based BCIs. IEEE Transactions on Biomedical Engineering, 54(6), 1172-6. [DOI:10.1109/TBME.2006.889197]
Liu, Q., Chen, K., Ai, Q., & Xie, S. Q. (2014). Review: Recent de-velopment of signal processing algorithms for SSVEP-based brain computer interfaces. Journal of Medical and Biological En-gineering, 34(4), 299-309. [DOI:10.5405/jmbe.1522]
Marateb, H. R., Mansourian, M., Adibi, P., & Farina, D. (2014). Manipulating measurement scales in medical statistical anal-ysis and data mining: A review of methodologies. Journal of Research in Medical Sciences, 19(1), 47-56. [PMID] [PMCID]
Nakanishi, M., Wang, Y., Wang, Y. T., & Jung, T. P. (2015). A comparison study of canonical correlation analysis based methods for detecting steady-state visual evoked poten-tials. PloS One, 10(10), e0140703. [DOI:10.1371/journal. pone.0140703] [PMID] [PMCID]
Qing, Y., Zheng, Z., Yue, L., Yuankui, Y., & Ge, S. (2015). Phase
space reconstruction for improvement of classification in few-chan -nel BCI systems. Paper presented at the 2015 12th International Computer Conference on Wavelet Active Media Technology and Information Processing (ICCWAMTIP), Chengdu, Chi-na, 18-20 December 2015.
Resalat, S. N., & Saba, V. (2016). A study of various feature ex-traction methods on a motor imagery based brain computer interface system. Basic and Clinical Neuroscience, 7(1), 13-20. Schittkowski, K. (1986). NLPQL: A FORTRAN subroutine
solv-ing constrained nonlinear programmsolv-ing problems. Annals of Operations Research, 5(2), 485-500. [DOI:10.1007/BF02739235]
Sokolova, M., & Lapalme, G. (2009). A systematic analysis
of performance measures for classification tasks.
Informa-tion Processing & Management, 45(4), 427-37. [DOI:10.1016/j. ipm.2009.03.002]
Tello, R. M. G., Müller, S. M. T., Bastos-Filho, T., & Ferreira, A. (2014). A comparison of techniques and technologies for SSVEP
classification. Paper presented at the 5th ISSNIP-IEEE
Biosig-nals and Biorobotics Conference (2014): BiosigBiosig-nals and Robot-ics for Better and Safer Living (BRC), Salvador, Brazil, 26-28 May 2014 [DOI:10.1109/BRC.2014.6880956]
Tibshirani, R. (2011). Regression shrinkage and selection via the lasso: a retrospective. Journal of the Royal Statistical Society: Series B (Statistical Methodology), 73(3), 273-82. [DOI:10.1111/ j.1467-9868.2011.00771.x]
Wang, H., Zhang, Y., Waytowich, N. R., Krusienski, D. J., Zhou, G., Jin, J., et al. (2016). Discriminative feature extraction via multivariate linear regression for SSVEP-based BCI. IEEE Transactions on Neural Systems and Rehabilitation Engineering, 24(5), 532-41. [DOI:10.1109/TNSRE.2016.2519350]
Wang, R., Leng, Y., Yang, Y., Wu, W., Iramina, K., & Ge, S. (2014). A partial least squares-based stimulus frequency recogni-tion model for steady-state visual evoked potentials detecrecogni-tion. Paper presented at the 2014 7th International Conference on Biomed-ical Engineering and Informatics, Dalian, China, 14-16 Octo-ber 2014. [DOI:10.1109/BMEI.2014.7002863]
Webb, A. R., & Copsey, K. D. (2011). Statistical pattern recogni-tion (3rd ed.). Hoboken, New Jersey: John Wiley & Sons.
[DOI:10.1002/9781119952954]
Wei, Q., Xiao, M., & Lu, Z. (2011). A Comparative study of canonical
correlation analysis and power spectral density analysis for SSVEP
detection. Paper presented at the 2011 3rd International Con-ference on Intelligent Human-Machine Systems and Cyber-netics, Zhejiang, China, 26-27 August 2011. [DOI:10.1109/ IHMSC.2011.72]
Zhang, Y., Jin, J., Qing, X., Wang, B., & Wang, X. (2012). LAS-SO based stimulus frequency recognition model for SSVEP BCIs. Biomedical Signal Processing and Control, 7(2), 104-11.
[DOI:10.1016/j.bspc.2011.02.002]
Zhang, Y., Xu, P., Cheng, K., & Yao, D. (2014a). Multivariate syn-chronization index for frequency recognition of SSVEP-based brain-computer interface. Journal of Neuroscience Methods, 221,
32-40. [DOI:10.1016/j.jneumeth.2013.07.018] [PMID]
Zhang, Y., Zhou, G., Jin, J., Wang, M., Wang, X., & Cichocki, A. (2013). L1-regularized multiway canonical correlation analy-sis for SSVEP-based BCI. IEEE Transactions on Neural Systems and Rehabilitation Engineering, 21(6), 887-96. [DOI:10.1109/ TNSRE.2013.2279680] [PMID]
Zhang, Y., Zhou, G., Jin, J., Wang, X., & Cichocki, A. (2014b). Fre-quency recognition in SSVEP-based BCI using multiset canonical correlation analysis. International Journal of Neural Systems, 24(4), 1450013. [DOI:10.1142/S0129065714500130] [PMID]
Zhang, Y., Zhou, G., Jin, J., Wang, X., & Cichocki, A. (2015). SSVEP recognition using common feature analysis in brain-computer interface. Journal of Neuroscience Methods, 244, 8-15.
[DOI:10.1016/j.jneumeth.2014.03.012]
Zhang, Y., Zhou, G., Jin, J., Zhang, Y., Wang, X., & Cichocki, A. (2017). Sparse Bayesian multiway canonical correlation analy-sis for EEG pattern recognition. Neurocomputing, 225, 103-10.
[DOI:10.1016/j.neucom.2016.11.008]
Zhang, Y., Zhou, G., Zhao, Q., Onishi, A., Jin, J., Wang, X., & Cichocki, A. (2011). Multiway canonical correlation analysis for