R E S E A R C H A R T I C L E
Open Access
Mathematical modeling of
tumor-associated macrophage interactions with
the cancer microenvironment
Grace Mahlbacher
1, Louis T. Curtis
1, John Lowengrub
2,3and Hermann B. Frieboes
4,5,6*Abstract
Background:Immuno-oncotherapy has emerged as a promising means to target cancer. In particular, therapeutic manipulation of tumor-associated macrophages holds promise due to their various and sometimes opposing roles in tumor progression. It is established that M1-type macrophages suppress tumor progression while M2-types support it. Recently, Tie2-expressing macrophages (TEM) have been identified as a distinct sub-population influencing tumor angiogenesis and vascular remodeling as well as monocyte differentiation.
Methods:This study develops a modeling framework to evaluate macrophage interactions with the tumor microenvironment, enabling assessment of how these interactions may affect tumor progression. M1, M2, and Tie2 expressing variants are integrated into a model of tumor growth representing a metastatic lesion in a highly vascularized organ, such as the liver. Behaviors simulated include M1 release of nitric oxide (NO), M2 release of growth-promoting factors, and TEM facilitation of angiogenesis via Angiopoietin-2 and promotion of monocyte differentiation into M2 via IL-10.
Results: The results show that M2 presence leads to larger tumor growth regardless of TEM effects, implying that immunotherapeutic strategies that lead to TEM ablation may fail to restrain growth when the M2 represents a sizeable population. As TEM pro-tumor effects are less pronounced and on a longer time scale than M1-driven tumor inhibition, a more nuanced approach to influence monocyte differentiation taking into account the tumor state (e.g., under chemotherapy) may be desirable.
Conclusions:The results highlight the dynamic interaction of macrophages within a growing tumor, and, further, establish the initial feasibility of a mathematical framework that could longer term help to optimize cancer immunotherapy.
Keywords: Cancer immunotherapy, Cancer metastasis, Tumor-associated macrophages, Tie2 expressing macrophages, Mathematical modeling, Computational simulation
Background
The role of tumor-associated macrophages (TAM) in tumor growth [1] and treatment response [2, 3] has been the subject of increased study. What has become clear is that populations of TAM are diverse in both phenotype and lineage [4, 5]. An increased presence of macro-phages at a tumor lesion site is generally correlated with
poor prognosis. The phenotypic range of TAM contrib-utes in various ways to the tumor progression [1], includ-ing tumor-promotinclud-ing and tumoricidal phenotypes which reflect the conflicting cues within the tumor environment.
The M1 extreme of the macrophage activation spectrum is commonly associated with inflammatory responses and tumoricidal activity driven by the expres-sion of inducible nitric oxide (NO) synthase and the re-lease of proinflammatory cytokines, which encourage tumor cell apoptosis [6, 7]. Its presence in the tumor microenvironment is correlated with reduced angiogen-esis required to supply the increased tumor metabolic * Correspondence:[email protected]
4
Department of Bioengineering, University of Louisville, Lutz Hall 419, Louisville, KY 40208, USA
5James Graham Brown Cancer Center, University of Louisville, Louisville, KY, USA
Full list of author information is available at the end of the article
needs, and thus reduced tumor growth and survival [5, 8]. The relative proportion of the M1 macrophages generally decreases with tumor progression. The M1 subtype is identified by surface receptors CD14++CD16−[6].
The M2 or alternatively activated macrophages en-compass a broader family of macrophages involved in tissue healing under normal conditions. Within the tumor microenvironment, they are recruited for tumor progression [1], and generally comprise a larger portion of the TAM in advanced tumors [1, 9]. Hypoxia-induced factors such as VEGF-A, endothelin-2, and interleukin-10 secreted in the tumor environment encourage differ-entiation towards the M2 phenotype [10]. Within the tumor microenvironment, M2 s secrete factors such as TGF-β1 which facilitates cancer cell proliferation [5, 11], VEGF-A which promotes angiogenesis and recruits add-itional macrophages, and MMP-9 which facilitates angiogenesis by degrading the extracellular matrix [1]. The proportion of M2 macrophages in the micro-environment tends to increase with tumor
progres-sion. The M2 subtype is identified by surface
receptors CD14dimCD16+ [5].
While the immune response may begin as primarily tumoricidal, with macrophages of the M1 or classic-ally activated type targeting tumor cells, cytokines se-creted by the tumor exploit the relatively fluid phenotype of the TAM to promote tumor growth and survival [8] via the M2 subtype. A third, more
re-cently discovered subtype called Tie2 expressing
macrophage (TEM) develops from a distinct precur-sor, and displays unique and non-redundant behaviors highly relevant to tumor-induced angiogenesis [12, 13] and post-ischemic recovery [14]. TEMs can be identified by the expression of Tie2 on their surface which is also found on the endothelial cells of blood vessels, where they are integral to angiogenic pathways and develop-ment [6, 15]. Tie2 is a transmembrane tyrosine-protein
kinase receptor regulating angiogenesis, including
endothelial cell survival, migration, and proliferation. Recent research indicates that TEMs are recruited to the tumor microenvironment at an early phase of devel-opment. There, they are believed to play a pivotal role in tumor neovascular development by activating
the “angiogenic switch” – a transition that occurs
when a tumor begins to recruit nearby vasculature to supply its increased metabolic demands [16]. The critical role of TEMs in tumor angiogenesis and vascular remodeling [12, 13, 17] was shown by increased TEM infiltration following administration of anti-angiogenic agents [18] as well as the blocking of the angiogenic factor angiopoietin-2 (Ang2), a Tie2 ligand associated with activated endothelial cells, leading to tumor vasculature regression and arrested tumor progression [19].
The chief contribution of TEMs to tumor progression appears to be facilitation of angiogenesis through
struc-tural and paracrine support. The macrophage’s titular
receptor, Tie2, binds the growth factors angiopoietin 1 and 2. In addition to having a direct chemotactic effect on the TEMs [20] interactions with angiopoietins lead to the upregulation of several factors necessary to angio-genic processes, including MMP-9, CTSB, and IL-10, not dissimilar to the role of the M2 subtype [20, 21]. However, TEMs have a more multifaceted involvement in angiogenesis [12]. As well as upregulating these fac-tors in TEMs, Ang2 acts as a chemoattractant, causing the TEMs to congregate along the abluminal side of ves-sels [22]. Here, TEMs are thought to directly facilitate vessel sprouting by providing both a structural scaffold and paracrine support for endothelial sprouts, aiding in their growth [23], and preventing collapse due to the high hydrostatic pressure associated with the tumor microenvironment [15]. As a tumor grows and its meta-bolic needs increase, TEMs continue to fill a supportive role in the growth and maturation of the neovasculature that supplies it with nutrients and oxygen [15]. In a 2008 study by De Palma et al. comparing a tumor model with an intact and TEM-knockout population of tumor associated macrophages, the tumors with an intact population showed a four-fold increase in vascular development in comparison to the TEM-ablated popula-tion [12].
In addition to their more direct roles in facilitating neovascular development, TEMs also contribute to the cocktail of other tumor-friendly cytokines in the micro-environment. IL-10 is an immune cytokine secreted from most leukocytes, including macrophages, as well as from tumor cells themselves [24]. It has pleiotropic ef-fects in the tumor microenvironment, being implicated in both suppression of tumorigenic cytokines such as IL-6 [25], and in enhanced immune escape, poor prognosis, and advanced cancer stage [25]. While IL-10 is known to be upregulated in several cancer types, including breast cancer [25], a consensus has yet to be reached on whether it is a definitive indicator of tumor progression and patient prognosis, as some studies have suggested that its overexpression leads to subsequent immune rejection of the tumor [26]. IL-10 also plays a role in in-ducing infiltrating monocytes to adopt the tumorigenic M2 phenotype [5]. Tie2-expressing macrophages are known to secrete IL-10, and thus may contribute to the increased ratio of M2 to M1 macrophages in the tumor microenvironment.
[11] has evaluated the uptake of nanoparticles by macro-phages in the tumor microenvironment to gain insight into implications for cancer treatment and drug delivery. In this study, we develop a mathematical framework to systematically evaluate the role of TEMs in relation to M1 and M2 macrophage phenotypes on the growth of vascularized tumor lesions. The TEMs are simulated to differentiate from vascular-extravasated monocyte pre-cursors, congregate around the abluminal side of the vasculature in response to a chemoattractant gradient, secrete cytokines which favor differentiation of a separ-ate angiogenic macrophage subtype [27], and signifi-cantly upregulate angiogenic activity and survival of neovasculature.
Methods
Previous mathematical modeling work has explored critical aspects of TAM activity. Owen and Sherratt [28, 29] pre-sented a model in which macrophages entered the tumor environment to selectively target tumor cells. Later models were developed to simulate macrophages primed to destroy cancer cells on contact [30] or by drug delivery [31]. In [32] it was shown that effective macrophage targeting of hypoxic tumor cells would benefit from non-cell-cycle dependent drugs or limited-diffusivity. In [33] it was found that the combination of conventional and macrophage-based therap-ies using magnetic nanoparticles could be synergistic. In [34] the role of tumor macrophage hypoxia inducible factors (HIFs) in chemotherapy effectiveness was evaluated. Re-cently, a model exploring the efficacy of nanoparticle albumin-bound-paclitaxel (nab-PTX) using macrophages as a delivery vehicle to target hypovascularized cancer lesions was developed [11].
The computational model in this study builds upon this recent work simulating generic TAM activity in the tumor microenvironment [11], in which a breast cancer
lesion metastasized to the liver was simulated – under
conditions that are known to favor the recruitment of TAM [35]. In [11], macrophages were utilized as a drug vector, and their performance was evaluated experimen-tally and via computational simulation. In [36], this sys-tem was expanded to include M1 and M2 macrophage variants in order to gauge their shifting role in the tumor response to the drug therapy. Here, we do not assume that drug is vectored by macrophages, and focus solely on the effects of the various macrophage popula-tion subtypes on the tumor lesion progression.
Briefly, the model is composed of a tumor lesion in a 2D grid of preexisting vasculature as previously de-scribed in [11, 36–39]. A spatial component is included in order to model the movement of macrophages as well as the transport of cytokines, and other substances in the tumor microenvironment. We define macrophage subtypes derived from bone marrow precursors, namely,
the M1 and M2 subtypes, and add the TEM subtype as a third population that promotes angiogenesis for tumors lesions. Given that the monocytes are not biologically active in the model, the simplifying assumption is made that Tie2 expressing macrophages differentiate in the tumor microenvironment from the same type of mono-cyte precursor as the M1 and M2 macrophages. The effects of the TEM phenotype on the environment are modeled with the following characteristics:
Increasing differentiation of Tie2-expressing macro-phages from a monocyte precursor with tumor progression
Semi-stochastic movement of TEMs along a chemoattractant gradient (Ang2) secreted by the peritumoral vasculature, as well as a macrophage attractant from the hypoxic regions of the tumor.
The representative protein released by the TEMs is modeled after IL-10 to examine the effects of cytokine release in the context of
immunomodulatory activity.
Increased M2 differentiation in response to TEM-eluted IL-10 in the system
Increased angiogenesis and resilience of tumoral neovasculature due to local TEM presence
Tumor growth
The tumor growth model is based on Macklin et al. [37] and builds upon recent work [11, 36, 38, 39]. Simulation of tumor growth begins with a small lesion in a 2D grid
of blood vessels representing a regularly-spaced
(250μm) capillary grid. The tumor progression is
mod-eled in discrete time increments, enabling evaluation, updating, and recording of the tumor conditions. Advec-tion of the tumor and advancement of its boundary are subject to changes in the microenvironment such as fluid pressure, diffusion of hypoxic proteins and other angiogenic factors, and concentration of oxygen, glucose and other vital nutrients (here, simplified as oxygen only). Altogether, the tumor microenvironment may be described in four regions based on oxygen and prolifera-tion levels. These are:
Necrotic region,ΩN, in which oxygen levels are
insufficient for viability.
Hypoxic region,ΩH,in which oxygen levels are
sufficient for viability but not proliferation.
Proliferating region,ΩP, in which oxygen levels are
sufficient for proliferation.
Normal (non-tumoral) tissue.
Tumor boundary advancement with velocity vc
vc¼−μ∇PþχE∇E ð1Þ
where μ is tissue mobility, encompassing the roles of cell-cell and cell-matrix adhesion, P is the oncotic pressure, χE is haptotaxis, and E is the density of the
extracellular matrix. Via a simplifying assumption of uniform density E in the proliferating tumor region, the relationship between velocity change and tumor growth is [37]:
∇vc¼λp ð2Þ
whereλpis the non-dimensionalized net tumor
prolifer-ation rate (described below).
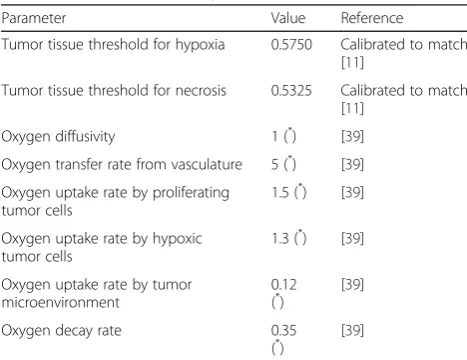
As oxygen falls below a threshold for proliferation regions distal from vasculature, hypoxic tissue regions develop and release tumor angiogenic factors (TAF). The TAF diffuse outward through the tumor and into the surroundings, where they trigger endothelial cell sprouts in the peritumoral vascular grid as well as vascu-lar extravasation of macrophages, analogous to the ac-tion of VEGF on macrophage recruitment to the tumor [40]. If oxygen falls below a vital threshold, necrotic tissue develops within the tumor. The tumor model main parameters are listed in Table 1.
Angiogenesis and vascular development
The angiogenesis model, adapted from [37, 39, 41], de-scribes the development and maturation of a tumor-induced neovascular network, blood flow through the network and the mechanical and chemical effects of tumor proliferation on the growth, maturation, flow, flux, and collapse of the surrounding vasculature. The vasculature is simplified to a grid, from which irregular new vessels sprout and grow in response to gradients of factors and pressures produced by the tumor tissue. We
simulate a highly vascularized organ microenvironment, e.g., as is the case for the lung or the liver, providing an environment conducive to metastases formation.
As the tumor grows within the vascularized micro-environment, cancer cells may experience heterogeneous access to oxygen, glucose, and growth factors, which may depend on distance from the nearest vascular source as well as interstitial and oncotic pressures. Each vessel sprout grows semi-stochastically, with the prob-ability of growing in one of four directions weighted by the presence of the TAF gradient produced by the hyp-oxic tissue. The sensitivity of the vascular growth is increased in response to contact with factors secreted by the TEMs. The magnitude of this response was cali-brated to correlate with the four-fold increase in vascula-ture surface area found to result from TEM-eluted factors by De Palma et al. [12].
The change ΔR in radii R of the vessels is modeled
according to pressures imposed by the movement of fluid within them [37, 41–43],
ΔR¼ SwssþSpþSm−Ss
R ð3Þ
where Swss is the local wall shear stress stimulus, Sp is
the intravascular pressure stimulus,Smis the flow
carry-ing hematocrit stimulus, and Ss is the natural shrinking
tendency of the vessel as a result of the properties of the basal lamina. This natural shrinking tendency is a constant value ks [44] unless the pressure PC exerted
upon the vessel reaches a critical pressure PCT, at which
point the shrinking tendency increases proportionally to the pressure with a rate kPCto simulate complete vessel
collapse, which may partially recover if the stress is relieved [39]:
Ss¼ks if PC≤PCT ð4Þ
SS¼kSþkpcðPc−PCTÞ if PC >PCT ð5Þ
In our model, the effect of TEM proximity at a given location is incorporated to provide a protective effect on the neovasculature. Specifically, if a TEM is at an adjacent matrix location to a blood vessel, then the
shrinking tendency of the vessel Ss iis drastically
reduced. Let 1TEM = 1 denote TEM presence and let
1TEM = 0 otherwise. The change in vessel radius is
then [37]:
ΔR¼ SwssþSpþSm−Ssð1−1TEMÞ
RΔt ð6Þ
Oxygen transport
Oxygen σ is simulated to diffuse with a coefficient Dσ
from the location of the vasculature, and is supplied at ratesλσneoand λσpre from the neo- and pre-existing vascu-lature, respectively. The oxygen is taken up by normal
Table 1Tumor model main parameters and associated values
Parameter Value Reference
Tumor tissue threshold for hypoxia 0.5750 Calibrated to match [11]
Tumor tissue threshold for necrosis 0.5325 Calibrated to match [11]
Oxygen diffusivity 1 (*) [39]
Oxygen transfer rate from vasculature 5 (*) [39]
Oxygen uptake rate by proliferating tumor cells
1.5 (*) [39]
Oxygen uptake rate by hypoxic tumor cells
1.3 (*) [39]
Oxygen uptake rate by tumor microenvironment
0.12
(*) [39]
Oxygen decay rate 0.35
(*)
[39]
(*
cells with a rate λσtissue and by tumor cells with a rate
λσ
tumor in the proliferating region and qσ in the hypoxic
region, and decays with rate λσV in the necrotic region. The formulation is [37]:
0¼∇ðDσ∇σÞ−λσð Þσ σ
þλσevðx;t;1vessel;p;σ;hÞ ð7Þ
λσ¼
λtissue 8 > < > :
σ outside Ω λtumorσ in ΩP
qσð Þσ in ΩH λNσ in ΩN
ð8Þ
wherex is position in space,tis time,1vesselis the
char-acteristic function for the vasculature (equals 1 at vessel locations and 0 otherwise), p is the tumor (solid) pres-sure, andhis the hematocrit in the vascular network re-lated to oxygen extravasation (following [37]). The extravasation is modulated by the extravascular intersti-tial pressure pi scaled by the effective pressure pe, with kPi being the weight of the convective transport
compo-nent of small molecules [45]:
λσ ev¼λ
σ
ev1vesselð Þx;t
h HD
−hmin
þ
1−kPi
pi Pe
ð1−σÞ ð9Þ
where λσev is the constant transfer rate from both pre-existing and tumor-induced vessels. Constants HD
and hmin respectively represent normal and minimum blood hematocrit required for oxygen extravasation. The oxygen values are normalized with respect to the vascu-lature, and hence range from 0 to 1.
Macrophages
Following [11, 36], monocytes are simulated to extravasate from the vasculature in proportion to the local concentra-tion of macrophage chemoattractants (e.g., pro-angiogenic factors produced by hypoxic tumor tissue), and to prefer-entially migrate towards tissue regions (e.g., hypoxic tissue) along the increasing gradient of these chemoattrac-tants. Monocytes undergo polarization into M1 or M2 subtypes in the vicinity of the tumor microenvironment based on the concentration of cytokines released by prolif-erating and hypoxic tumor cells (see Table 3 below). Monocytes and macrophages are simulated as discrete en-tities using a cellular automaton algorithm.
Since the number of cancer cells is a function of
tumor size, one can estimate that a 1mm3 tumor
lesion may contain up to 3 × 10⁶ cells [46], with about 10% of these cells being macrophages. As in [11], we conservatively assume that the number of macrophages recruited to the lesion is ~25% of that observed in vivo (2.78 × 10⁴ macrophages/mm3).
M1 macrophages were simulated to penetrate deeper than the M2 subtypes into the tumor lesion to replicate this effect observed in experiments [36]. This was mod-eled as a concentric field of value 1 at the tumor center and value 0 at the tumor boundary, selectively biasing the M1 movement based on distance to the center of the lesion.
Effects on tumor growth
The effects of macrophage variants M1 and M2 are quantified by their secretion of nitric oxide and tumor growth factors, respectively. This is simulated by the M2 subtype favoring tumor growth by lowering the thresh-old for tissue to become hypoxic while the M1 subtype counters this effect by secreting NO, which results in tumor tissue death. Their effectsλM1andλM2are incor-porated into the proliferation term as follows:
λp¼
non tumoral: ΩP ΩH ΩN 8 > > < > > : 0 λMþλM2
ð Þσ−ðλAþλM1Þ
λM2σ−ðλAþλM1Þ −GN
ð10Þ
whereλMis the tumor native mitosis rate, σis the local
oxygen concentration calculated via Eq. 3 and λA is the
apoptosis rate due to natural tumor cell death. The non-dimensionalized rate of cell degradation in the necrotic region isGN, which assumes that cellular necrotic debris
is constantly degraded and the associated fluid is re-moved. The M1 cytotoxicity is modeled to affect both proliferating (cycling) and hypoxic (quiescent) tissue, since the death mechanism is assumed to be cell-cycle independent.
The cytotoxic effect λM1 of the M1 subtype is
simu-lated to affect tissue proportional to the release rateλNO
of nitric oxide in the immediate vicinity of the macro-phage (1M1), since nitric oxide has a short half-life in vivo with limited diffusion distance.
λM1¼λNO1M1 ð11Þ
In addition to inhibiting tumor death, the presence of the M2 growth factor has a positive effect on the prolif-erating region as follows:
dλM2
dt ¼λFFð1−ðλMþλM2ÞÞ ð12Þ
whereλM2is the proliferation rate due to the
concentra-tion Fof the diffusible M2 growth factor, which adds to the native proliferation rate λM, and λF is the effect of
the M2 growth factor on the proliferation. The prolifera-tion effect due to λM2decreases as the net proliferation
macrophages can also stimulate the quiescent (hypoxic) tumor cells to proliferate, albeit at lower rates than well perfused tissue (see below).The tumor growth factor concentration F secreted by the M2 macrophages achieves a transient local lowering of the viable oxygen threshold – the oxygen level below which tumor cells die–as follows:
dQOL
dt ¼λOLð1−FÞ QOL−QOL;current
−λOT
F QOL;current−QOL;min
ð13Þ
where QOL is the effective quiescence oxygen level,λOL
is the recovery rate of QOL to the standard quiescence
oxygen level QOL, QOL, current is the current quiescence
oxygen level,F is the local concentration of M2 growth factor (ranges from 0 to 1, dimensionless units), λOT is
the M2 growth factor effect rate on the lowering of the viable oxygen threshold, andQOL minis the lower bound
of the quiescence oxygen level. The effective oxygen level is set toQOL if it exceedsQOL, and toQOL minif it
is less thanQOL min.
Differentiation
Given the increased ratio of M2/M1 macrophages typ-ical of tumor lesions, the role of TEM-produced IL-10 on the ratio of M2/M1 macrophage subtypes is modeled. A target range of 0.32–5.23 for this ratio was used, to match in vitro data for metastatic tumors in the liver [47].
As monocyte precursorsMϕextravasate from the
vas-culature in the tumor region, they come into contact with cytokines diffusing from the tumor interior and the vasculature that influence their differentiation. The concentration of factors, analogous to interleukins and others that encourage differentiation of given subtypes,
influences the respective differentiation rate Ri
dependent on the size of the interval that a randomly generated number may fall into. Thus, the differentiation probabilities depend on the concentration of factors:
RM1∝kM1CM1f
RM2∝kM2 CM2f þkT2M2CIL−10
RTEM∝ kT2CT2f þkAng2CAng2
ð14Þ
where kM1, kM2, kT2 are intensity coefficients tuned to
reflect the relative prevalence of M1 or M2 differentiat-ing monocytes and Tie2 expressdifferentiat-ing macrophages infil-trating the tumor,CM1f,CM2f,CIL−10,CT2fandCAng2are
local concentrations of cytokines and other factors favor-able to M1, M2, or TEM differentiation released by the viable (proliferating or hypoxic) tumor regions, andkAng2
and kT2M2are intensity coefficients to tune the effect of
Ang2 and Il-10 favoring M2 differentiation, respectively.
Cytokine production and diffusion
Assuming steady-state conditions, the overall mass
balance for a particular cytokine concentration C
(dimensionless units) produced by the viable (proliferating and hypoxic) tumor regions is [48]:
0¼∇ðDC∇CÞ
þλC
productionð1−CÞ1Ω−λ C
circulation1vessel−λ C decayC
ð15Þ
where DC is diffusivity and λ
C
production, λ C
circulation, and λC
decay are the (constant) non-dimensional rates of
cytokine production, wash-out via circulation, and decay, respectively. The values for concentration range from 0 to 1.
For all the diffusion equations, as well as the pressure and angiogenic factors, zero Neumann conditions are taken at the boundaries [37].
Movement
Monocytes and M1 and M2 macrophages migrate through the interstitium guided by gradients of oxygen, pressure, and chemoattractants. Movement in one of four directions along the computational grid is deter-mined semi-stochastically, similar to their differentiation described earlier. The probability of movement in the x + 1 direction is as follows:
Pxþ1¼ðMOΔOxþ1þMPΔPxþ1þMCΔChemoxþ1Þ
ð16Þ
where MO, MP and MC are intensity coefficients for the
influence of oxygen concentration, pressure, and chemo-attractant on macrophage movement, andΔOx+ 1,ΔPx+ 1andΔChemox+ 1 are the difference in concentration of
the factor of interest from the current point to the direc-tion in quesdirec-tion. The same calculadirec-tions are made for the remaining three directions in the 2D Cartesian grid. Each probability is divided by the total sum of the four probabilities, and intervals are then defined proportional to the respective magnitude of these scaled probabilities. A random number ranging from 0 to 1 is generated, and movement in a specific direction is determined based on which interval the number falls into. If no interval quali-fies, the macrophage remains in place. Although a macrophage is allowed to share the same location on the grid as a vessel, only one monocyte or macrophage can occupy a grid location.
The method of movement for the TEM is also semi-stochastic, but relies upon a different chemoattractant, namely Ang2 gradients secreted by the neovasculature. The probability is modeled as follows:
where MAng2 is the intensity coefficient tuned to scale
the response of TEMs to the angiopoetin2 concentration gradient in each direction.
Parameter calibration
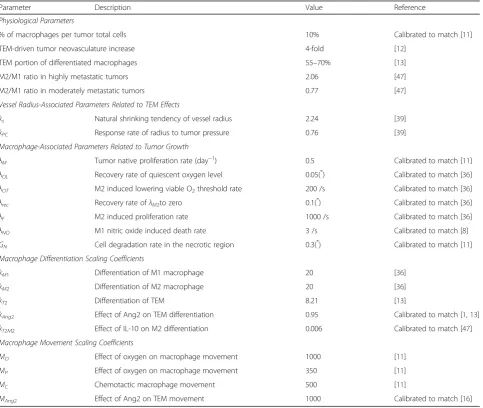
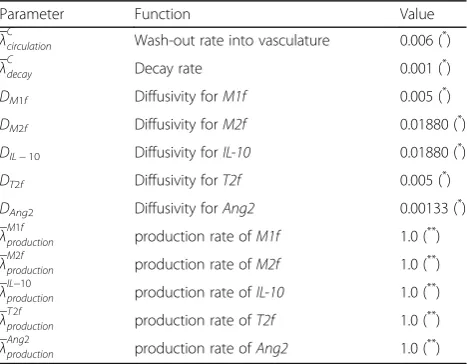
The values of macrophage-associated parameters are de-fined in Table 2. These parameters were set to values in the literature or calibrated so that the simulated tumor growth would match experimentally measured values in the literature. The cytokine characteristics are summa-rized in Table 3, based on prior work that classified protein diffusivity based on molecular weight [48]. The wash-out rate into the vasculature, decay rate, diffusivity, and production rate are shown for each cytokine in Table 4. The concentration of IL-10 in pg/mL is calculated by treating each pixel in the spatial model as a 3-dimensional voxel. Thus, the final concentrations for
IL-10 in simulations with the TEM subtype present are
within previously observed values of 5.6–37 pg/mL for
breast cancers of various TNM stages [49].
Numerical implementation
Details of the numerical implementation are described in [39] and references therein. Briefly, to solve for the tumor oncotic pressure and the diffusible elements (oxygen, growth factors, cytokines, as well as tumor angiogenic fac-tors and matrix-degrading enzymes included in the angio-genesis model), the corresponding equations are discretized in space using centered finite difference approximations and the backward Euler time-stepping algorithm. The dis-cretized equations are solved using a nonlinear adaptive
Gauss–Seidel iterative method [50, 51]. A ghost cell
method is used to implement the tumor pressure jump condition at the tumor-host interface [51]. This system of
Table 2Description of macrophage-associated parameters
Parameter Description Value Reference
Physiological Parameters
% of macrophages per tumor total cells 10% Calibrated to match [11]
TEM-driven tumor neovasculature increase 4-fold [12]
TEM portion of differentiated macrophages 55–70% [13]
M2/M1 ratio in highly metastatic tumors 2.06 [47]
M2/M1 ratio in moderately metastatic tumors 0.77 [47]
Vessel Radius-Associated Parameters Related to TEM Effects
ks Natural shrinking tendency of vessel radius 2.24 [39]
kPC Response rate of radius to tumor pressure 0.76 [39]
Macrophage-Associated Parameters Related to Tumor Growth
λM Tumor native proliferation rate (day−
1
) 0.5 Calibrated to match [11]
λOL Recovery rate of quiescent oxygen level 0.05(
*
) Calibrated to match [36] λOT M2 induced lowering viable O2threshold rate 200 /s Calibrated to match [36]
λrec Recovery rate ofλM2to zero 0.1(
*
) Calibrated to match [36]
λF M2 induced proliferation rate 1000 /s Calibrated to match [36]
λNO M1 nitric oxide induced death rate 3 /s Calibrated to match [8]
GN Cell degradation rate in the necrotic region 0.3(
*
) Calibrated to match [11]
Macrophage Differentiation Scaling Coefficients
kM1 Differentiation of M1 macrophage 20 [36]
kM2 Differentiation of M2 macrophage 20 [36]
kT2 Differentiation of TEM 8.21 [13]
kAng2 Effect of Ang2 on TEM differentiation 0.95 Calibrated to match [1,13]
kT2M2 Effect of IL-10 on M2 differentiation 0.006 Calibrated to match [47]
Macrophage Movement Scaling Coefficients
MO Effect of oxygen on macrophage movement 1000 [11]
MP Effect of oxygen on macrophage movement 350 [11]
MC Chemotactic macrophage movement 500 [11]
MAng2 Effect of Ang2 on TEM movement 1000 Calibrated to match [16]
equations is iteratively solved together for the tumor oncotic pressure and the concentration of diffusible ele-ments (as well as interstitial fluid pressure and blood ves-sel pressure in the angiogenesis component [39]) to steady state at each timestep, i.e., the equations are discretized implicitly in time. The level set method is used to update the tumor viable/necrotic region and the interfaces be-tween the tumor–host and tumor viable–necrotic tissue regions. In the angiogenesis component, the vessel radii are discretized explicitly, and the hematocrit level is calcu-lated every few iterations. This hematocrit is moducalcu-lated by the blood flow and influences the extravasation of oxy-gen from the vasculature. Further details regarding the numerical implementation are in [37] and references therein.
Results
Combinations of macrophage phenotypes
The tumor, vascular, and macrophage parameters were first calibrated as described in Methods. The single and combined effects of the three macrophage types on
tumor growth were then evaluated in various cases, as follows:
Case 1 Case 2 Case 3 Case 4 Case 5 Case 6 Case 7 Case 8
M1 M1 M1 M1 (None)
M2 M2 M2 M2
TEM TEM TEM TEM
A case to match in vivo macrophage ratios [13] was first run, with all three macrophage subtypes present (Case 1). The other cases then examined the tumoral response to the other possible population combinations. Each case was observed over a simulated 13-day time-span, and the results were compared with existing experimental data. The number of monocyte precursors infiltrating the tumor microenvironment changed dy-namically in time based on the density of the vasculature and the concentration of tumor angiogenic factors (e.g., VEGF) released by the hypoxic tumor tissue. In order to maintain consistent differentiation probabil-ities for all the cases, monocytes differentiating into a subtype absent in a particular scenario were rendered to have no effect. In this manner, the pool of mono-cyte precursors available to differentiate into the ef-fective subtypes remained consistent across the cases by making it dependent only on the changing tumor conditions (size, vascularization, hypoxic tissue, etc.).
Tumor growth influenced by macrophage phenotypes
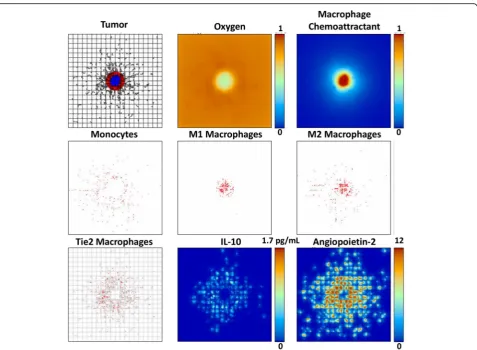
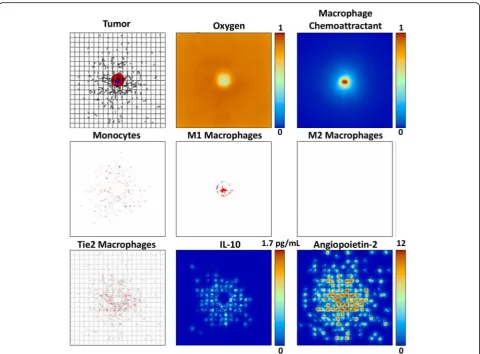
The tumor growth along with the associated vascular development, oxygen, macrophage infiltration, and key secreted factors, at 13 days post inception for Case 1 are shown in Fig. 1. By this time the tumor has developed a proliferating region, mostly on the periphery, surrounding a hypoxic interior. The extravasation of monocytes and subsequent macrophage differentiation into M1, M2, or TEM phenotypes is triggered by the release of macrophage chemoattractants (e.g., TAF) from the tumor hypoxic tissue, as well as by the concentration of Ang2 secreted by the neovasculature, favoring monocyte differentiation into TEM (Eq. 14). The monocyte infiltration began when the
lesion reached 200 μm in diameter (7.35 days post
Table 3Characteristics of the macrophage-associated cytokines used in this study. The M1f characteristics were chosen to be similar to IL-6, while the M2f characteristics were chosen similar to IL-10
Cytokine Function Source MW (Da) Diffusivity (as fraction of TAF diffusivity)
M1f M1 differentiation Proliferating & hypoxic tumor cells 21,000 1
M2f M2 differentiation Proliferating & hypoxic tumor cells 18,606 3.7606
IL-10 TEM-eluted factor TEM 18,606 3.7606
T2f TEM differentiation Proliferating & hypoxic tumor cells 60,179 1
Ang2 TEM chemoattractant Neovasculature ~70,000 0.26591
Table 4Macrophage-associated cytokine parameters based on proteomic analysis in Frieboes et al. [48]
Parameter Function Value
λCcirculation Wash-out rate into vasculature 0.006 ( *
) λCdecay Decay rate 0.001 (
* )
DM1f Diffusivity forM1f 0.005 (*)
DM2f Diffusivity forM2f 0.01880 (*)
DIL−10 Diffusivity forIL-10 0.01880 (*)
DT2f Diffusivity forT2f 0.005 (*)
DAng2 Diffusivity forAng2 0.00133 (*)
λMproduction1f production rate ofM1f 1.0 ( **)
λMproduction2f production rate ofM2f 1.0 ( **)
λIL−production10 production rate ofIL-10 1.0 ( **)
λTproduction2f production rate ofT2f 1.0 ( **)
λAngproduction2 production rate ofAng2 1.0 ( **)
The same wash-out and decay rates apply to all cytokines, generically denoted byC. (*
) Value is non-dimensionalized by the diffusivity of oxygen [68] (1 × 10
−5 cm2
s−1 ). (**
inception), at the onset of hypoxia. The M1 subtypes are mostly concentrated within the tumor lesion, while the M2 subtypes are more spread in the immediate periphery as a consequence of the monocyte contact with the TEM-eluted factor. Following the gradient of Ang2, the TEMs preferen-tially cluster around angiogenic vessels, where they hinder vessel shrinking and collapse due to increased pressure of the growing tumor, as expressed in Eqs. 4–6. This vessel re-lief enables the tumor to have increased access to oxygen and nutrients. Meanwhile, the TEM secretion of IL-10 favors monocyte differentiation into the M2 subtype, as described by Eq. 14.
The tumor and associated macrophage parameters on day 13 when the M1 subtype is removed from the system (Case 4), leaving only the possibility of M2 or TEM phenotypes, are shown in Fig. 2. Unhindered by
the M1 cytotoxic effect, in this case the tumor is able to grow larger than the case when all subtypes are present (Fig. 1). In contrast to this situation, Fig. 3 illustrates a substantially smaller tumor when the M2 subtype is removed and only the M1 and TEM subtypes are present (Case 2). This case is not as favorable for tumor growth as might be expected, as the TEM pro-tumor effects are less pronounced and on a longer time scale than the M1 cytotoxicity. This is confirmed when both M1 and M2 phenotypes are removed and only the TEM are present (Case 7), as shown in Fig. 4.
Ratio of macrophage phenotypes
As the tumor grows in time, the number of macrophages changes dynamically based on the concentration of the
Fig. 1Tumor growth by 13 days with TEM and M1 and M2 macrophage subtypes present. Top left: Tumor with proliferating regions in red and
relevant cytokines, which, depending on the cytokine, is coupled in the model between the macrophages, the tumor and the vasculature, as described in the Methods. The proportion of different macrophage types during the tumor growth is shown in Fig. 5. When present, Tie2 expressing macrophages differentiating from the monocyte precursors became in all cases the majority subset in the tumor environment (77% for M1/TEM, 78% for M2/TEM, and 56% for M1/M2/TEM), matching in vivo data [13]. Without TEM, the M1:M2 ratio stabilized at 1.2:1.0. This ratio is half the median ratio for highly metastatic tumors, and within the normal range for more benign tumor populations [47]. The secretion of IL-10 when TEM were present shifted the M1:M2 ratio as high as 1.0:2.2 - a ratio more consistent with highly metastatic tumors [47].
Vascular development influenced by macrophage phenotypes
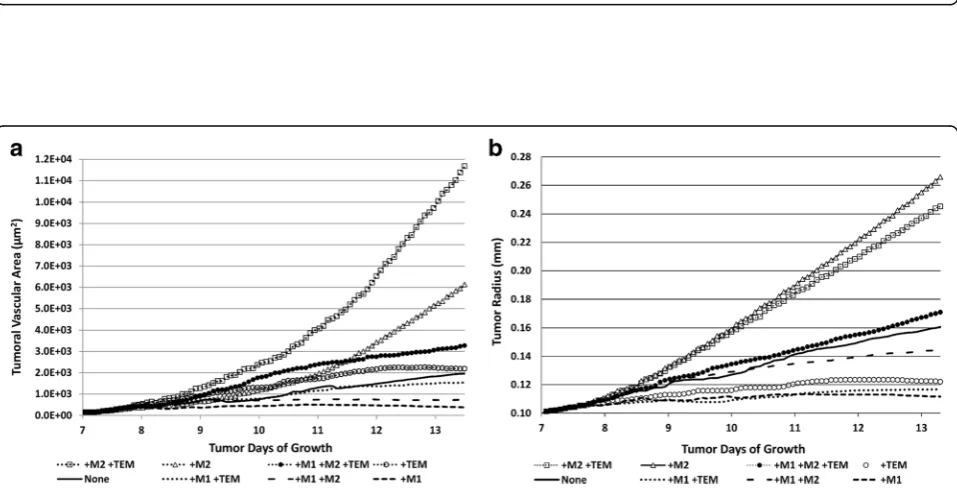
Due to the protective clustering around angiogenic vasculature, cases with the TEM subtype had notably
greater vascular development compared to the TEM-absent cases (Fig. 6a), with two exceptions. The M1/ TEM model elicited less vascular development than that of the macrophage-absent scenario, due to the M1 tumoricidal effect curtailing the tumor growth, while the M2-only case achieved the largest intratu-moral vascularity other than the M2/TEM, which is due to the promotion of tumor growth by the M2 subtype. Comparing the case of M1/M2/TEM to M1/ M2, in which TEM is respectively present and ab-lated, a 4.6-fold increase in tumoral vasculature is ob-served by day 13. This is greater than the four-fold increase found by De Palma et al. in an analogous study in vivo [12]. However, this may be expected as the macrophages in the simulation continue to enter the environment, replenishing the macrophages that die, whereas the in vivo study used a single bolus dose which was not replaced in the TEM-absent mice. For comparison, the M2/TEM case had 1.9-fold more vasculature than the M2-only, while the M1/TEM
Fig. 2Tumor growth by 13 days with both TEM and M2 macrophage subtypes present (same description of panels as in Fig. 1). The M2 macrophages
case had 4.9-fold more vasculature than the M1-only scenario.
Analysis of tumor growth over time
The TEM subtype protective effect on angiogenic vessels and promotion of M2 differentiation in concert had a noticeable effect on the tumor progression (Fig. 6b). While all cases achieved a size that at least transiently rendered the interior portions hypoxic, only those with the TEM or M2 subtypes were able to achieve continued growth through the end of the simulation. The case with all three subtypes yielded 18% increase in tumor radius over the TEM-ablated model by day 13 of the simula-tion. The M2 scenario exhibited the largest growth, des-pite the development of hypoxic and necrotic regions within the tumor lesion. All TEM-ablated cases without M2 showed a plateau in growth around Day 11. The presence of the M2 enabled the tumor to overcome the absence of the TEM and mitigate the tumoricidal effect of the M1, as shown by the case with M2-only eliciting
the second-highest overall growth and the case of M1/ M2 showing continued growth, respectively. The case with M1-only showed a more dramatic plateauing of growth, consistent with findings of M1-only in vivo [8].
The extent of vascularization and the tumor growth by day 13 are summarized in Fig. 7. While the M2/TEM case had twice the vascular area of the M2-only case, the latter exhibited the largest growth. This indicates that the M2 growth-promoting effect is more potent due to a tumor pro-liferative response that is more rapid than the vasculature-stabilizing effect of the TEM. This is supported by the obser-vation that the tumor growth with M1/M2 was 24% larger than the M1/TEM case, even though the vascular develop-ment with M1/M2 was only 47% that of the M1/TEM case.
Tumor growth dependent on macrophage-influenced vascularization
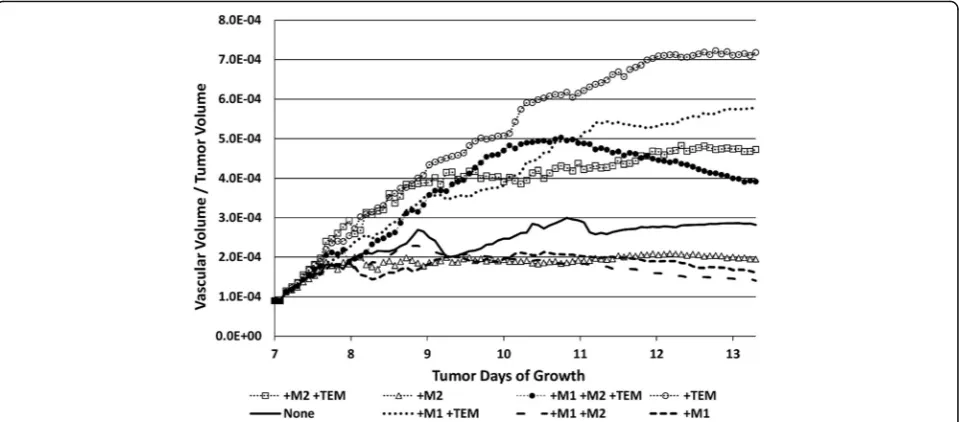
The ratio of tumor vascular volume to tumor tissue volume evolving in time (Fig. 8) shows, as expected, that the cases with TEM present had the highest
Fig. 3Tumor growth by 13 days with both TEM and M1 macrophage subtypes present (same description of panels as in Fig. 1). The M1 macrophages
ratios by 13 d, with the TEM-only case having the highest (7.2 × 10⁻⁴). The lowest ratio was for the M1/M2 case (1.5 × 10⁻⁴). The presence of the M2 subtype lowers these ratios because the stimulation of proliferation by M2 macrophages is faster than vascular development driven by the TEM. Interestingly, the ratio for the case
with M1/M2/TEM first peaks on day 10 at 5 × 10⁻⁴
and then declines to 3.9 × 10⁻⁴ by day 13, suggesting
a sequence of initially higher vascular development followed by increasing tumor volume. The ratio for the M1/M2 scenario also slightly declines after
peak-ing at 2.3 × 10⁻⁴ on day 8, implying a progressively
increasing tumor volume, while the M1-only case
declines to 1.6 × 10⁻⁴ by day 13 due to the
combi-nation of shrinking vasculature as well as tumor volume. All the other cases appear to plateau to con-stant ratios (M2 to 1.9 × 10⁻⁴, M2/TEM to 2.7 × 10⁻⁴, M1/TEM to 5.8 × 10⁻⁴, and with none to 2.8 × 10⁻⁴), which are values consistent with previous modeling work evaluating tumor growth as a function of vascularization [52].
Discussion
This study employed mathematical modeling to explore the tumor-promoting and tumor-inhibiting roles of three major TAM subtypes, namely, the M1 cytotoxic, the M2 tumor growth-promoting, and the TEM vasculature-stabilizing phenotypes. Model parameters were cali-brated to biologically-relevant values. A small, hypo-vascularized lesion was simulated growing in a highly vascularized microenvironment, such as in the lung or the liver, and the tumor growth, vasculature remodeling, and the macrophage activity were coupled. The results show that all cases with the M2 phenotype led to larger tumor growth regardless of TEM presence or not. The implication is that immunotherapeutic strategies leading to ablation of the TEM phenotype may provide limited benefit to restrain this growth when the M2 macro-phages represent a sizeable population. On the other hand, the vasculature-stabilizing effect of the TEM could perhaps be leveraged to achieve more homogeneous chemotherapy penetration into the tumor tissue, which is a notorious challenge presented by hypo-vascularized
Fig. 4Tumor growth by 13 days with only the TEM subtype present (same description of panels as in Fig. 1). In this case, the size of the tumor
Fig. 5Time evolution of the macrophage sub-populations depending on the type of the sub-populations. Left column (from top to bottom): M1-only, M2-only, and M1/M2 cases. Right column: as in left column plus TEM. MO: monocytes
Fig. 6Time evolution of the tumor vasculature and tissue as a function of macrophage sub-populations.aTumor vascular surface area
tumor lesions [11]. This suggests the intriguing possibil-ity that an immunotherapy that promotes monocyte differentiation to TEM during chemotherapy followed by therapy that ablates both TEM and M2 phenotypes during intervening cycles could represent a more optimal strategy.
Given the ability of tumors to educate infiltrating macrophages to a tumorigenic subtype, methods of countering this may prevent tumors from harnessing the body’s most potent effectors of tissue remodeling as has been previously suggested [53]. According to this paradigm, therapies which primarily inhibit monocytes and macrophages that infiltrate the tumor environment would not be ideal as they would fail to utilize the inherent tumoricidal activity of M1 macrophages. However, the modeling results indicate that there is a wide separation of time scales in the actions of the M1, M2 and TEM macrophages. In particular, the TEM
pro-tumor effects are less pronounced and on a longer time scale (days/weeks) than the M1 tumor-inhibiting effects (minutes/day). Thus, a more finessed approach to influ-ence monocyte differentiation that takes into account the state of the tumor (e.g., under chemotherapy or not) may be desirable.
Since the TEM phenotype is also implicated in the facilitation of cancer metastasis by degrading the ECM and guiding metastatic cells to the vasculature (e.g., as observed with breast cancer [54]), selective and timely blockade of this subtype from the tumor microenvironment may be essential to successfully halt and reverse the progression of cancer in patients [13]. The invasiveness-promoting action of the TEM subtype may in part explain the pitfalls seen in the use of VEGF inhibitors [55]. Due to the tendency, in some cases, of inhibited tumoral blood supply to lead to in-creased tumor spread through fragmentation and migration of tumor cells, preventing the vasculature from growing
Fig. 7Size of tumor vasculature and tumor on day 13 post inception as a function of macrophage sub-populations.aTumor vascular surface area
(μm2) assuming capillary sizes of 10μm diameter.bTumor radius (mm). None: no macrophages present
towards the tumor could force a more malignant and metastatic phenotype, as has been observed
experi-mentally [56–59], clinically [56], and predicted by
mathematical modeling [60–62]. Given that TEMs
differentiate from a monocyte precursor distinct from the M1 and M2 subtypes, the possibility of TEM-specific therapies may present a viable approach to influence tumor behavior [63].
Future work will explore the interaction of tumor and macrophage effects during treatment. Therapy could be delivered systemically as free drug or encapsulated in
nanovectors, as previously simulated [64–66], or its
delivery to the tumor site could be targeted by TAM uptake and release [11, 36]. Pharmaceutical ablation of promoting subtypes while supporting tumor-inhibiting phenotypes could provide nuanced thera-peutic options. The combination of various modalities could be explored via the modeling framework presented herein, as such options may be difficult to evaluate solely through experimental observation. To the extent that current oncology treatment options, such as chemother-apy and immunotherchemother-apy, favor one or more macrophage subtypes over other ones, the results of this study would be applicable in projecting how the resulting proportion of subtypes may influence the tumor progression and ul-timately the response to the therapy.
As this work represents an initial implementation,
incorporation of additional biological details may
provide enhanced modeling capability. It was recently reported that Programmed Cell Death Protein 1 (PD-1) expression by tumor-associated macrophages inhibits tumor immunity [67]. It was observed that almost all of the PD-1-expressing TAMs were of the M2 subtype, and that their proportion increased significantly with the dis-ease stage. The simulation of PD-1 expression by TAMs in this model would be expected to facilitate tumor survival by potentiating the tumor-promoting effect of the M2 macrophages, which would also indirectly influ-ence the TEM activity. Further, the addition of a stromal component dependent on ECM production and remod-eling would affect the transport of oxygen and nutrients, as well as the diffusivity of tumor- and macrophage-released cytokines, which in turn would affect the TAM response. A denser ECM, for example, could impede the diffusive transport while also potentially limiting the
tu-mor’s growth pattern. The modeling of primary instead
of metastatic lesions could be represented by changing the host vasculature pattern and macrophage subtype populations to match that of specific organs, as well as simulating potentially larger tumor masses. Such bio-logical details would be required to adapt the model to different cancer types, for which the defining character-istics would include particular tumor growth, vascular, stromal, and immune conditions to be calibrated with
the associated model parameters. With input of patient tumor-specific information, such as size, vascularization, and macrophage presence, this framework may in the longer term serve to determine optimal therapy
regi-mens leveraging the body’s immune response to
cancerous lesions.
Conclusions
This work provides a modeling platform for system analysis of the potent and varied effects of the macrophage activation spectrum on the tumor microenvironment, with the goal to complement current cancer therapy design. The results of this initial implementation show that TEM ablation as an immunotherapeutic strategy may fail to restrain growth when the M2 represents a sizeable population. Further, an approach that leverages the vasculature-stabilizing effect of the TEM during chemo-therapy may be desirable.
Abbreviations
2D:Two-dimensional; IL-10: Interleukin 10; IL-6: Interleukin 6; MMP-9: Matrix metallo-proteinase 9; NO: Nitric oxide; TAF: Tumor angiogenic factors; TAM: Tumor-associated macrophages; TEM: Tie2-expressing macrophages; TGF-β1: Tumor growth factorβ1; VEGF-A: Vascular endothelial growth factor A
Acknowledgements Not applicable
Funding
JL acknowledges partial support by National Science Foundation grant NSF-DMS-1714973, National Institutes of Health Grant P50GM76516 for the Center of Excellence in Systems Biology at the University of California, Irvine, and National Institutes of Health Grant P30CA062203 for the Chao Family Comprehensive Cancer Center at University of California, Irvine. HBF acknowledges partial support by the National Institutes of Health/National Cancer Institute Grant R15CA203605.
Availability of data and materials
All data generated or analyzed during this study are included in this published article.
Authors’contributions
Study conception and design: GM, LTC, JL, HBF; Model implementation and testing: GM, LTC; Data collection and analysis: GM, HBF; Initial manuscript: GM, HBF; Manuscript reviews and revisions: GM, LTC, JL, HBF. All authors read and approved the final manuscript.
Ethics approval and consent to participate Not applicable
Consent for publication Not applicable
Competing interests
The authors declare that they have no competing interests.
Publisher’s Note
Springer Nature remains neutral with regard to jurisdictional claims in published maps and institutional affiliations.
Author details
Biomedical Engineering, University of California, Irvine, CA, USA.4Department of Bioengineering, University of Louisville, Lutz Hall 419, Louisville, KY 40208, USA.5James Graham Brown Cancer Center, University of Louisville, Louisville, KY, USA.6Department of Pharmacology & Toxicology, University of Louisville, Louisville, KY, USA.
Received: 13 November 2017 Accepted: 20 December 2017
References
1. Chanmee T, Ontong P, Konno K, Itano N. Tumor-associated
macrophages as major players in the tumor microenvironment. Cancers. 2014;6(3):1670–90. doi: https://doi.org/10.3390/cancers6031670. 2. De Palma M, Lewis CE. Macrophage regulation of tumor responses to
anticancer therapies. Cancer Cell. 2013;23(3):277–86. doi: https://doi.org/ 10.1016/j.ccr.2013.02.013.
3. Squadrito ML, De Palma M. Macrophage regulation of tumor angiogenesis: implications for cancer therapy. Mol Asp Med. 2011;32(2): 123–45. doi: https://doi.org/10.1016/j.mam.2011.04.005.
4. Laoui D, Movahedi K, Van Overmeire E, Van den Bossche J, Schouppe E, Mommer C, Nikolaou A, Morias Y, De Baetselier P, Van Ginderachter JA. Tumor-associated macrophages in breast cancer: distinct subsets, distinct functions. The International journal of developmental biology. 2011;55(7–9):861–7. doi: https://doi.org/10.1387/ijdb.113371dl. 5. Italiani P, Boraschi D. From Monocytes to M1/M2 macrophages:
Phenotypical vs. Funct Differ Front Immunol. 2014;5:514. doi: https://doi.org/ 10.3389/fimmu.2014.00514.
6. Plank MJ, Sleeman BD. Tumour-induced angiogenesis: a review. J Theor Med. 2003;5(3–4):137–53. doi: https://doi.org/10.1080/
10273360410001700843.
7. Edin S, Wikberg ML, Dahlin AM, Rutegård J, Öberg Å, Oldenborg P-A, Palmqvist R. The distribution of macrophages with a M1 or M2 phenotype in relation to prognosis and the molecular characteristics of colorectal cancer. PLoS One. 2012;7(10):e47045. doi: https://doi.org/10.1371/journal. pone.0047045.
8. Yuan A, Hsiao Y-J, Chen H-Y, Chen H-W, Ho C-C, Chen Y-Y, Liu Y-C, Hong T-H, Yu S-L, Chen JJW, Yang P-C. Opposite effects of M1 and M2 macrophage subtypes on lung cancer progression. Sci Rep. 2015;5:14273. doi: https://doi. org/10.1038/srep14273.
9. Sica A, Mantovani A. Macrophage plasticity and polarization: in vivo veritas. J Clin Invest. 122(3):787–95. doi: https://doi.org/10.1172/JCI59643. 10. Murdoch C, Giannoudis A, Lewis CE. Mechanisms regulating the recruitment
of macrophages into hypoxic areas of tumors and other ischemic tissues. Blood. 2004;104(8):2224.
11. Leonard F, Curtis LT, Yesantharao P, Tanei T, Alexander JF, Wu M, Lowengrub J, Liu X, Ferrari M, Yokoi K, Frieboes HB, Godin B. Enhanced performance of macrophage-encapsulated nanoparticle albumin-bound-paclitaxel in hypo-perfused cancer lesions. Nano. 2016;8(25):12544–52. doi: https://doi.org/10.1039/C5NR07796F.
12. De Palma M, Venneri MA, Galli R, Sergi LS, Politi LS, Sampaolesi M, Naldini L. Tie2 identifies a hematopoietic lineage of proangiogenic monocytes required for tumor vessel formation and a mesenchymal population of pericyte progenitors. Cancer Cell. 2008;8(3):211–26. doi: https://doi.org/10.1016/j.ccr.2005.08.002.
13. Venneri MA, De Palma M, Ponzoni M, Pucci F, Scielzo C, Zonari E, Mazzieri R, Doglioni C, Naldini L. Identification of proangiogenic TIE2-expressing monocytes (TEMs) in human peripheral blood and cancer. Blood. 2007;109(12):5276–85. doi: https://doi.org/10.1182/blood-2006-10-053504.
14. Patel AS, Smith A, Nucera S, Biziato D, Saha P, Attia RQ, Humphries J, Mattock K, Grover SP, Lyons OT, Guidotti LG, Siow R, Ivetic A, Egginton S, Waltham M, Naldini L, De Palma M, Modarai B. TIE2-expressing monocytes/ macrophages regulate revascularization of the ischemic limb. EMBO Mol Med. 2013;5(6):858–69. doi: https://doi.org/10.1002/emmm.201302752. 15. Matsubara T, Kanto T, Kuroda S, Yoshio S, Higashitani K, Kakita N, Miyazaki
M, Sakakibara M, Hiramatsu N, Kasahara A, Tomimaru Y, Tomokuni A, Nagano H, Hayashi N, Takehara T. TIE2-expressing monocytes as a diagnostic marker for hepatocellular carcinoma correlates with
angiogenesis. Hepatology. 2013;57(4):1416–25. doi: https://doi.org/10.1002/ hep.25965.
16. De Palma M, Naldini L. Angiopoietin-2 TIEs up macrophages in tumor angiogenesis. Clin Cancer Res. 2011;17(16):5226–32. doi: https://doi.org/10. 1158/1078-0432.ccr-10-0171.
17. Riabov V, Gudima A, Wang N, Mickley A, Orekhov A, Kzhyshkowska J. Role of tumor associated macrophages in tumor angiogenesis and lymphangiogenesis. Front Physiol. 2014;5:75. doi: https://doi.org/10.3389/ fphys.2014.00075.
18. Welford AF, Biziato D, Coffelt SB, Nucera S, Fisher M, Pucci F, Di Serio C, Naldini L, De Palma M, Tozer GM, Lewis CE. TIE2-expressing macrophages limit the therapeutic efficacy of the vascular-disrupting agent combretastatin A4 phosphate in mice. J Clin Invest. 2011;121(5): 1969–73. doi: https://doi.org/10.1172/JCI44562.
19. Mazzieri R, Pucci F, Moi D, Zonari E, Ranghetti A, Berti A, Politi LS, Gentner B, Brown JL, Naldini L, De Palma M. Targeting the ANG2/TIE2 axis inhibits tumor growth and metastasis by impairing angiogenesis and disabling rebounds of proangiogenic myeloid cells. Cancer Cell. 2011;19(4):512–26. doi: https://doi.org/10.1016/j.ccr.2011.02.005. 20. Coffelt SB, Tal AO, Scholz A, De Palma M, Patel S, Urbich C, Biswas SK,
Murdoch C, Plate KH, Reiss Y, Lewis CE. Angiopoietin-2 regulates gene expression in TIE2-expressing Monocytes and augments their inherent Proangiogenic functions. Cancer Res. 2010;70(13):5270–80. doi: https:// doi.org/10.1158/0008-5472.can-10-0012.
21. Coffelt SB, Chen YY, Muthana M, Welford AF, Tal AO, Scholz A, Plate KH, Reiss Y, Murdoch C, De Palma M, Lewis CE. Angiopoietin 2 stimulates TIE2-expressing monocytes to suppress T cell activation and to promote regulatory T cell expansion. J Immunol (Baltimore, Md : 1950). 2011;186(7): 4183–90. doi: https://doi.org/10.4049/jimmunol.1002802.
22. Lewis CE, De Palma M, Naldini L. Tie2-expressing Monocytes and tumor angiogenesis: regulation by hypoxia and Angiopoietin-2. Cancer Res. 2007; 67(18):8429–32. doi: https://doi.org/10.1158/0008-5472.can-07-1684. 23. De Palma M, Murdoch C, Venneri MA, Naldini L, Lewis CE.
Tie2-expressing monocytes: regulation of tumor angiogenesis and therapeutic implications. Trends Immunol. 2007;28(12):519–24. https:// doi.org/10.1016/j.it.2007.09.004.
24. Hamidullah, Changkija B, Konwar R. Role of interleukin-10 in breast cancer. Breast Cancer Res Treat. 2012;133(1):11–21. doi: https://doi.org/10.1007/ s10549-011-1855-x.
25. Esquivel-Velazquez M, Ostoa-Saloma P, Palacios-Arreola MI, Nava-Castro KE, Castro JI, Morales-Montor J. The role of cytokines in breast cancer development and progression. J Interf Cytokine Res. 2015;35(1):1–16. doi: https://doi.org/10.1089/jir.2014.0026.
26. Mocellin S, Marincola FM, Young HA. Interleukin-10 and the immune response against cancer: a counterpoint. J Leukoc Biol. 2005;78(5):1043–51. doi: https://doi.org/10.1189/jlb.0705358.
27. Forget MA, Voorhees JL, Cole SL, Dakhlallah D, Patterson IL, Gross AC, Moldovan L, Mo X, Evans R, Marsh CB, Eubank TD. Macrophage Colony-stimulating factor augments Tie2-expressing Monocyte differentiation, Angiogenic function, and recruitment in a mouse model of breast cancer. PLoS One. 2014;9(6):e98623. doi: https://doi.org/10.1371/journal.pone. 0098623.
28. Owen MR, Sherratt JA. Modelling the macrophage invasion of turnours: effects on growth and composition. IMA J Math Appl Med. 1998;15(2): 165–85.
29. Owen MR, Sherratt JA. Mathematical modelling of macrophage dynamics in tumours. Math Mod Meth Appl S. 1999;9(4):513–39.
30. Byrne HM, Cox SM, Kelly CE. Macrophage-tumour interactions: in vivo dynamics. Discrete Continuous Dynamical Syst - Series B. 2004;4(1):81–98. 31. Owen MR, Byrne HM, Lewis CE. Mathematical modelling of the use of
macrophages as vehicles for drug delivery to hypoxic tumour sites. J Theor Biol. 2004;226(4):377–91. doi: https://doi.org/10.1016/j.jtbi.2003.09.004. 32. Webb SD, Owen MR, Byrne HM, Murdoch C, Lewis CE.
Macrophage-based anti-cancer therapy: Modelling different modes of tumour targeting. Bull Math Biol. 2007;69(5):1747–76. doi: https://doi.org/10. 1007/s11538-006-9189-2.
33. Owen MR, Stamper IJ, Muthana M, Richardson GW, Dobson J, Lewis CE, Byrne HM. Mathematical modeling predicts synergistic antitumor effects of combining a macrophage-based, hypoxia-targeted gene therapy with chemotherapy. Cancer Res. 2011;71(8):2826–37. doi: https://doi.org/10.1158/ 0008-5472.can-10-2834.
effectiveness: mathematical modeling of oxygen, pH, and glutathione. PLoS One. 2014;9(10) doi: https://doi.org/10.1371/journal.pone.0107511. 35. Bocuk D, Krause P, Niebert S, Pukrop T, Beissbarth T, Ghadimi M, Koenig S.
Mouse models of colorectal and mammary cancer liver metastases and microenvironmental interplay with tumor-associated macrophages (TAMs). Z Gastroenterol. 2015;53(01):A4–34. doi: https://doi.org/10.1055/s-0034-1397186. 36. Leonard F, Curtis LT, Ware MJ, Nosrat T, Liu X, Yokoi K, Frieboes HB, Godin B.
Macrophage polarization contributes to the anti-Tumoral efficacy of Mesoporous Nanovectors loaded with albumin-bound Paclitaxel. Front Immunol. 2017;8:693. doi: https://doi.org/10.3389/fimmu.2017.00693. 37. Macklin P, McDougall S, Anderson ARA, Chaplain MAJ, Cristini V, Lowengrub
J. Multiscale modelling and nonlinear simulation of vascular tumour growth. J Math Biol. 2009;58(4–5):765–98. doi: https://doi.org/10.1007/s00285-008-0216-9.
38. van de Ven AL, Wu M, Lowengrub J, McDougall SR, Chaplain MA, Cristini V, Ferrari M, Frieboes HB. Integrated intravital microscopy and mathematical modeling to optimize nanotherapeutics delivery to tumors. AIP Adv. 2012; 2(1):11208. doi: https://doi.org/10.1063/1.3699060.
39. Wu M, Frieboes HB, McDougall SR, Chaplain MAJ, Cristini V, Lowengrub J. The effect of interstitial pressure on tumor growth: coupling with the blood and lymphatic vascular systems. J Theor Biol. 2013;320:131–51. doi: https:// doi.org/10.1016/j.jtbi.2012.11.031.
40. Lewis C, Murdoch C. Macrophage responses to hypoxia : implications for tumor progression and anti-cancer therapies. Am J Pathol. 2005;167(3):627–35. 41. McDougall SR, Anderson ARA, Chaplain MAJ. Mathematical modelling of
dynamic adaptive tumour-induced angiogenesis: clinical implications and therapeutic targeting strategies. J Theor Biol. 2006;241(3):564–89. doi: https://doi.org/10.1016/j.jtbi.2005.12.022.
42. Pries AR, Secomb TW, Gaehtgens P. Structural adaptation and stability of microvascular networks: theory and simulations. Am J Phys. 1998;275(2 Pt 2): H349–60.
43. McDougall SR, Anderson AR, Chaplain MA, Sherratt JA. Mathematical modelling of flow through vascular networks: implications for tumour-induced angiogenesis and chemotherapy strategies. Bull Math Biol. 2002; 64(4):673–702. doi: https://doi.org/10.1006/bulm.2002.0293.
44. Pries AR, Hopfner M, le Noble F, Dewhirst MW, Secomb TW. The shunt problem: control of functional shunting in normal and tumour vasculature. Nat Rev Cancer. 2010;10(8):587–93. doi: https://doi.org/10.1038/nrc2895. 45. van de Ven AL, Wu M, Lowengrub J, McDougall SR, Chaplain MAJ, Cristini V,
Ferrari M, Frieboes HB. Integrated intravital microscopy and mathematical modeling to optimize nanotherapeutics delivery to tumors. AIP Adv. 2012; 2(1) doi: https://doi.org/10.1063/1.3699060.
46. Spinney L. Caught in time. Nature. 2006;442(7104):736–8. doi: https://doi. org/10.1038/442736a.
47. Cui Y-LL, Hui-Kai, Zhou H-Y, Zhang T, Li Q. Correlations of tumor-associated macrophage subtypes with liver metastases of colorectal cancer. Asian Pac J Cancer Prevent. 2013;14(2):1003–7.
48. Frieboes HB, Curtis LT, Wu M, Kani K, Mallick P. Simulation of the protein-shedding kinetics of a fully vascularized tumor. Cancer Inform. 2015;14:163– 75. doi: https://doi.org/10.4137/CIN.S35374.
49. Kozlowski L, Zakrzewska I, Tokajuk P, Wojtukiewicz MZ. Concentration of interleukin-6 (IL-6), interleukin-8 (IL-8) and interleukin-10 (IL-10) in blood serum of breast cancer patients. Rocz Akad Med Bialymst. 2003;48:82–4. 50. Macklin P, Lowengrub J. Nonlinear simulation of the effect of
microenvironment on tumor growth. J Theor Biol. 2007;245(4):677–704. doi: https://doi.org/10.1016/j.jtbi.2006.12.004.
51. Macklin P, Lowengrub JS. A new ghost cell/level set method for moving boundary problems: application to tumor growth. J Sci Comput. 2008;35(2– 3):266–99. doi: https://doi.org/10.1007/s10915-008-9190-z.
52. Frieboes HB, Jin F, Chuang YL, Wise SM, Lowengrub JS, Cristini V. Three-dimensional multispecies nonlinear tumor growth-II: tumor invasion and angiogenesis. J Theor Biol. 2010;264(4):1254–78. doi: https://doi.org/10.1016/ j.jtbi.2010.02.036.
53. Quatromoni JG, Eruslanov E. Tumor-associated macrophages: function, phenotype, and link to prognosis in human lung cancer. Am J Transll Res. 2012;4(4):376–89.
54. Williams CB, Yeh ES, Soloff AC. Tumor-associated macrophages: unwitting accomplices in breast cancer malignancy. NPJ Breast Cancer. 2016;2:15025. doi: https://doi.org/10.1038/npjbcancer.2015.25.
55. Vasudev NS, Reynolds AR. Anti-angiogenic therapy for cancer: current progress, unresolved questions and future directions. Angiogenesis. 2014; 17(3):471–94. doi: https://doi.org/10.1007/s10456-014-9420-y.
56. de Groot JF, Fuller G, Kumar AJ, Piao Y, Eterovic K, Ji Y, Conrad CA. Tumor invasion after treatment of glioblastoma with bevacizumab: radiographic and pathologic correlation in humans and mice. Neuro-Oncology. 2010; 12(3):233–42. doi: https://doi.org/10.1093/neuonc/nop027.
57. Lamszus K, Kunkel P, Westphal M. Invasion as limitation to anti-angiogenic glioma therapy. Acta Neurochir Suppl. 2003;88:169–77.
58. Paez-Ribes M, Allen E, Hudock J, Takeda T, Okuyama H, Vinals F, Inoue M, Bergers G, Hanahan D, Casanovas O. Antiangiogenic therapy elicits malignant progression of tumors to increased local invasion and distant metastasis. Cancer Cell. 2009;15(3):220–31. doi: https://doi.org/10.1016/j.ccr. 2009.01.027.
59. Pennacchietti S, Michieli P, Galluzzo M, Mazzone M, Giordano S, Comoglio PM. Hypoxia promotes invasive growth by transcriptional activation of the met protooncogene. Cancer Cell. 2003;3(4):347–61.
60. Cristini V, Frieboes HB, Gatenby R, Caserta S, Ferrari M, Sinek J. Morphologic instability and cancer invasion. Clin Cancer Res. 2005;11(19 Pt 1):6772–9. doi: https://doi.org/10.1158/1078-0432.CCR-05-0852.
61. Cristini V, Lowengrub J, Nie Q. Nonlinear simulation of tumor growth. J Math Biol. 2003;46(3):191–224. doi: https://doi.org/10.1007/s00285-002-0174-6.
62. Frieboes HB, Zheng X, Sun CH, Tromberg B, Gatenby R, Cristini V. An integrated computational/experimental model of tumor invasion. Cancer Res. 2006;66(3):1597–604. doi: https://doi.org/10.1158/0008-5472.CAN-05-3166. 63. Mantovani A, Allavena P. The interaction of anticancer therapies with
tumor-associated macrophages. J Exp Med. 2015;212(4):435–45. doi: https:// doi.org/10.1084/jem.20150295.
64. Curtis LT, England CG, Wu M, Lowengrub J, Frieboes HB. An interdisciplinary computational/experimental approach to evaluate drug-loaded gold nanoparticle tumor cytotoxicity. Nanomedicine (Lond). 2016;11(3):197–216. doi: https://doi.org/10.2217/nnm.15.195.
65. Curtis LT, Wu M, Lowengrub J, Decuzzi P, Frieboes HB. Computational modeling of tumor response to drug release from vasculature-bound Nanoparticles. PLoS One. 2015;10(12):e0144888. doi: https://doi.org/10.1371/ journal.pone.0144888.
66. Wu M, Frieboes HB, Chaplain MA, SR MD, Cristini V, Lowengrub JS. The effect of interstitial pressure on therapeutic agent transport: coupling with the tumor blood and lymphatic vascular systems. J Theor Biol. 2014;355: 194–207. doi: https://doi.org/10.1016/j.jtbi.2014.04.012.
67. Gordon SR, Maute RL, Dulken BW, Hutter G, George BM, McCracken MN, Gupta R, Tsai JM, Sinha R, Corey D, Ring AM, Connolly AJ, Weissman IL. PD-1 expression by tumour-associated macrophages inhibits phagocytosis and tumour immunity. Nature. 2017;545(7655):495–9. doi: https://doi.org/10. 1038/nature22396.
68. Nugent LJ, Jain RK. Extravascular diffusion in normal and neoplastic tissues. Cancer Res. 1984;44(1):238–44.
• We accept pre-submission inquiries
• Our selector tool helps you to find the most relevant journal • We provide round the clock customer support
• Convenient online submission • Thorough peer review
• Inclusion in PubMed and all major indexing services • Maximum visibility for your research
Submit your manuscript at www.biomedcentral.com/submit