R E S E A R C H A R T I C L E
Open Access
Effects of refractive errors on visual evoked
magnetic fields
Masaya Suzuki
2, Mizuki Nagae
2, Yuko Nagata
2, Naoya Kumagai
2, Koji Inui
1*and Ryusuke Kakigi
1Abstract
Background:The latency and amplitude of visual evoked cortical responses are known to be affected by refractive states, suggesting that they may be used as an objective index of refractive errors. In order to establish an easy and reliable method for this purpose, we herein examined the effects of refractive errors on visual evoked magnetic fields (VEFs).
Methods:Binocular VEFs following the presentation of a simple grating of 0.16 cd/m2in the lower visual field were recorded in 12 healthy volunteers and compared among four refractive states: 0D, +1D, +2D, and +4D, by using plus lenses.
Results:The low-luminance visual stimulus evoked a main MEG response at approximately 120 ms (M100) that reversed its polarity between the upper and lower visual field stimulations and originated from the occipital midline area. When refractive errors were induced by plus lenses, the latency of M100 increased, while its amplitude decreased with an increase in power of the lens. Differences from the control condition (+0D) were significant for all three lenses examined. The results of dipole analyses showed that evoked fields for the control (+0D) condition were explainable by one dipole in the primary visual cortex (V1), while other sources, presumably in V3 or V6, slightly contributed to shape M100 for the +2D or +4D condition.
Conclusions:The present results showed that the latency and amplitude of M100 are both useful indicators for assessing refractive states. The contribution of neural sources other than V1 to M100 was modest under the 0D and +1D conditions. By considering the nature of the activity of M100 including its high sensitivity to a spatial frequency and lower visual field dominance, a simple low-luminance grating stimulus at an optimal spatial frequency in the lower visual field appears appropriate for obtaining data on high S/N ratios and reducing the load on subjects.
Keywords:Magnetoencephalography, Primary visual cortex, Refractive error, Visual evoked magnetic field
Background
Visual evoked potentials (VEPs) or magnetic fields (VEFs) are useful for assessing the visual system [1, 2]. However, VEPs are affected by non-pathological factors such as age, sex, and refractive states as well as visual stimulus parameters such as spatial frequency, contrast, and luminance. Of these, the refractive error is import-ant because the latency and amplitude of VEPs are both markedly affected by a blur in the retina [3–5], particu-larly when the spatial frequency of the stimulus is high [4, 6–8]. Therefore, correction of refractive errors is
necessary for avoiding false positive results in clinical tests. On the other hand, this suggests that the VEP amplitude and latency are applicable to objective assess-ments of refractive errors [9, 10]. We consider VEPs with appropriate controls applicable as a tool for devel-oping a better lens or prescribing a tailor-made lens for individuals.
In order to establish an easy and reliable method to objectively assess the eyes of a subject, we conducted a series of experiments using VEPs and VEFs. We herein described one of these experiments using transient VEFs. Although two fMRI studies previously demonstrated that induced myopia reduced visual evoked cortical ac-tivity in Brodmann’a areas 17 and 18 [11] or in V1 and * Correspondence:[email protected]
1
Department of Integrative Physiology, National Institute for Physiological Sciences, Okazaki 444-8585, Japan
Full list of author information is available at the end of the article
V2 [12], there is currently no electrophysiological study that describes neural origins of refraction-sensitive activ-ity. We employed a low-luminance simple grating in the present study instead of a pattern reversal stimulus in order to reduce the overall luminance of the stimulus by considering subject discomfort. No significant differ-ences were observed in the effects of checks and gratings of high spatial frequencies on VEPs [13].
Methods
Twelve (four females and eight males) healthy right-handed volunteers, aged 24–47 years (33.0 ± 6.7), with normal corrected visual acuity (20/20) and without neurological and ophthalmic disorders were enrolled. The study was approved in advance by the Ethics Committee of the National Institute for Physiological Sciences, Okazaki, Japan, and written consent was ob-tained from all subjects.
Stimulus
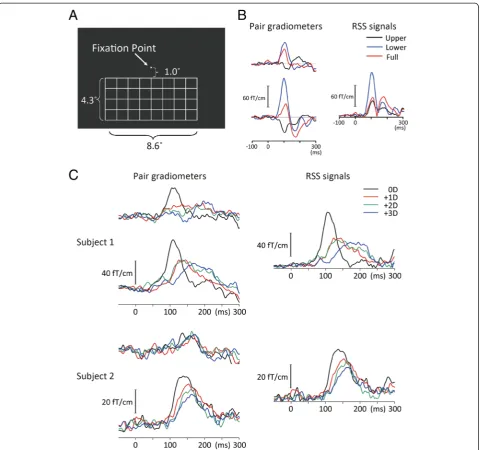
The visual stimulus was presented on a screen by a digital light processing projector placed outside of a shielded room (Mirage 2000, Christie Digital System Inc., Kitcherner, Canada). The refresh rate of the pro-jector was 60 Hz. We used a simple grating (Fig. 1a). Subjects were seated in front of the screen at a viewing distance of 2 m. The viewing angle of the grating stimu-lus was 4.3° (vertical) X 8.6° (horizontal) when it was presented in the lower or upper visual field. The width of the line was 0.06°. The luminance of lines was 0.16 cd/m2. The stimulus was 250 ms in duration and was presented every 500 ms. In Experiment 1, VEFs fol-lowing upper, lower, and full-field stimulations were compared in nine subjects. Since the results obtained showed that the stimulus in the lower visual field elicited larger M100 than that in the upper visual field (Fig. 1b), the lower visual field was stimulated in 12 subjects in Experiment 2.
Induction of refractive errors
Twenty-two out of the 24 eyes tested were myopic. Baseline recordings were initially made in the emmetro-pic state (+ 0D) by using lenses that the subjects tyemmetro-pic- typic-ally wore. Myopia was induced by adding plus ophthalmic lenses of 1D, 2D, and 4D in a plastic trial frame for both eyes, and cortical responses were re-corded for each condition in this order in all subjects.
VEF recordings
This experiment was performed in a darkened magnetic-ally shielded room. Binocular VEFs were recorded using a 306-channel whole-head type MEG system (Vector-view, ELEKTA Neuromag, Helsinki, Finland), which comprised 102 identical triple sensor elements. Each
sensor element consisted of two orthogonal planar gra-diometers and one magnetometer coupled to a multi-superconducting quantum interference device (SQUID), which provided 3 independent measurements of the magnetic fields. In this study, we analyzed MEG signals recorded from 204 planar-type gradiometers. These pla-nar gradiometers were sufficiently powerful to detect the largest signal just over local cerebral sources. Signals were recorded with a bandpass of 1–200 Hz and digi-tized at 1004 Hz. An analysis was conducted from 100 ms before to 300 ms after the onset of each stimu-lus. The 100-ms pre-stimulus period was used as the baseline. Epochs with MEG signals larger than 2.7 pt/cm were rejected from averaging. Under each refractive con-dition, 100 artifact-free epochs were averaged.
Analysis
We initially calculated vector sums from the longitudinal and latitudinal derivations of the responses recorded on planer-gradiometers at each of the 102 sensor locations. This was obtained by calculating the root sum square (RSS) of MEG signals of two gradiometers at the loca-tion of a sensor as described previously [14]. RSS wave-forms were obtained for all 102 sensor locations and we selected one location around the occipital midline with maximal amplitude at a latency of 100–200 ms (major MEG component, M100). The peak latency and ampli-tude of M100 were then measured on the RSS waveform in each subject.
We subsequently performed a single-dipole analysis using the brain electric source analysis (BESA) software package (NeuroScan, Mclean, VA) as described else-where [15]. The locations of estimate dipoles were expressed in Talairach coordinates by using BrainVoya-ger (QX 1.4, Brain Innovation BV, Maastricht, The Netherlands). The latency and amplitude of M100 were measured in the source strength waveform obtained.
A one-way analysis of variance (ANOVA) was used for statistical comparisons of the latency, amplitude, and source location of M100 among the lens conditions tested. P values less than 0.05 were considered significant. Data are expressed as the mean ± standard deviation.
Results
In Experiment 1, we compared VEFs in response to upper, lower, and full-field stimulations. Data from a representa-tive subject are shown in Fig. 1b. The main component of VEFs at approximately 100 ms (M100) was opposite in polarity between the upper and lower visual field stimula-tions. The mean RSS values at the peak of M100 were 27.3 ± 10.6, 57.2 ± 30.5, and 39.1 ± 24.4 fT/cm for upper, lower, and full-field stimulations, respectively, with the dif-ferences observed being significant (F2,14= 6.15,p= 0.012,
partial η2 = 0.47). The peak amplitude was significantly
greater for the lower than the upper visual field (p= 0.033). The visual field was not a significant factor for determining the latency of M100 (F = 0.19,p= 0.83). The effects of induced blurs were then examined by means of the lower visual field stimulation.
In Experiment 2, the visual stimulus evoked M100 at a sensor around the occipital midline in all subjects. Figure 1c shows the evoked magnetic fields and RSS waveform of M100 under each lens condition in two representative subjects. Grand-averaged RSS waveforms
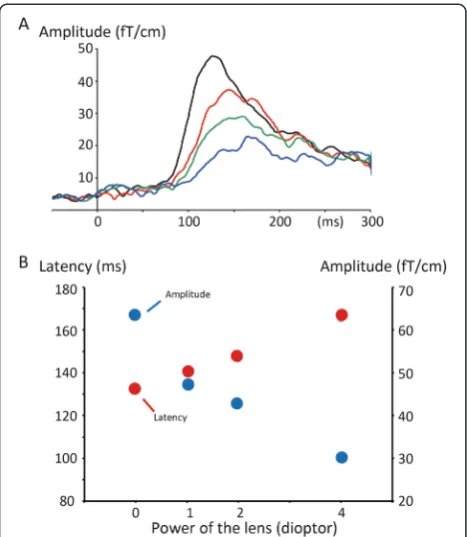
are shown in Fig. 2a. The amplitude gradually decreased and the latency became prolonged as the power of the lens increased (Fig. 2b). The results of one-way repeated measures ANOVAs showed that the refractive state was a significant factor for determining the latency (F3,33=
As shown in Fig. 2b, the function between the lens power (diopter) and latency or amplitude was almost linear.
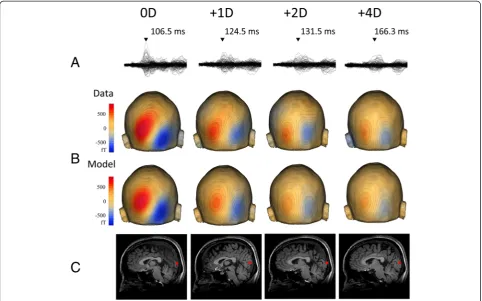
The results of the single dipole analysis showed that a reliable dipole was obtained for the 0D and +1D conditions in ten subjects, for +2D in nine, and for +4D in six. Figure 3 shows an example of the dipole analysis. Similar to the RSS results, the source strength of M100 progressively decreased and its la-tency increased with stronger defocusing. When ANOVAs were applied to data from nine subjects in whom dipoles for the 0D, +1D, and +2D conditions were obtained, the latency (F2,16= 9.22, p= 0.002,
partial η2 = 0.54) and amplitude (F = 7.94, p= 0.004, partial η2= 0.50) of M100 were significantly different among the three lens conditions. The mean location of the dipole in Talairach coordinates is listed in Table 1. A stronger lens caused a slightly superior dipole location. In order to confirm this statistically, we used data from the nine subjects. The results of one-way ANOVAs showed a significant difference among the three lens conditions for the z-axis (F2,16= 7.55, p= 0.005, partial η2 = 0.49), but
not for the x- (p= 0.81) or y- (p= 0.67) axis.
Discussion
Generator of M100
The field distribution in isocontour maps, polarity rever-sal between the upper and lower visual fields, and dipole
location around the calcarine fissure indicate that the main generator of M100 was the primary visual cortex (V1), which is consistent with previous findings observed using VEP [16] and VEF [17]. Since this component of VEPs or VEFs is sensitive to the luminance and spatial frequency of the stimulus, its latency markedly varies across studies. For example, in a MEG study by Portin et al. [17], the main MEG response, which peaked at ap-proximately 75 ms, appeared to correspond to our M100 showing almost the same response properties, except for the latency. In their study, the pattern reversal of check-erboards with white/black luminance of 60 and 1 cd/m2 was used, which was markedly brighter than ours (0.16 cd).
We found that V1 activity was strongly affected by re-fractive errors, which was congruent with the findings of previous fMRI studies showing myopia-induced reduc-tions in BOLD signals in and around V1 [11, 12]. In these studies, the extent of the V1 activity reduction was approximately 20 % by a +8D lens [12] and 10 % by +1D lens [11], which was slightly smaller than the value ob-tained in the present study (25 % by +1D). This may have been due to differences in the methodology used, namely, a VEF component is more sensitive to synchrony in neuronal firing than BOLD changes. Therefore, elec-trophysiological measures appear to be slightly superior for detecting changes in refractive states. On the other hand, in VEP and VEF recordings, in contrast to BOLD recordings, V1 activity under the full-field stimulation was problematic because the field activities of neurons in the upper and lower banks of the calcarine fissure canceled each other out. The present results supported this by showing that the magnetic response to the full-field stimulation was approximately a sum of polarity-reversed responses to the upper and lower visual field stimulations (Fig. 1b). Therefore, the lower field stimula-tion may have the advantage of obtaining cortical re-sponses with a high S/N ratio over the upper or full-field stimulations in VEP and VEF, at least when measures target V1 activity.
Sources other than V1
The results of dipole analyses showed that a stronger refractive error resulted in a superior location of the es-timated dipole. This result indicated that sources other than V1 participate in shaping M100 under strong de-focusing. One probable candidate is V6 [15, 17–19], which is located superior to V1, generates an antero-superior going current, and thereby gives rise to magnetic fields similar to those from V1 at a slightly superior pos-ition. Furthermore, V6 is known to be less sensitive to spatial frequencies [15]. Therefore, the contribution of V6 to M100 relative to that of V1 is expected to increase under induced refractive error states. Another candidate is Fig. 2Effects of refractive errors on M100.aGrand-averaged RSS
waveforms.bThe peak latency and amplitude of M100 as a function of the power of lens
V3, which is located lateral to V1, becomes active slightly later than V1 and is also less sensitive to spatial frequen-cies than V1 [15]. In the present study, a subject who dis-played the largest movement of the V1 dipole by inducing refractive errors showed a quadrupole pattern field distri-bution that was attributed to V3 activity [19] for the +4D condition. It is highly possible that V3 activity was absent or very weak at the V1 peak under the 0D condition, while V1 and V3 are simultaneously active around the later V1 peak under the +2D and +4D conditions. Therefore, when refractive errors are evaluated using VEPs or VEFs, it is important to note that temporally overlapping cortical sources may affect the results obtained and that stimulus parameters such as luminance and spatial frequency are
crucial for determining the relative contribution of each cortical activity.
Effects of refractive errors
As shown in previous VEP studies, refractive errors strongly influenced the latency and amplitude of VEFs. The present study found a significant difference between 0D and +1D for the latency and amplitude of M100, thereby supporting the view that electrophysiological measures are applicable for delicate adjustments to a lens. The difference of 8 ms between the 0D and +1D conditions was larger than the values of 2–7 ms reported in previous studies using pattern reversal (100–170 cd/m2) [7, 10, 13, 20]. In terms of the amplitude, the 25 % decrease from the control response for
Table 1Peak latency and amplitude of M100, and dipole locations
RSS Source analysis
Lens Latency Amplitude N Latency Amplitude Talairach coordinates
(ms) (fT/cm) (ms) (nAm) x y z
+0D 132.0 ± 16.8 63.3 ± 20.2 10 121.4 ± 12.0 15.2 ± 6.5 4.6 ± 7.1 −88.4 ± 8.0 4.1 ± 8.3
+1D 139.8 ± 18.9 47.2 ± 9.9 10 129.4 ± 12.8 11.4 ± 4.0 4.0 ± 6.7 −84.8 ± 8.8 5.6 ± 7.1
+2D 146.9 ± 24.3 42.8 ± 9.4 9 133.2 ± 14.6 8.9 ± 2.8 5.3 ± 8.6 −84.2 ± 8.9 11.4 ± 10.6
+4D 165.9 ± 29.1 30.1 ± 14.4 6 158.5 ± 18.9 8.2 ± 3.9 8.0 ± 10.9 −84.0 ± 9.2 9.4 ± 10.3
Fig. 3Single dipole analysis for M100. Data of a representative subject.asuperimposed MEG waveforms recorded from all 204 channels.
the +1D condition was similar to that reported by Anand et al. [10] at approximately 20 % using transient VEPs evoked by a checkerboard pattern with white checks of 122.9 cd/m2. Another study using a checker-board pattern stimulus of higher luminance reported a decrease of 14.5 % [6]. Therefore, sensitivity to the sub-tle changes in refractive states in the present study was not different from or slightly superior to those obtained using brighter checkerboard pattern stimuli. From the viewpoint of subject discomfort, a simple and sharp stimulus of lower-luminance may be better than a bright and flickering stimulus.
Conclusions
The present study showed that the VEF component, M100, evoked by a low-luminance simple grating, was sufficiently sensitive to the refractive state in order to detect subtle changes as small as 1D. Since M100 arises from V1 and the directions of the intracellular currents of M100 are opposite between neurons in the upper and lower lips of the calcarine fissure, stimulation of the lower visual field, which elicits larger responses than the upper field, appears to be suitable for assessing refractive states. In order to objectively measure refractive errors in individuals, accuracy as well as the load on a subject such as the recording time and stimulus brightness need to be considered. The present results will assist in estab-lishing a method for the reliable measurement of refract-ive errors in individuals. Further studies are necessary to confirm whether the present findings are applicable to refraction errors other than myopia such as astigmatism.
Abbreviations
MEG:magnetoencephalography; RSS: root sum square; V1: primary visual cortex; VEF: visual evoked magnetic field; VEP: visual evoked potential.
Competing interests
The authors declare that they have no competing interests.
Authors’contributions
MS, MN, YN, and KI contributed to planning the study, and data collection and analysis. MS, NK, KI, and RK drafted the manuscript. All authors read and approved the manuscript.
Acknowledgments
This study was funded by the ImPACT Program (2015-PM11-23-01) of the Council for Science, Technology, and Innovation (Cabinet Office, Government of Japan). The authors are grateful to Yasuyuki Takeshima for his technical support.
Author details
1Department of Integrative Physiology, National Institute for Physiological Sciences, Okazaki 444-8585, Japan.2R&D Department, Tokai Optical Co., Ltd, Okazaki 444-2192, Japan.
Received: 31 August 2015 Accepted: 29 October 2015
References
1. Sokol S. Visually evoked potentials: theory, techniques and clinical applications. Surv Ophthalmol. 1976;21:18–44.
2. Young B, Eggenberger E, Kaufman D. Current electrophysiology in ophthalmology: a review. Curr Opin Ophthalmol. 2012;23:497–505. 3. Spehlmann R. The averaged electrical responses to diffuse and to patterned
light in the human. Electroencephalogr Clin Neurophysiol. 1965;19:560–9. 4. Tumas V, Sakamoto C. Comparison of the mechanisms of latency shift in pattern reversal visual evoked potential induced by blurring and contrast reduction. Electroencephalogr Clin Neurophysiol. 1997;104:96–100. 5. Mezer E, Bahir Y, Leibu R, Perlman I. Effect of defocusing and of distracted
attention upon recordings of the visual evoked potential. Doc Ophthalmol. 2004;109:229–38.
6. Harter MR, White CT. Effects of contour sharpness and check-size on visually evoked cortical potentials. Vision Res. 1968;8:701–11.
7. Sokol S, Moskowitz A. Effect of retinal blur on the peak latency of the pattern evoked potential. Vision Res. 1981;21:1279–86.
8. Bartel PR, Vos A. Induced refractive errors and pattern electroretinograms and pattern visual evoked potentials: implications for clinical assessments. Electroencephalogr Clin Neurophysiol. 1994;92:78–81.
9. Millodot M, Riggs LA. Refraction determined electrophysiologically. Responses to alternation of visual contours. Arch Ophthalmol. 1970;84:272–8. 10. Anand A, De Moraes CG, Teng CC, Liebmann JM, Ritch R, Tello C.
Short-duration transient visual evoked potential for objective measurement of refractive errors. Doc Ophthalmol. 2011;123:141–7.
11. Mirzajani A, Sarlaki E, Kharazi HH, Tavan M. Effect of lens-induced myopia on visual cortex activity: a functional MR imaging study. AJNR Am J Neuroradiol. 2011;32:1426–9.
12. Elbel GK, Kaufmann C, Schaefers S, Buser A, Auer DP. Refractive anomalies and visual activation in functional magnetic resonance imaging (fMRI): a versatile and low-cost MR-compatible device to correct a potential confound. J Magn Reson Imaging. 2002;15:101–7.
13. Bobak P, Bodis-Wollner I, Guillory S. The effect of blur and contrast on VEP latency: comparison between check and sinusoidal and grating patterns. Electroencephalogr Clin Neurophysiol. 1987;68:247–55.
14. Raij T, McEvoy L, Mäkelä JP, Hari R. Human auditory cortex is activated by omissions of auditory stimuli. Brain Res. 1997;745:134–43.
15. Tsuruhara A, Nagata Y, Suzuki M, Inui K, Kakigi R. Effects of spatial frequency on visual evoked magnetic fields. Exp Brain Res. 2013;226:347–55. 16. Jeffreys DA, Axford JG. Source locations of pattern-specific components of
human visual evoked potentials. I. Component of striate cortical origin. Exp Brain Res. 1972;16:1–21.
17. Portin K, Vanni S, Virsu V, Hari R. Stronger occipital cortical activation to lower than upper visual field stimuli. Neuromagnetic recordings Exp Brain Res. 1999;124:287–94.
18. Vanni S, Tanskanen T, Seppä M, Uutela K, Hari R. Coinciding early activation of the human primary visual cortex and anteromedial cuneus. Proc Natl Acad Sci U S A. 2001;98:2776–80.
19. Inui K, Kakigi R. Temporal analysis of the flow from V1 to the extrastriate cortex in humans. J Neurophysiol. 2006;96:775–84.
20. Collins DWK, Carroll WM, Black JL, Walsh M. Effect of refractive error on the visual evoked response. Br Med J. 1979;1:231–2.
Submit your next manuscript to BioMed Central and take full advantage of:
• Convenient online submission
• Thorough peer review
• No space constraints or color figure charges
• Immediate publication on acceptance
• Inclusion in PubMed, CAS, Scopus and Google Scholar
• Research which is freely available for redistribution
Submit your manuscript at www.biomedcentral.com/submit