R E S E A R C H A R T I C L E
Open Access
Reliability and day-to-day variability of peak
fat oxidation during treadmill ergometry
Raul De Souza Silveira
1,2*, Anja Carlsohn
1,3, Georg Langen
1, Frank Mayer
1and Friederike Scharhag-Rosenberger
1,4Abstract
Background:Exercising at intensities where fat oxidation rates are high has been shown to induce metabolic benefits in recreational and health-oriented sportsmen. The exercise intensity (Fatpeak) eliciting peak fat oxidation rates is therefore of particular interest when aiming to prescribe exercise for the purpose of fat oxidation and related metabolic effects. Although running and walking are feasible and popular among the target population, no reliable protocols are available to assess Fatpeakas well as its actual velocity (VPFO) during treadmill ergometry. Our purpose was therefore, to assess the reliability and day-to-day variability of VPFOand Fatpeakduring treadmill ergometry running.
Methods:Sixteen recreational athletes (f = 7, m = 9; 25 ± 3 y; 1.76 ± 0.09 m; 68.3 ± 13.7 kg; 23.1 ± 2.9 kg/m2) performed 2 different running protocols on 3 different days with standardized nutrition the day before testing. At day 1, peak oxygen uptake (VO2peak) and the velocities at the aerobic threshold (VLT) and respiratory exchange ratio (RER) of 1.00 (VRER) were assessed. At days 2 and 3, subjects ran an identical submaximal incremental test (Fat-peak test) composed of a 10 min warm-up (70 % VLT) followed by 5 stages of 6 min with equal increments (stage 1 = VLT, stage 5 = VRER). Breath-by-breath gas exchange data was measured continuously and used to determine fat oxidation rates. A third order polynomial function was used to identify VPFOand subsequently Fatpeak. The reproducibility and variability of variables was verified with an intraclass correlation coefficient (ICC), Pearson’s correlation coefficient, coefficient of variation (CV) and the mean differences (bias) ± 95 % limits of agreement (LoA).
Results:ICC, Pearson’s correlation and CV for VPFOand Fatpeakwere 0.98, 0.97, 5.0 %; and 0.90, 0.81, 7.0 %, respectively. Bias ± 95 % LoA was−0.3 ± 0.9 km/h for VPFOand−2 ± 8 % of VO2peakfor Fatpeak.
Conclusion:In summary, relative and absolute reliability indicators for VPFOand Fatpeakwere found to be excellent. The observed LoA may now serve as a basis for future training prescriptions, although fat oxidation rates at prolonged exercise bouts at this intensity still need to be investigated.
Keywords:Peak fat oxidation, Reliability, Variability, Running, Treadmill ergometry
Background
Fat is next to carbohydrate the main substrate to fuel prolonged endurance exercise over a wide range of in-tensities. Exercising at intensities where fat oxidation rates are high has been advocated to induce metabolic changes that benefit both professional and recreational endurance athletes, as well as health-oriented exercisers [1]. The oxidative regulation of fat metabolism is
intricate and may be influenced by the intensity, dur-ation and type of the activity, as well as dietary intake pattern, muscle glycogen concentrations, gender and training status [2–6]. When described as a sole function of exercise intensity, fat oxidation will augment as inten-sity increases from low to moderate levels, achieving peak oxidation rates between 45 and 65 % of peak oxy-gen uptake (VO2peak), then to become minimal at inten-sities above 85 % of VO2peak[1, 7–9].
In recent years, there has been an emerging interest involving the maximization of fat metabolism during ex-ercise (e.g. with the aim of improving athletic training, generally related to performance enhancement aspects
* Correspondence:[email protected] 1
University Outpatient Clinic, Center of Sports Medicine, Potsdam University, Potsdam, Germany
2Swiss Federal Institute of Sport Magglingen, Magglingen, Switzerland
Full list of author information is available at the end of the article
in athletes or linked to therapeutic effects in patients) [10, 11]. Consequently, reliably identifying the intensity at which fat metabolism reaches peak oxidation levels is crucial when prescribing exercise for the purpose of fat oxidation and related metabolic effects [12]. The repro-ducibility of the intensity eliciting peak fat oxidation (PFO) rates (i.e. Fatpeak, but also referred to as Fatmaxor LIPOXmax) has been reported for a variety of submaxi-mal incremental protocols [6, 7, 13–16]. However, all re-liability studies to date have used cycle ergometry as the exercising method of choice, which in turn may limit a valid transferability from any of the previously tested protocols and their respective reproducibility indicators into other types of exercise. Yet, despite running and walking being feasible and popular modalities among different target populations [17], there are to date no re-liability data on the estimations of Fatpeak during tread-mill ergometry. Additionally, only a few studies have performed comprehensive statistical assessments as rec-ommended by the guidelines for reliability assessment in sports medicine [18]. These would include for instance, the establishment of both relative and absolute reliability indicators for key variables related to Fatpeakestimations, such as the actual velocity at which PFO rates occur (i.e. VPFO), as well as the computation of its respective intra-subject (day-to-day) variability. Therefore, the aims of the current investigation were to establish the reproduci-bility of VPFO and Fatpeak, and therewith contribute to the improvement of training prescriptions in running to enhance fat metabolism.
Methods
Subjects
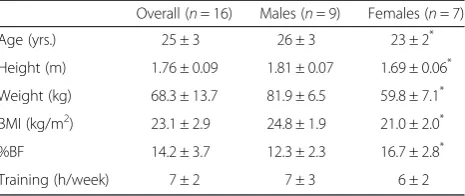
Sixteen healthy and active adults involved in the regular practice of different sports disciplines (i.e. running, cyc-ling, rugby and weight-lifting) voluntarily took part in the present investigation. The study was conducted in accordance with the declaration of Helsinki. The ethics committee from Potsdam University approved the study and participants gave their written informed consent after receiving detailed information about the investiga-tional protocol and aims. Inclusion criterion was≥3 h of training per week. The participants’anthropometric and training data are given in Table 1.
General design
All examinations were conducted at Potsdam University’s Outpatient Clinic. At day 1, a full medical check (anamnesis, anthropometrical assessment, physical examination, resting ECG) was carried out preceding the first exercise appointment as recommended by the German Federation for Cardiovascular Prevention and Rehabilita-tion [19]. Subsequently, participants performed a maximal baseline running test to determine the exercise stages for
the Fat-peak tests. On days 2 and 3, an identical submaxi-mal incremental running test (Fat-peak test 1 and 2) was carried out on the same treadmill ergometer (0.4 % inclin-ation) (H/P/ Cosmos Pulsar Graphics. 2005®, Germany). A breath-by-breath Metamax 3B system (Cortex Biophysik GmbH. Leipzig, Germany) was used to monitor respiratory data and to determine lipid oxidation rates via indirect cal-orimetry. Diet was controlled on the day prior to each of the submaximal tests. Participants performed all tests in a fasted state and were additionally advised to refrain from training during the 24 h before each bout. Female’s men-strual cycle was uncontrolled.
Baseline test
The baseline test consisted of a stepwise incremental running bout until volitional exhaustion. The initial stage of 6 km/h, stage increments of 2 km/h and stage duration of 3 min were defined to exhaust subjects in not less than 4 stages [15]. Lactate concentrations were measured in between stages from capillary blood sam-ples taken from the hyperemized earlobe (Biosen S line, EKF diagnostic GmbH. Magdeburg, Germany). Subse-quently, the following parameters were determined: The velocities at the aerobic threshold (VLT) [20] and respira-tory exchange ratio (RER) of 1.00 (VRER), as well as VO2peakand peak running velocity (Vpeak).
Fat-peak tests
Forty-eight hours after baseline, subjects performed the first submaximal incremental run. The bout lasted 30 min, i.e. 5 stages of 6 min, and was designed on an individualized basis, based on the recorded gas-exchange and blood lactate variables from each participant [15]. The starting velocity was set at VLT while the end vel-ocity was VRER. Hence, to obtain five stages of equal in-crement, the difference between end- and start-velocity needs to be divided by four (i.e. [(VRER- VLT) ÷ 4 = in-crement]). Before officially commencing the test, a 10 min warm up phase at 70 % VLTwas implemented to stabilize cardiopulmonary parameters and reduce pos-sible breathing artifacts that may arise at the beginning of exercise calorimetry [21]. The second (identical) Table 1Anthropometric and training data of subjects
Overall (n= 16) Males (n= 9) Females (n= 7) Age (yrs.) 25 ± 3 26 ± 3 23 ± 2* Height (m) 1.76 ± 0.09 1.81 ± 0.07 1.69 ± 0.06* Weight (kg) 68.3 ± 13.7 81.9 ± 6.5 59.8 ± 7.1* BMI (kg/m2) 23.1 ± 2.9 24.8 ± 1.9 21.0 ± 2.0* %BF 14.2 ± 3.7 12.3 ± 2.3 16.7 ± 2.8* Training (h/week) 7 ± 2 7 ± 3 6 ± 2
submaximal bout was then carried out 48 to 72 h later at the same time for each participant (07:00, 8:00 or 9:00 am). Subsequently, the following parameters were determined: fat oxidation rates, PFO, VPFO, oxygen up-take (VO2) at VPFOand heart rate (HR) at VPFO.
Dietary control
For compliance control, food intake was documented in a standardized diet record form [22] during the day before each submaximal run and analyzed later on. Participants were not given any specific dietary recom-mendations, but simply told to identically repeat their conventional nutritional plan at both days. A 12-h overnight fast was also enforced before every running bout. Nutrient and energetic values, including possible deviations within diet record forms were computed based on the German Nutrition database (PRODI 5.7, Nutri-Science GmbH. Hausach, Germany).
Gas exchange data analysis
Gas exchange data were checked for plausibility and an-alyzed using the software Metasoft 3, version 3.9. VO2peak was defined as the highest 30 s average value during the baseline test. For the Fat-peak tests, fat
oxida-tion rates were calculated from VO2 and the
non-protein RER according to Péronnet [23]. Gas exchange data (viewed with time interval of 10 s) were averaged over the last 30 s of each stage. By applying a third poly-nomial (P3) function (Prism 6, GraphPad Software Inc.), a graphic depiction of fat oxidation rates as a function of exercise intensity was created for each individual and used to determine PFO, VPFO, Fatpeak[16, 24] and subse-quently VO2and HR at VPFO.
Statistics
All of the analyzed parameters are descriptively reported as mean ± standard deviation (SD). Statistical analysis was performed using SPSS, version 20, IBM, USA & Microsoft Excel 2011. Samples were checked for normal-ity using the Shapiro-Wilk test. Gender differences in anthropometry, training and baseline performance data were tested with an un-paired t-test. During the Fat-peak tests, differences in VO2, RER, fat oxidation rates and HR were assessed with a two-way ANOVA for re-peated measures (test X stage). A paired t-test assessed the in between test differences for VPFO, PFO, Fatpeak, VO2at VPFO, HR at VPFO, as well as the differences in the dietary data. Relative and absolute reliability of VPFO and Fatpeak were verified with an intraclass correlation coefficient (ICC), the coefficient of variation (CV) and the Pearson’s correlation coefficient. The day-to-day variability of VPFO and Fatpeak was assessed with a
Bland-Altman analysis by establishing the mean
differences (bias) ± 95 % limits of agreement (LoA). Significance was set at aα-level of 0.05.
Results
Baseline characteristics
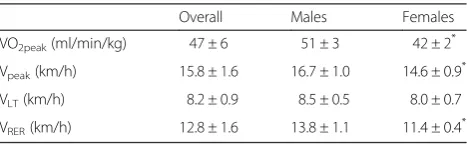
Baseline performance data are presented in Table 2.
Dietary intake
There were no significant differences (overall and indi-vidually) for any of the calculated variables in the re-ported dietary intake during the 24 h preceding the Fat-peak tests (P > 0.05). Mean values for energy, carbohy-drate, fat and protein intake were 2507 ± 561 kcal, 345 ± 118 g, 73 ± 34 g and 106 ± 28 g, respectively.
Fat-peak tests
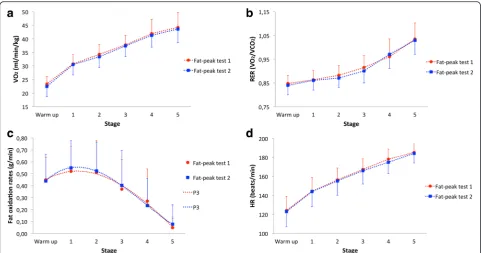
Individual values for start and end velocities ranged from 6.5 to 10.4 km/h and from 10.9 to 15.6 km/h, respect-ively. Likewise, stage increments ranged between 0.7 and 1.7 km/h. As shown in Fig. 1 (a-d), there we no significant differences recorded for VO2(P = 0.20), RER (P = 0.58), fat oxidation rates (P = 0.79) and HR (P = 0.13) during the two Fat-peak tests. Also with no significant systematic differ-ences between bouts, mean VPFO was 8.2 ± 1.9 and 7.9 ± 1.8 km/h (P = 0.69). The range in which individual means of VPFO were detected varied from 5.7 ± 0.2 to 12.5 ± 0.3 km/h, with 11 subjects achieving VPFO (in both tests) during the warm up phase (i.e. below VLT). Accordingly, mean PFO was 0.58 ± 0.22 and 0.60 ± 0.22 g/min (P = 0.85). The respective range of individual means for PFO went from 0.30 ± 0.08 to 1.03 ± 0.08 g/min. Fatpeak averaged at 64 ± 7 and 62 ± 6 % of VO2peak (P = 0.35), with individual means ranging from 50 ± 3 to 74 ± 2 % of VO2peak. Mean VO2 at VPFO was 30 ± 6 and 29 ± 6 ml/min/kg during each of the Fat-peak tests respectively (P = 0.61). The
corresponding individual means for VO2 at VPFO
ranged between 21 ± 2 and 40 ± 2 ml/min/kg. Likewise,
mean HR at VPFO was 143 ± 11 and 140 ± 13 beats/
min (P = 0.46), with range of individual means varying between 116 ± 1 and 162 ± 6 beats/min.
Reliability and day-to-day variability assessment of VPFO
and Fatpeak
ICC, Pearson’s coefficient and the CV scored 0.98, 0.97 and 5.0 % for VPFO,and 0.90, 0.81 and 7.0 % for Fatpeak
Table 2Baseline performance data
Overall Males Females VO2peak(ml/min/kg) 47 ± 6 51 ± 3 42 ± 2 *
Vpeak(km/h) 15.8 ± 1.6 16.7 ± 1.0 14.6 ± 0.9 *
VLT(km/h) 8.2 ± 0.9 8.5 ± 0.5 8.0 ± 0.7
VRER(km/h) 12.8 ± 1.6 13.8 ± 1.1 11.4 ± 0.4 *
respectively. As shown in Fig. 2, the bias ± 95 % limits of agreement for VPFO were −0.3 ± 0.9 km/h (−2 ± 8 % of VO2peak). Thus, indicating that 95 % of the intra-individual differences should be expected between −1.2 and +0.6 km/h (−10 and +6 % of VO2peak).
Discussion
The aim of the current study was to establish the repro-ducibility of key parameters that correspond to PFO rates (i.e. VPFOand Fatpeak) during treadmill ergometry. The main results of this investigation were the high ICC and Pearson’s correlation coefficient computed for VPFO and Fatpeak, in addition to the correspondingly low CV (i.e. 0.98, 0.97, 5.0 %; and 0.90, 0.81, 7.0 % respectively). Moreover, the performed Bland-Altman analysis has re-vealed a small bias of−0.3 km/h between Fat-peak tests,
with 95 % LoA for the reproducibility of VPFO of
0.9 km/h (i.e. -2 ± 8 % of VO2peak).
To our knowledge, the present investigation is the first to report on the reproducibility and day-to-day variabil-ity of both VPFOand Fatpeak during treadmill ergometry running. Hence, the current results reveal excellent values for the particular relative and absolute reliability indicators. The study group of Gmada [6] seems to be the first to have taken a more comprehensive statistical approach to assess the repeatability of Fatpeak. In their study, 12 sedentary, but otherwise healthy males per-formed a graded exercise test (5 stages of 6 min at 20, 30, 40, 50 and 60 % of the maximal aerobic power (MAP)) after a 12-h overnight fast. ICC and CV values for Fatpeak across test re-test trials separated by a time interval of 4 days were 0.97 and 5.0 %, respectively. The mean differences ± 95 % LoA for Fatpeakwas 0.6 ± 7.2 W, indicating that 95 % of the intra-individual differences
should be contained between −6.6 and +7.7 W. Based
on these values, relative and absolute reliability of Fatpeak were deemed as highly reliable by the authors. Unfortu-nately, no further appraisal has been made to address the physiological plausibility or applicability of the given LoA. Three other investigations have employed similar submaximal graded protocols (i.e. similar stage incre-ment and duration, plus the 12-h overnight food restric-tion prior to each bout), which were based either on the measured or on the theoretical MAP to establish the re-producibility of Fatpeak. Yet, conflicting findings have been reported. Pérez-Martin [13] reports a CV of 11.4 % for Fatpeak, and considered it satisfactory after assessing Fig. 1Overview of cardiorespiratory parameters and fat oxidation rates during Fat-peak tests.aAverage VO2during Fat-peak tests;bAverage RER during
Fat-peak tests;cAverage fat oxidation rates during Fat-peak tests (P3 interpolated);dAverage HR during Fat-peak tests. All values are mean ± SD
10 overweight, but otherwise healthy male participants (no LoA analysis carried out). Similarly, Michallet [14] reports on CV values between 7 and 12 %. Here, the reproducibility of Fatpeak was assessed via two differ-ent gas exchange techniques in a group of 14 healthy and moderately trained participants (9 males, 5 fe-males). More recently, Croci [16] assessed 15 healthy and moderately trained males, and computed CV values between 16 and 20 % for Fatpeakwhile implementing three different data analysis procedures. The authors add-itionally report a high intra-individual variability with mean differences ± 95 % LoA for Fatpeak (calculated with a P3 function) of−4 ± 32 % of VO2peak, indicating that 95 % of the intra-individual differences should be expected between−37 and +28 % of VO2peak. Two other investi-gations using different methodological approaches have addressed the reliability and/or variability of Fatpeak estimations. Achten [7] has advocated good reliability after assessing 10 healthy and moderately trained males as they performed an incremental test to exhaustion (test start: 95 W; stage increment and duration: 35 W every 3 min) on three different occasions and after a 12-h overnight fast. The CV for Fatpeak(% of VO2peak) was 9.6 %. The authors additionally report a root mean square error (typical error) and 95 % confidence interval for Fatpeakof 0.23 l/min (0.17 -0.34 l/min). Meyer [15] on the other hand, shows a large intra-individual variability for Fatpeak after assessing 21 healthy participants (10 males, 11 females) of varying en-durance capacities. Nutrition was moderately controlled, but with no fasting required prior to the exercise bouts. The implemented incremental exercise protocol was nearly identical to the one currently used in our study (further ap-praisal on the protocol is given below). The mean differ-ences ± 95 % LoA for Fatpeakwas−13 ± 0.91 l/min (−3.9 ± 28 % of VO2peak). Hence, 95 % of intra-individual differ-ences were to be expected between−1.04 and +0.78 l/min (−32 and +23 % of VO2peak). In this case, the large variabil-ity can be mostly attributed to the fact that only the end of each exercise stage was evaluated and not a continuous curve (i.e. whenever PFO switches from stage 2 to 3, for in-stance due to a small difference in the recorded rates, it will then result in a large difference in the equivalent % of VO2peak).
In the current study, the computed scores agree closely with those reported by Gmada [6], especially the CV, which has come noticeably lower then all of the other values reported in preceding analyses. As to the intra-individual (day-to-day) variability of Fatpeak, when expressed as % of VO2peak, our LoA values have been distinctly lower then those observed by Meyer [15] and Croci [16]. However, whilst these results enable closer comparisons to some of those from other investigations, making reasonable inferences as to the physiological plausibility and practical applicability of these LoA has
shown to be a challenging task. As implied by Croci [16], previous studies have deemed an intra-individual variability of ± 10 beats/min for HR at VPFOas accept-able, since this reflects a realistic margin in individuals who use HR for the monitoring of training intensity [7, 15]. Accordingly, in the present investigation this threshold has been sustained in most participants, with only three of them eventually exceeding the given cutoff (though by no more than 3 beats/min). There-fore, based on the strong aggregate of reliability indi-ces and the generally lower intra-individual variability observed for the aforementioned physiological aspects (i.e. Fatpeakas % of VO2peakand HR at VPFO), we con-sider the present Fatpeak estimations as the most reli-able and coherent to date. Furthermore, the employed treadmill running protocol may be used as a reliable tool to identify Fatpeak in moderately trained individ-uals, and according to the reported intra-individual variability values, serve as the basis for future investi-gational research.
In spite of that, its applicability for athletic training is still questionable. For instance, the high day-to-day vari-ability for PFO (g/min) remains largely unexplained. In the current study, PFO recordings between Fat-peak tests differed by a minimum of 0.01 g/min (1 %) and a maximum of 0.28 g/min (45 %) among the participants, which is consistent with inter- and intra-individual pat-terns described in previous investigations [1, 15, 16]. On the grounds of this known variability for PFO, recent studies [25, 26] have questioned the practical applicabil-ity of prescribing exercise training based on Fatpeak, since it remains debatable whether prolonged exercise at Fatpeakcan indeed be maintained with PFO rates. There-fore, it may be ultimately necessary for prospective stud-ies (e.g. those looking at the sustainability of PFO during prolonged exercise bouts at Fatpeak) to consider the LoA (or simply the individual test re-test difference) for Fatpeak, VPFOand PFO. Then, based on that, delineate the ± inten-sities in which exercise bouts should be performed and eventually evaluate how this impacts the sustainability of PFO (i.e. also in accordance to the identified intra-individual variability of each person). Other questions in need of further research include: 1) What are the physio-logical determinants and additional intrinsic/extrinsic fac-tors influencing the variability of fat oxidation rates during running, as well as in other types exercise? 2) How applic-able, versatile and reliable is the current protocol across dif-ferent cohorts of people (e.g. patients, untrained persons or professional athletes)?
to which individuals/variables maintain their position in a sample with repeated measurements; or the degree to which repeated measurements vary for individuals/vari-ables), in addition to practical information on the respective intra-individual (day-to-day) variability by es-tablishing the LoA (i.e. the individual subject differences in a test re-test plotted against the respective individual means) [18, 27–29]. Hereto, previous studies suggest that an ICC greater than 0.90 is reflective of high relative reliability, while values between 0.80 and 0.90 should be rated as moderate, with figures under 0.80 being graded as not sufficient for physiological testing [6, 30]. Add-itionally, a Pearson’s coefficient greater than 0.80 is ad-vocated as high [18], whereas a CV under 10 % can be considered as an indicator for a reliable test, being a commonly used and accepted threshold for biological variables [6, 31, 32].
In the current study we have implemented rigid pre-testing conditions with standardized nutrition and exer-cise restraint for the 24 h prior to each submaximal bout. Yet, other methodological factors such as the elected exercise protocol, data analysis approach as well as the embedded equipment error may affect the deter-mination of fat oxidation rates and subsequently VPFO [16]. The currently employed exercise protocol intends to cover the realistic range for VPFO determination and takes into account important physiological aspects in its design to ensure gas exchange maintains steady state for as long as possible [15]. The start velocity (VLT) corre-sponds to the first increase in blood lactate and can be considered as the upper border for the conduction of re-generative training. The end velocity (VRER) represents a metabolic state where energy supply is expected to yield solely from carbohydrate metabolism. Ultimately, three stages in between these metabolic markers should ac-count for an accurate determination of VPFO[15, 21, 33, 34]. Additionally, we have chosen to create P3 curves, as it is a valid and widely used method that models the overall kinetics of fat oxidation for a more coherent rep-resentation of VPFOand PFO [12].
Here we would like to comment on the 11 participants that had their VPFO and Fatpeak computed during the warm up phase. One reason for this could of course be the rather moderate aerobic endurance capacity of par-ticipants, since in less trained individuals Fatpeak occurs at lower exercise intensities than in trained individuals [34]. However, when looking at the individual raw fat oxidation rates, only 5 subjects have had indeed higher fat oxidation values during the warm up phase. The remaining 6, had their highest raw values recorded at the end of the first stage and were somewhat “drifted backwards”due to the applied P3 interpolation and how the curve-fit reacted upon the variables. Such a drift can also occur in the opposite way as depicted in Fig. 1c,
which in this case, was caused when curve-fitting the overall means for fat oxidation rates instead of individual values. This prompted the curve into a small elongation (likely driven by the subjects that had PFO rates at the latter stages of the tests). Hence, the depiction of PFO rates that are slightly lower than the mean of individu-ally interpolated values, and which also occur during the test phase and not the warm up. Still, the use of a math-ematical model such as the P3, is a more consistent ap-proach than just accounting for the raw measured values when analyzing data that does not align in a perfect curve [12]. However, alternative ways of curve-fitting might be evaluated in the future.
At last, it must be noted that the total variation ob-served in our test re-test is a sum of both biological and equipment variation (error) [15, 16]. Though ana-lyzing the relative contribution of each of these pa-rameters was beyond the scope of this study, the used gas exchange analyzer has been considered reliable [35]. Ideal ICC values (1.00) were computed for venti-lation (VE) VO2 and VCO2. Respectively, the average intra-device technical error of measurement (%TEM) was 0.2, 1.4 and 1.1 %.
Conclusion
The present study for the first time aimed at investigat-ing the reliability and day-to-day variability of peak fat oxidation in treadmill running in moderately trained male and female recreational athletes, using appropriate statistical methods. In summary, the reproducibility of VPFO and Fatpeak during treadmill ergometry was found to be excellent with ICC, Pearson’s correlation coeffi-cient and CV scoring at 0.98, 0.97, 5.0 %; and 0.90, 0.81, 7.0 % respectively. Fatpeakdetermined in a treadmill test might therefore serve as training prescription, although fat oxidation rates at prolonged exercise bouts at this in-tensity still need to be investigated.
Abbreviations
VO2peak:Peak oxygen uptake; PFO: Peak fat oxidation; Fatpeak: Intensity
eliciting peak fat oxidation rates; VPFO: Velocity at which peak fat oxidation
occurs; BMI: Body mass index; %BF: Percentage body fat; VLT: Velocity at
aerobic threshold; RER: Respiratory exchange ratio; VRER: Velocity at
respiratory exchange ratio of 1.00; Vpeak: Peak running velocity; VO2: Oxygen
uptake; HR: Heart rate; P3: Third polynomial; ICC: Intraclass correlation coefficient; CV: Coefficient of variation; Bias: Mean differences; LoA: Limits of agreement; MAP: Maximal aerobic power; %TEM: Technical error of measurement.
Competing interests
The authors declare that they have no competing interests.
Authors’contributions
RDSS participated in the study design, conduction of all experiments, data analysis and drafted the manuscript. AC participated in the study design and conduction of experiments. GL participated in the conduction of
the drafting of the manuscript. All authors read and approved the final manuscript.
Author details
1University Outpatient Clinic, Center of Sports Medicine, Potsdam University,
Potsdam, Germany.2Swiss Federal Institute of Sport Magglingen,
Magglingen, Switzerland.3Department of Health Sciences, University of
Education Schwaebisch Gmuend, Schwaebisch Gmuend, Germany.
4Department of Medical Oncology, National Center for Tumor Diseases
(NCT), Heidelberg University Hospital, Heidelberg, Germany.
Received: 2 December 2015 Accepted: 20 January 2016
References
1. Gonzalez JT, Stevenson EJ. New perspectives on nutritional interventions to augment lipid utilization during exercise. Brit J Nutr. 2012;107:339–49. 2. Brooks GA, Mercier J. Balance of carbohydrate and lipid utilization during
exercise: the“crossover”concept. J Appl Physiol. 1994;76:2253–61. 3. Weltan SM, Bosch AN, Dennis SC, Noakes TD. Influence of muscle glycogen
content on metabolic regulation. Am J Physiol. 1998;274:E72–82. 4. Achten J, Venables MC, Jeukendrup AE. Fat Oxidation Rates Are Higher
During Running Compared With Cycling Over a Wide Range of Intensities. Metabolism. 2003;52:747–52.
5. Pendergast DR, Meksawan K, Limprasertkul A, Fisher NM. Influence of exercise on nutritional requirements. Eur J Appl Physiol. 2011;111:379–90. 6. Gmada N, Marzouki H, Haj Sassi R, Tabka Z, Shephard R, Brun JF, et al.
Relative and absolute reliability of the crossover and maximum fat oxidation points and their relationship to ventilatory threshold. Sci Sports.
2012;28:e99–e105.
7. Achten J, Jeukendrup AE. Maximal Fat Oxidation During Exercise in Trained Men. Int J Sports Med. 2003;24:603–8.
8. Zehnder MM, Ith R, Kreis W, Saris W, Boutellier U, Boesche C. Gender-Specific Usage of Intramyocellular Lipids and Glycogen during Exercise. Med Sci Sport Exer. 2005;37:1517–24.
9. Brun JF, Jean F, Ghanassia E, Flavier S, Mercier J. Metabolic training: new paradigms of exercise training for metabolic diseases with exercise calorimetry targeting individuals. Ann Readapt Med Phys. 2007;50:528–34. 10. Tolfrey K, Jeukendrup AE, Batterham AM. Group- and individual-level
coincidence of the Fatmax and lactate accumulation in adolescents. Eur J Appl Physiol. 2010;109:1145–53.
11. Romain AJ, Carayol M, Desplan M, Fedou C, Ninot G, Mercier J, et al. Physical Activity Targeted at Maximal Lipid Oxidation: A Meta-Analysis. J Nutr Metab. 2012;2012:1–11.
12. Cheneviere X, Malatesta D, Peters EM, Borrani F. A mathematical model to describe fat oxidation kinetics during graded exercise. Med Sci Sports Exerc. 2009;41:1615–25.
13. Pérez-Martin A, Dumortier M, Raynaud E, Brun JF, Fédou C, Bringer J, et al. Balance of substrate oxidation during sub- maximal exercise in lean and obese people. Diabetes Metab. 2001;27:466–74.
14. Michallet AS, Tonini J, Regnier J, Guinot M, Favre-Juvin A, Bricout V, et al. Methodological aspects of crossover and maximum fat-oxidation rate point determination. Diabetes Metab. 2008;34:514–23.
15. Meyer T, Folz C, Rosenberger F, Kindermann W. The Reliability of Fatmax. Scand J Med Sci Sports. 2009;19:213–21.
16. Croci I, Borrani F, Byrne NM, Wood RE, Hickman IJ, Cheneviere X, et al. Reproducibility of Fatmax and fat oxidation rates during exercise in recreationally trained males. PLoS One. 2014;9:1–10.
17. Mendelson M, Jinwala K, Wuyam B, Levy P, Flore P. Can crossover and maximal fat oxidation rate points be used equally for ergocycling and walking/running on a track? Diabetes Metab. 2012;38:264–70. 18. Atkinson G, Nevill AM. A review of the statistical methods employed to
assess measurement error (reliability) in variables relevant in sports medicine. Sports Med. 1998;26:217–38.
19. Bjarnason-Wehrens B, Mayer-Berger W, Meister ER, Baum K, Hambrecht R, Gielen S. Einsatz von Kraftausdauertraining und Muskelaufbautraining in der kardiologischen Rehabilitation. Empfehlungen der Deutschen Gesellschaft für Prävention und Rehabilitation von Herz-Kreislauferkrankungen e.V. Z Kardiol. 2004;93:357–70.
20. Dickhuth HH, Yin L, Niess A, Röcker K, Mayer F, Heitkamp HC, et al. Ventilatory, lactate-derived and catecholamine thresholds during
incremental treadmill running: relationship and reproducibility. Int J Sports Med. 1999;20:122–7.
21. Xu F, Rhodes EC. Oxygen Uptake Kinetics During Exercise. Sports Med. 1999; 27:313–27.
22. Carlsohn A, Scharhag-Rosenberger F, Schapp L, Fusch G, Mayer F. Validität der Energiezufuhrbestimmung mittels Ernährungsprotokoll bei Normal-gewichtigen in Abhängigkeit von der Höhe der Energiezufuhr. Ern Um. 2012;59:572–77.
23. Péronnet F, Massicotte D. Table of Nonprotein Respiratory Quotient: An Update. Can J Spt Sci. 1991;16:23–9.
24. Stisen AB, Stougaard O, Langfort J, Helge JW, Sahlin K, Madsen K. Maximal fat oxidation rates in endurance trained and untrained women. Eur J Appl Physiol. 2006;98:497–506.
25. Schwindling S, Scharhag-Rosenberger F, Kindermann W, Meyer T. Limited Benefit of Fatmax-Test to Derive Training Prescriptions. Int J Sports Med. 2014;35:280–5.
26. Takagi S, Sakamoto S, Midorikawa T, Konishi M, Katsumura T. Determination of the exercise intensity that elicits maximal fat oxidation in short-time testing. J Sports Sci. 2014;32:175–82.
27. Altman DG, Bland JM. Measurement in medicine: the analysis of method comparison studies. Statistician. 1983;32:307–17.
28. Bland JM, Altman DG. Statistical methods for assessing agreement between two methods of clinical measurement. Lancet. 1986;1:307–10.
29. Baumgarter TA. Norm-referenced measurement: Reliability. In: Safrit MJ, Wood TM, editors. Measurement concepts in physical education and exercise science. Champaign, IL: Human Kinetics; 1989. p. 45–72. 30. Vincent WJ. Statistics in kinesiology. Champaign, IL: Human Kinetics; 1995. 31. Vassault A, Grafmeyer D, Naudin C, Dumont G, Bally M, Henny J. Protocoles
de validation de techniques. Ann Biol Clin. 1986;44:686–45. 32. Atkinson G, Nevill AM, Edwards B. What is an acceptable amount of
measurement error? The application of meaningful“analytical goals”to the reliability analysis of sports science measurements on a ratio scale. J Sports Sci. 1999;17:18.
33. Meyer T, Lucıa A, Earnest CP, Kindermann W. A conceptual framework for performance diagnosis and training prescription from submaximal parameters–theory and application. Int J Sports Med. 2005;26:38–48. 34. Jeukendrup AE, Wallis GA. Measurement of substrate oxidation during
exercise by means of gas exchange measurements. Int J Sports Med. 2005;26:28–37.
35. Macfarlane DJ, Wong P. Validity, reliability and stability of the portable Cortex Metamax 3B gas analysis system. Eur J Appl Physiol. 2012;112:2539–47.
• We accept pre-submission inquiries
• Our selector tool helps you to find the most relevant journal
• We provide round the clock customer support
• Convenient online submission
• Thorough peer review
• Inclusion in PubMed and all major indexing services
• Maximum visibility for your research
Submit your manuscript at www.biomedcentral.com/submit