Published online October 20, 2013 (http://www.sciencepublishinggroup.com/j/sjbm) doi: 10.11648/j.sjbm.20130103.11
Project selection: artificial neural network approach
Olanrewaju Oludolapo Akanni
1, *, Jimoh Abdul-Ganiyu Adisa
2, Kholopane Pule
31
Industrial Engineering Department, Tshwane University of Technology, Pretoria, South Africa 2
Electrical Engineering Department, Tshwane University of Technology, Pretoria, South Africa 3
Industrial Engineering Department, University of Johannesburg, Johannesburg, South Africa
Email address:
[email protected](O. O. Akanni), [email protected](J. A. Adisa), [email protected](K. Pule)
To cite this article:
Olanrewaju OludolapoAkanni, Jimoh Abdul-Ganiyu Adisa, Kholopane Pule. Project Selection: Artificial Neural Network Approach.Science Journal of Business and Management.Vol. 1, No. 3, 2013, pp. 37-42. doi: 10.11648/j.sjbm.20130103.11
Abstract:
To prioritize projects and satisfy both the investors and the society from benefitting from the projects, a mathematical tool which has the characteristics of prediction and evaluation is required. If a dependable forecasting model could be achieved, it will be very valuable for the assessment and selection of projects. This paper employs artificial neural network (ANN) technique in the selection of projects. To demonstrate this technique, the ANN modelis illustrated using Oral, Kettani and Lang’s data on 37 R&D projects for its success. From the validation analysis, it was discovered that artificial neural network displayed a high potential to deciding how projects should be ranked and selected.Keywords:
Project Selection, Regression Analysis, Artificial Neural Network1. Introduction
Among the primary elements for maintenance and thriving operations of companies and for every country aspiring to develop its state’s competitiveness is R&D.In spite of this, owing to constrained budgets and resources, few R&D projects can be carried out , which paves way for the crucial task of ranking and selecting projects[1]. Decision making in organizations is a complex process[2]. Assessing the performance of R&D is a vital but complicate task[3]. Deciding on appropriate projects to carry out from an organization’s perspective is very vital, for the reason that it offers an effectual and capable way of realizing the objectives of an organization[1]. The skill to always decide on the best projects to finance is therefore crucially imperative for firms/organizations[4].Widespread academic research has been carried outmore than 35 years or more increating and developingtechniques to advance the selection of R&D projects[4].
Selecting projects is a tactical decision problem with the characteristics ofseveral, contradictory and disproportionate criteria [5, 6]whilst those making decisionshave to make a decisionon a portfolio of the most appealing options by consideringvariousfacets regarding the efficiency of the projects[5, 7].
The selection of projects is considered a complicated decision making procedure because it is influenced by severaldecisive factors including conditions of the market,
accessibility of raw materials and resources, chance of practical success and government policies[5, 8]
With the availability of limited resources for project selection and management, decision makers are faced with different predicaments associated with the analysis, ranking and selection of projects. Clearly, erroneous decisions in selecting projects have two harsh penalties: first, resources are exhausted on inappropriate projects and, second, the organization loses the profits it might have acquired if the resources had been exhausted onotherappropriate projects [5]
developing predictive models to estimate the needed parameters [11].
ANN has been chosen for this study since it has advantage over traditional classification methods. The choice of using artificial neural network method over traditional classification methods depends on their success on estimating the non-linear function [12].
The study focuses on the strength of the neural network to predict and alongside,its ability to provideconstructive managerial approach to ranking and selecting R&D projects. For a successful ranking and selection, this method would be used to measure the efficiency of the
projects. To illustrate this method, the model is demonstrated using Oral et al [13] data on 37 R&D projects for practical observation.
2. Data
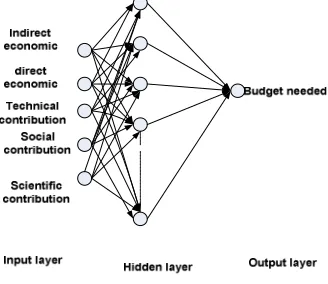
Case study data employed (table 1) was from Oral et al’ study[13], 37 R&D projects where the budget needed serves as the output whereas the contributions, thus, the direct economic, indirect economic, technological, scientific, and social contributions represent the input variables to the proposed neural network.
Table 1: Data on 37 R&D projects from Oral et al [13]
R&D Project Budget Needed Indirect
Economic Direct Economic
Technical Contribution
Social Contribution
Scientific Contribution
1 84.2 67.53 70.82 62.64 44.91 46.28
2 90 58.94 62.86 57.47 42.84 45.64
3 50.2 22.27 19.68 6.73 10.99 5.92
4 67.5 47.32 47.05 21.75 20.82 19.64
5 75.4 48.96 48.48 34.9 32.73 26.21
6 90 58.88 77.16 35.42 29.11 26.08
7 87.4 50.1 58.2 36.12 32.46 18.9
8 88.8 47.46 49.54 46.89 24.54 36.35
9 95.9 55.26 61.09 38.93 47.71 29.47
10 77.5 52.4 55.09 53.45 19.52 46.57
11 76.5 55.13 55.54 55.13 23.36 46.31
12 47.5 32.09 34.04 33.57 10.6 29.36
13 58.5 27.49 39 34.51 21.25 25.74
14 95 77.17 83.35 60.01 41.37 51.91
15 83.8 72 68.32 25.84 36.64 25.84
16 35.4 39.74 34.54 38.01 15.79 33.06
17 32.1 38.5 28.65 51.18 59.59 48.82
18 46.7 41.23 47.18 40.01 10.18 38.86
19 78.6 53.02 51.34 42.48 17.42 46.3
20 54.1 19.91 18.98 25.49 8.66 27.04
21 74.4 50.96 53.56 55.47 30.23 54.72
22 82.1 53.36 46.47 49.72 36.53 50.44
23 75.6 61.6 66.59 64.54 39.1 51.12
24 92.3 52.56 55.11 57.58 39.69 56.49
25 68.5 31.22 29.84 33.08 13.27 36.75
26 69.3 54.64 58.05 60.03 31.16 46.71
27 57.1 50.4 53.58 53.06 26.68 48.85
28 80 30.76 32.45 36.63 25.45 34.79
29 72 48.97 54.97 51.52 23.02 45.75
30 82.9 59.68 63.78 54.8 15.94 44.04
31 44.6 48.28 55.58 53.3 7.61 36.74
32 54.5 39.78 51.69 35.1 5.3 29.57
33 52.7 24.93 29.72 28.72 8.38 23.45
34 28 22.32 33.12 18.94 4.03 9.58
35 36 48.83 53.41 40.82 10.45 33.72
36 64.1 61.45 70.22 58.26 19.53 49.33
37 66.4 57.78 72.1 43.83 16.14 31.32
3. Methods
3.1. Neural Network
Developing models from observed data is a fundamental problem in many fields, such as statistical data analysis, signal processing, control, forecasting, and computational intelligence [10]. Many improvements have been made in exploiting intelligent systems, some inspired by biological neural networks, fuzzy systems and integration of them [14]. Nonetheless, artificial neural networks (ANN) have obtained the most wide application indisputably, referenced
along with the most potent computational mechanisms ever built [15].
3.1.1. Problem Formulation
mse ∑ e k ∑ t k a k (1)
The least mean square error (LMS) algorithm adjusts the weights and biases of the linear network so as to minimize the mean square error. The type of ANN used in this study is the Multilayer Perceptron (MLP) trained by the backpropagation algorithm, originally developed by Rumelhart et al [16]. The architecture of this network consists of three layers namely the input, hidden and output layer, with each layer having one or more neurons, in addition to bias neurons connected to the hidden and output layers. The computational procedure of the network is described below[15]:
Y f ∑ w X ), (2)
where Y is the output of node j, ƒ . the transfer function, w the connection weight between node j and node i in the lower layer and X the input signal from the node i in the lower layer. The backpropagation is based on a steepest descent technique with a momentum weight (bias function) which calculates the weight change for a given neuron. It is expressed as follows [15, 17]: let ∆w n
denote the synaptic weight connecting the output of neuron
i to the input of neuron j in the pth layer at iteration n. The adjustment ∆w n to w n is given by
∆w n η n "# $
"%&'( , (3)
where η(n) is the learning rate parameter. By using the chain rule of differentiation, the weight of the network with the backpropagation learning rule is updated using the following formulae:
∆w n η n ∂ n X * n m n ∆w n 1 ,(4)
∆w n , 1 w n , ∆w n , (5)
where∂ n is the nth error signal at the jth neuron in the pth layer, X * n is the output signal of neuron i at the layer below and m is the momentum factor. The data used by the network must be scaled for the network to be effective. In theory the inputs to the network can be any value, however scaling values to the same order of magnitude (generally in the range 0 to 1 or -1 to 1) enables the network to learn relationships quicker[18].
Neural Network Measures of Efficiency
Measuring the neural network model efficiencies, the predicted values of the budget needed was used together with the observed values from the equation below:
- .
./012 345 #6 (6)
where
7is the observed output
789:is the predicted output by the solution to the modeL
max Eris the maximum residual obtained.
3.1.2. Application of Neural Network
The chosen neural network architecture is depicted in figure 1. The input layer has the five contributions (input neurons), with nine hidden neurons in the hidden layer and one output layer which is the budget needed. Inputs and output are normalized in the (1, -1) range. Tansig and purelin transfer functions were used.
Figure 1: Architecture of the neural network
4. Results
ANN with MLP function had mean absolute error (MAE) 9.1541 and a coefficient of correlation R of 0.8386. Linear regression analysis is a likely confirmation method applied to the neural network model between the predicted and corresponding budget values needed. The analysis leads to a line y a , bx with a correlation coefficient R . A perfect prediction would give, b 1 and R 1.
Table 2: Linear regression analysis parameters for the ANN validation of energy consumption
R2 0.668
b 0.866
Figure 2 depicts a graphical output provided by this confirmation analysis. The predicted budget needed was plotted against the actual budget needed. From Table 2 and Figure 2, the neural network can be seen to predict appropriately. It can be noted that b and R are very close to 1 respectively from Table 2.
Figure 2: Graphical output provided by validation analysis
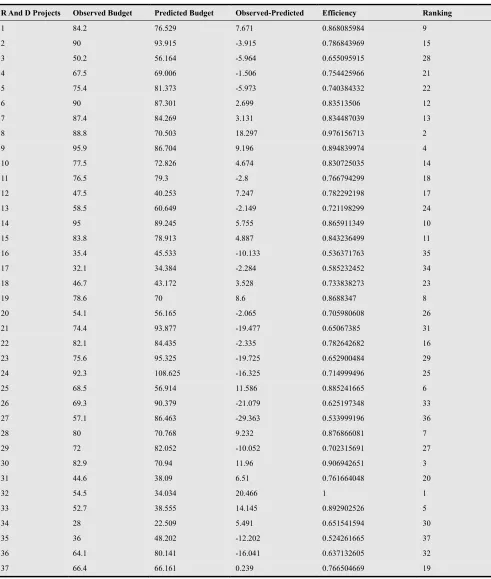
projects 32, 8, 30, 9, 33, 25, 28, 19, 1 and 14. This is shown in Table 3, following the efficiency analysis conducted
based on equation (6).
Table 3: Results from Artificial Neural Network
R And D Projects Observed Budget Predicted Budget Observed-Predicted Efficiency Ranking
1 84.2 76.529 7.671 0.868085984 9
2 90 93.915 -3.915 0.786843969 15
3 50.2 56.164 -5.964 0.655095915 28
4 67.5 69.006 -1.506 0.754425966 21
5 75.4 81.373 -5.973 0.740384332 22
6 90 87.301 2.699 0.83513506 12
7 87.4 84.269 3.131 0.834487039 13
8 88.8 70.503 18.297 0.976156713 2
9 95.9 86.704 9.196 0.894839974 4
10 77.5 72.826 4.674 0.830725035 14
11 76.5 79.3 -2.8 0.766794299 18
12 47.5 40.253 7.247 0.782292198 17
13 58.5 60.649 -2.149 0.721198299 24
14 95 89.245 5.755 0.865911349 10
15 83.8 78.913 4.887 0.843236499 11
16 35.4 45.533 -10.133 0.536371763 35
17 32.1 34.384 -2.284 0.585232452 34
18 46.7 43.172 3.528 0.733838273 23
19 78.6 70 8.6 0.8688347 8
20 54.1 56.165 -2.065 0.705980608 26
21 74.4 93.877 -19.477 0.65067385 31
22 82.1 84.435 -2.335 0.782642682 16
23 75.6 95.325 -19.725 0.652900484 29
24 92.3 108.625 -16.325 0.714999496 25
25 68.5 56.914 11.586 0.885241665 6
26 69.3 90.379 -21.079 0.625197348 33
27 57.1 86.463 -29.363 0.533999196 36
28 80 70.768 9.232 0.876866081 7
29 72 82.052 -10.052 0.702315691 27
30 82.9 70.94 11.96 0.906942651 3
31 44.6 38.09 6.51 0.761664048 20
32 54.5 34.034 20.466 1 1
33 52.7 38.555 14.145 0.892902526 5
34 28 22.509 5.491 0.651541594 30
35 36 48.202 -12.202 0.524261665 37
36 64.1 80.141 -16.041 0.637132605 32
37 66.4 66.161 0.239 0.766504669 19
5. Conclusion
This paper investigated artificial neural network, as a comprehensive and robust mathematical tool for ranking
mathematical tool effective enough for accurate prediction and evaluation.
From thedemonstrated case study highlighted in this paper, with respect to artificial neural network, it has shown from the validation analysis with the use of regression model that artificial neural network is a ‘dynamic’ modeling technique to support decision making.Following the efficiency analysis, projects 32, 8, 30, 9, 33, 25, 28, 19, 1 and 14 would be the most suitable first ten projects to be selected to achieve the objective of satisfying investors and economy based on the budget needed and the required input contributions. It has been successfully investigated in this study that forecasting is a critical toolfordecision makers of project management who need to analyse, predict and select the most beneficial project among the rest.
References
[1] Kao, C. and H.-L. Pao, Predicting project approvals: A case of grants from the National Science Council of Taiwan. Omega, 2012. 40: p. 89-95.
[2] Sandberg, P. and M. Soderstrom, Industrial energy efficiency: the need for investment decision support from a manager perspective. Energy Policy, 2003. 31: p. 1623-1634.
[3] S.Liu, J. and W.-M. Lu, DEA and ranking with the network-based approach: a case of R&D performance. Omega, 2010. 38: p. 453-464.
[4] Lawson, C.P., P.J. Longhurst, and P.C. Ivey, The application of a new research and development project selection model in SMEs. Technovation, 2006. 26: p. 242-250.
[5] Shakhsi-Niaei, M., S.A. Torabi, and S.H. Iranmanesh, A comprehensive framework for project selection problem under uncertainty and real-world constraints. Computer and Industrial Engineering, 2011. 61: p. 226-237.
[6] Liesio, J., P. Mild, and A. Salo, Preference programming for robust portfolio modeling and project selection. European Journal of Operational Research, 2007. 181: p. 1488-1505.
[7] Mavrotas, G., D. Diakoulaki, and A. Kourentzis, Selection among ranked projects under segmentation, policy and logical constraints. European Journal of Operational Research, 2008. 187: p. 177-192.
[8] Bard, J., R. Balachandra, and P.E. Kaufmann, AN interactive approach to R&D project selection and termination. IEEE Transactions on Engineering Mnagement, 1988. 35(3): p. 139-146.
[9] Al-Rashdan, D., B. Al-Kloub, A. Dean, and T. Al-Shemmeri, Environmental impact assessment and ranking the environmental projects in Jordan. European Journal of Operational Research, 1999. 118: p. 30-45.
[10] Amina, M., V.S. Kodogiannis, I.P. Prtrounias, J.N. Lygouras, and G.-J.E. Nychas, Identification of the Listeria monocytogenes survival in UHT whole milk utilising local linear wavelet neural networks. Expert system with Applications, 2012. 39: p. 1435-1450.
[11] Yilmaz, I. and O. Kaynar, Multiple regression,ANN (RBF,MLP) and ANFIS models for prediction of swell potential of clayey soils. Expert system with Applications, 2010.
[12] Wei, S., J. Zhang, and Z. Li. A Supplier-selecting system using a neural network. in IEEE International Conference on Intelligent Processing systems. 1997.
[13] Oral, M., O. Kettani, and P. Lang, A methodology for collective evaluation and selection of industrial R&D projects. Management Science, 1991. 37(7): p. 871-83.
[14] Hayati, M. and Y. Shirvany, Artificial Neural Network Approach for Short Term Load Forecasting for Illam Region. 2007, World Academy of Science, Engineering and Technology.
[15] Hsu, C.-C. and C.-Y. Chen, Regional load forecasting in Taiwan-applications of artificial neural networks. Energy conversion and Management, 2003. 44: p. 1941-1949.
[16] Rumelhart, E., G.E. Hinton, and R.J. Williams, eds. Learning Internal Representations by Error Propagation in Parallel Distributed Processing 1. ed. J.L.M.a.t.P.R.G. D.E Rumelhart, Eds. 1986, MIT Press: Cambridge, MA. 318 - 362.
[17] Huang, H., R. Hwang, and J. Hsieh, A new artificial intelligent peak power load forecaster based on non-fixed neural networks. Electric Power Energy Syst, 2002. 24: p. 245-50.
[18] Hart, A., Using neural networks for classification tasks - some experiments on datasets and practical advice. J.Opl. Res. Soc., 1992. 43: p. 215 - 226.
Biography
Oludolapo A. Olanrewaju received the B.Sc degree in Electrical Engineering and M.Sc in Industrial Engineering from the Univ. of Ibadan, Nigeria.and the Ph.D degree from Tshwane Univ. of Technology, Pretoria(SA).
![Table 1: Data on 37 R&D projects from Oral et al [13]](https://thumb-us.123doks.com/thumbv2/123dok_us/9901208.1977552/2.595.55.553.240.612/table-data-on-r-d-projects-from-oral.webp)