International Journal of Scientific Research and Engineering Development-– Volume 2 Issue 5, Sep – Oct 2019 Available at www.ijsred.com
ISSN : 2581-7175 ©IJSRED: All Rights are Reserved Page 355
Development of Fuzzy Logic Models for the Predection of
Weld Bead Geometry in Pulsed Gas Metal ARC Welding
a
Donka Demudu,
bPenta Shreeni vasarao
a
M.Tech student sanketika vidya parishad engineering college
b
Associateprofessor,
Department of mechanical engineering sanketika vidya parishad engineering college
ABSTRACT
The quality of weld joint is influenced by process parameters during the welding process. In order to achieve high quality welds, input process parameters should be controlled. In this investigation four input process parameters such as arc rotational speed, ratio of wire feed rate to travel speed, wire feed rate and eccentricity are considered.The experiments were conducted on square butt joint plate of 5083 H111 aluminium alloy using full factorial design of experiments. Output parameters like bead penetration, bead height, bead width are measured. The fuzzy models for bead penetration, bead height and bead width are developed using fuzzy logic. This fuzzy model has been used for prediction of output parameters. Accuracy analysis of weld bead geometry is also performed.It is observed that % of error is less than 10% in most of the cases for bead height and width and less than 20% for bead penetration.
KEY WORDS; WELDING, 5083 H111 aluminium alloy, fuzzy logic 1. INTRODUCTION
The joining of metals is an important part of the work in many industries. Technicians make use of many different metal joining techniques in order to ensure that the finished parts will possess the required strength. Welding of steel is of particular importance to constructional engineers. Most of the metal fabrication industries have adopted welding procedures as an efficient and economical means of joining two metal pieces permanently.Gas metal arc welding (GMAW), sometimes referred to by its subtypes metal inert gas(MIG) welding or metal active gas (MAG) welding, is a welding process in which an electric arc forms between a consumable and the work piece metal(s), which heats the work piece metal(s), causing them to melt, and join. Along with the wire electrode, a shielding gas feeds through the welding gun, which shields the process from contaminants in the air. The process can be semi-automatic or automatic. A constant voltage, direct current power source is most commonly used with GMAW, but constant current systems, as well as alternating current, can be used. There are four primary methods of metal transfer in GMAW, called globular, short-circuiting, spray, and pulsed-spray, each of which has distinct properties and corresponding advantages and limitations.Originally developed for welding aluminum and other non-ferrous materials in the 1940s, GMAW was soon applied to steels because it provided faster welding time compared to other welding processes. The cost of inert gas limited its use in steels until several years later, when the use of semi-inert gases such as carbon dioxide became common. Further developments during the 1950s and 1960s gave the process more versatility and as a result, it became a highly used industrial process. Today, GMAW is the most common industrial welding process, preferred for its versatility, speed and the relative ease of adapting the process to robotic automation. Unlike welding processes that do not employ a shielding gas, such as shielded metal arc welding, it is rarely used outdoors or in other areas of air volatility. A related process, flux cored arc welding, often does not use a shielding gas, but instead employs an electrode wire that is hollow and filled with flux.
ISSN : 2581-7175 ©IJSRED: All Rights are Reserved
Fig.1.1
(1) Weldingtorch (2)Workpiece, (3) Powersource, LITERATURE REVIEW
It has been observed that many researchers have developed mathematical models and applied soft computing techniques eg. neural networks, neuro-fuzzy approach, genetic algorithm etc. for prediction of the weld bead geometry.Chan et al. (1999) developed the artificial neural network model for prediction the weld geometry. al. (2000) presented multiple regression analysis and artificial neural network for the prediction of back geometry. The input process parameters considered are arc current, welding voltage and welding speed. (2002) attempted an intelligent algorithm to understand relatio
and to predict process parameters on bead height through a neural network and multiple regression methods for robotic multi-pass welding process. Kim et al. (2003) reported mathematical models for the sel
parameters and the prediction of weld bead geometry. welding voltage and welding speed. Lee et al. (2006)
and identified the system’s parameters. The sliding surface is used as the input variable to reduce the number of fuzzy reasoning rules, in comparison with the conventional two
Palani et al. (2006) derived a mathematical model for the prediction of weld bead geometry and process parameters. It consists a three factor, five level factorial design for 317L flux cored stainless steel wire with IS:2062 structural steel as base plate. Carrino et al. (2007) applied neuro
and prediction of the weld bead geometry. This paper focuses on a study carried out in order to increase productivity in gas metal arc welding (GMAW)
reach this aim, a possible solution was found in developing an adaptive system that is able to control and keep the wire feed speed constant at a desired and optimal value. This control h
opportune variable typical of the welding process; in this case, the attention was focused on the welding current intensity whose elements were determined by training an artificial neural network (ANN) with experimenta obtained from bead on plate weld.
Manonmani et al. (2007) developed mathematical equations using a three factor 5
technique to predict the geometry of weld bead in butt joint of austenitic stainless steel 304 sheet of 2.5 mm thickness plate Ganjigatti et al. (2008) Studied modeling of the MIG welding process using statistical approaches. In this paper, an attempt is made to determine input
regression analysis based on the data collected as per full
welding parameters and their interaction terms on different responses have been analyzed using statistical methods. Both linear as well as nonlinear regression analyses are employe
results of these regression techniques are compared and some concluding remarks are made. developed multiple regression analysis for the prediction of weld bead geometry.
considered are wire feed rate, plate thickness, pulse frequency, pulse current magnitude, and travel speed.
Siva et al. (2009) attempted a genetic algorithm (GA) to optimize the process parameters for achieving the desired bead geometry variables. This paper highlights the development of such mathematical equations using multiple regression analysis, correlating various process parameters to weld bead geometry in PTA hard facing and
©IJSRED: All Rights are Reserved
Fig.1.1 MAW Circuit diagram.
Powersource, (4) Wirefeedunit,(5) Electrode source, (6)
It has been observed that many researchers have developed mathematical models and applied soft computing fuzzy approach, genetic algorithm etc. for prediction of the weld bead Chan et al. (1999) developed the artificial neural network model for prediction the weld geometry.
gression analysis and artificial neural network for the prediction of back The input process parameters considered are arc current, welding voltage and welding speed.
an intelligent algorithm to understand relationships between process parameters and bead height, and to predict process parameters on bead height through a neural network and multiple regression methods for
Kim et al. (2003) reported mathematical models for the sel
parameters and the prediction of weld bead geometry. The input process parameters considered are arc current, Lee et al. (2006) developed mathematical model of the welding control system and identified the system’s parameters. The sliding surface is used as the input variable to reduce the number of fuzzy reasoning rules, in comparison with the conventional two-dimensional fuzzy logic control(FLC) algorithm. Palani et al. (2006) derived a mathematical model for the prediction of weld bead geometry and process parameters. It consists a three factor, five level factorial design for 317L flux cored stainless steel wire with Carrino et al. (2007) applied neuro-fuzzy methods for increasing productivity and prediction of the weld bead geometry. This paper focuses on a study carried out in order to increase productivity in gas metal arc welding (GMAW) processes by optimizing the deposition rate of the filler metal. To reach this aim, a possible solution was found in developing an adaptive system that is able to control and keep the wire feed speed constant at a desired and optimal value. This control has been accomplished by regulating an opportune variable typical of the welding process; in this case, the attention was focused on the welding current intensity whose elements were determined by training an artificial neural network (ANN) with experimenta
Manonmani et al. (2007) developed mathematical equations using a three factor 5
technique to predict the geometry of weld bead in butt joint of austenitic stainless steel 304 sheet of 2.5 mm Ganjigatti et al. (2008) Studied modeling of the MIG welding process using statistical approaches. In this paper, an attempt is made to determine input-output relationships of the MIG welding process by using a collected as per full-factorial design of experiments. The effects of the welding parameters and their interaction terms on different responses have been analyzed using statistical methods. Both linear as well as nonlinear regression analyses are employed to establish the
input-results of these regression techniques are compared and some concluding remarks are made.
developed multiple regression analysis for the prediction of weld bead geometry. The input process pa considered are wire feed rate, plate thickness, pulse frequency, pulse current magnitude, and travel speed.
Siva et al. (2009) attempted a genetic algorithm (GA) to optimize the process parameters for achieving the This paper highlights the development of such mathematical equations using multiple regression analysis, correlating various process parameters to weld bead geometry in PTA hard facing and
Page 356
(6) Shielding gas supply
It has been observed that many researchers have developed mathematical models and applied soft computing fuzzy approach, genetic algorithm etc. for prediction of the weld bead Chan et al. (1999) developed the artificial neural network model for prediction the weld geometry. Lee et gression analysis and artificial neural network for the prediction of back-bead The input process parameters considered are arc current, welding voltage and welding speed. Kim et al. nships between process parameters and bead height, and to predict process parameters on bead height through a neural network and multiple regression methods for Kim et al. (2003) reported mathematical models for the selection of process The input process parameters considered are arc current, developed mathematical model of the welding control system and identified the system’s parameters. The sliding surface is used as the input variable to reduce the number of gic control(FLC) algorithm. Palani et al. (2006) derived a mathematical model for the prediction of weld bead geometry and process parameters. It consists a three factor, five level factorial design for 317L flux cored stainless steel wire with fuzzy methods for increasing productivity and prediction of the weld bead geometry. This paper focuses on a study carried out in order to increase processes by optimizing the deposition rate of the filler metal. To reach this aim, a possible solution was found in developing an adaptive system that is able to control and keep the as been accomplished by regulating an opportune variable typical of the welding process; in this case, the attention was focused on the welding current intensity whose elements were determined by training an artificial neural network (ANN) with experimental data,
Manonmani et al. (2007) developed mathematical equations using a three factor 5- level factorial technique to predict the geometry of weld bead in butt joint of austenitic stainless steel 304 sheet of 2.5 mm Ganjigatti et al. (2008) Studied modeling of the MIG welding process using statistical approaches. output relationships of the MIG welding process by using factorial design of experiments. The effects of the welding parameters and their interaction terms on different responses have been analyzed using statistical methods. -output relations. The results of these regression techniques are compared and some concluding remarks are made. Rao et al. (2009) The input process parameters considered are wire feed rate, plate thickness, pulse frequency, pulse current magnitude, and travel speed.
International Journal of Scientific Research and Engineering Development-– Volume 2 Issue 5, Sep – Oct 2019 Available at www.ijsred.com
ISSN : 2581-7175 ©IJSRED: All Rights are Reserved Page 357 nickel-based alloy over stainless steel 316 L plates. The experiments were conducted based on a five factor, five level central composite rotatable design matrix. A genetic algorithm (GA) was developed to optimize the process parameters for achieving the desired bead geometry.
Kannan et al. (2010) presented mathematical models to predict clad bead geometry and its shape relationships of austenitic stainless steel claddings deposited by gas metal arc welding process. Acaroglu et al. (2011) applied fuzzy logic models for selection of proper tunnel boring machine and optimization of design parameters and prediction of their performance of rolling forces of disc cutters. These disc cutters are used for determination of thrust, torque and power requirement of TBMs as well as prediction of their performance. Kumar et al. (2011) developed arc rotation mechanism and developed nonlinear regression models for the prediction of weld bead geometry. The input process parameters considered are arc rotational speed, ratio of wire feed rate to travel speed, wire feed rate and eccentricity.
3.1 Experiment procedure
Figure 3.1 and Figure 3.2 represent a schematic diagram of the experimental setup and a photograph of the corresponding arc rotation mechanism systemrespectively.
Fig.3.1 Experimental Setup Fig.3.2 Arc rotation mechanism
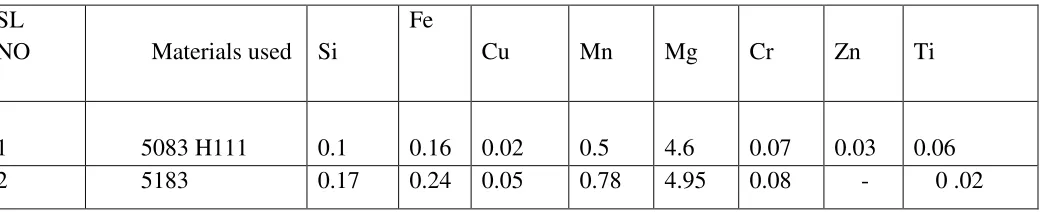
Table 3.1 Chemical composition of materials Element weight%
SL
NO Materials used Si
Fe
Cu Mn Mg Cr Zn Ti
1 5083 H111 0.1 0.16 0.02 0.5 4.6 0.07 0.03 0.06
2 5183 0.17 0.24 0.05 0.78 4.95 0.08 - 0 .02
ISSN : 2581-7175 ©IJSRED: All Rights are Reserved Page 358
3.2 Input parameters
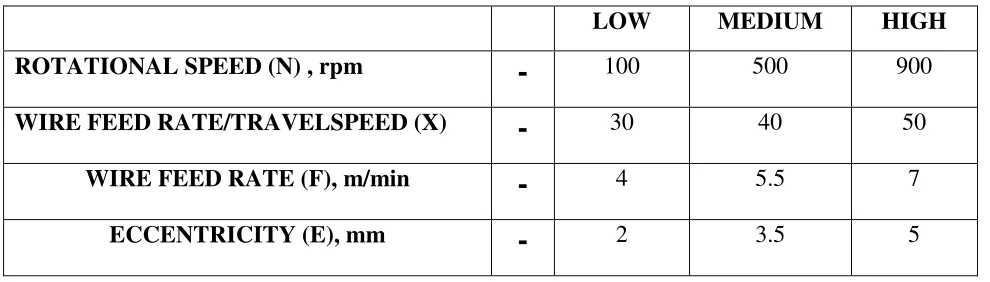
The four input process parameters considered for conducting the experiments were identified. They are arc rotational speed (N), ratio of wire feed rate to travel speed (F/S), wire feed rate (F) and eccentricity (E). A large number of trial experiments are conducted with the square butt joint plate by varying one of the process parameters while keeping remaining parameters at constant value, to find the proper range of the process parameters. The selected values of the process parameters together with their units and notations are given in Table 3.2. The experiments are conducted using full factorial design of experiment (Montgomery, D. C., 2006). As per this technique, total numbers of experiments considered for conducting the experiments are 34=81 as there are four input process parameters each at three levels. The levels for input process parameters were considered based on the preliminary studies conducted.
Table 3.2 Input Parameters and their limits
Input parameters Units Notation
Factors levels low medium high
Arc Rotational speed Rpm N 100 500 900
Wire feed rate/travel speed X 30 40 50
Wire feed rate m/min F 4 5.5 7
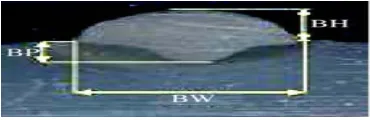
3.3 Measuring the dimensions of bead geometry
Fig.3.3 Weld Bead after Macro-Etchin
3.4 Dimensions of weld bead geometry Table 3.3 Dimensions of weld bead geometry
EXP NO
N rpm
X F
m/min E Mm
Penetration mm
Height mm
Width mm
1 100 30 4 2 1.01 4.24 10.5
International Journal of Scientific Research and Engineering Development-– Volume 2 Issue 5, Sep – Oct 2019 Available at www.ijsred.com
ISSN : 2581-7175 ©IJSRED: All Rights are Reserved Page 359
3 900 30 4 2 0.67 3.5 12.34
4 100 40 4 2 1.21 4.75 11.18
5 500 40 4 2 0.85 4.53 13.11
6 900 40 4 2 0.75 4.15 13.91
7 100 50 4 2 1.51 5.51 12.75
8 500 50 4 2 1.01 4.92 14.03
9 900 50 4 2 0.85 4.81 14.93
10 100 30 5.5 2 2.91 4.05 10.52
11 500 30 5.5 2 2.22 3.95 11.69
12 900 30 5.5 2 1.41 3.84 12.81
13 100 40 5.5 2 3.16 4.85 12.02
14 500 40 5.5 2 2.5 4.8 13.73
15 900 40 5.5 2 1.88 4.54 15.06
16 100 50 5.5 2 3.93 5.63 13.41
17 500 50 5.5 2 2.78 5.38 15.04
18 900 50 5.5 2 2.35 5.2 15.59
19 100 30 7 2 5.35 4.1 13.2
20 500 30 7 2 5.89 4.02 13.06
FUZZY LOGIC METHOD
4.1.1 Fuzzy inference system
4.1.2 A Fuzzy Inference System (FIS) is a way of mapping an input space to an output space using fuzzy logic. A FIS tries to formalize the reasoning process of human language by means of fuz Mathematical concepts within fuzzy reasoning are very simple.
ISSN : 2581-7175 ©IJSRED: All Rights are Reserved Page 360 4.2 DEVELOPMENT OF FUZZY MODEL FOR PREDICTION OF BEAD WIDTH
Procedure
1. Open fuzzy tool page on command box.
2. Four input parameters such as rotational speed (N), ratio of wire feed rate to travel speed (F/S), wire feed rate (F) and eccentricity (E) has been considered.
3. Output parameters are bead width, height and bead penetration.
4. Input parameters values are entered individually. FIS page was opened click edit and again click add variable, the four input variables individually given.
5. The same procedure is repeated for the output variable variable also.
6. Double click the first input variable give the range of the membership values and give the names of the values like as low, medium, high.
7. Same procedure for the remaining three input variables.
8. Open output variable give the range of the membership value. Membership values of output variable divided in to nine equal parts. Names of values is below low (L1), Low (L2), above low (L3),below medium
(M1), Medium (M2), abovemedium (M3), below high (H1), High (H2), above high (H3) are given.
9. Form the total 81 rules of input to output variables.
10. Click the view on view ruler page and click the rules. Open rule viewer page give the input values in left side of the input ranges automatically shows the predicted values.
Same procedure for the remaining output variables of bead height and penetration
OUTPUT VARIABLES MEMBERSHIP FUNCTIONS
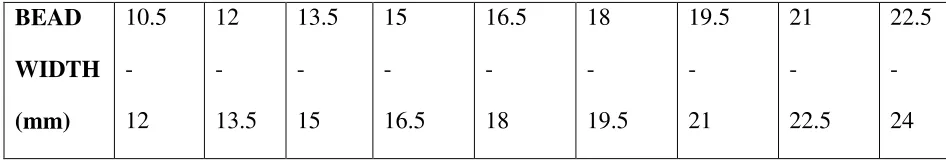
Membership functions of output variable range of bead width,Below low (L1), Low (L2), Above low (L3),Below
medium (M1), Medium (M2), Above medium (M3), Below high (H1), High (H2), Above high (H3).
Table 4.2 Output variable range of bead width BL
(L1)
L (L2)
AL (L3)
BM (M1)
M (M2)
AM (M3)
BH (H1)
H (H2)
AH (H3)
LOW MEDIUM HIGH
ROTATIONAL SPEED (N) , rpm
-
100 500 900WIRE FEED RATE/TRAVELSPEED (X)
-
30 40 50WIRE FEED RATE (F), m/min
-
4 5.5 7International Journal of Scientific Research and Engineering Development-– Volume 2 Issue 5, Sep – Oct 2019 Available at www.ijsred.com
ISSN : 2581-7175 ©IJSRED: All Rights are Reserved Page 361 BEAD
WIDTH (mm)
10.5
-
12
12
-
13.5
13.5
-
15
15
-
16.5
16.5
-
18
18
-
19.5
19.5
-
21
21
-
22.5
22.5
-
24
Error Analysis of Bead Width (W)
Table 4.3 Error Analysis of Bead Width (W)
EXP NO
EXPERIMENT VALUES
PREDICTED VALUES
% OF ERRORS
1 10.5 11.1 -9.60
2 11.5 11.1 3.60
3 12.34 12.7 -2.83
4 11.18 11.1 0.72
5 13.11 12.7 3.23
6 13.91 14.2 -2.04
7 12.75 12.7 0.39
8 14.03 14.2 -1.20
9 14.93 14.2 5.14
10 10.52 11.1 -5.23
11 11.69 11.1 5.32
12 12.81 12.7 0.87
13 12.02 12.7 -5.35
14 13.73 14.2 -3.31
15 15.06 15.8 -4.68
ISSN : 2581-7175 ©IJSRED: All Rights are Reserved Page 362
17 15.04 15.8 -4.83
18 15.59 15.8 -1.33
19 13.21 12.7 4.02
20 13.06 12.7 2.83
4.3 DEVELOPMENT OF FUZZY MODEL FOR PREDICTION OF BEAD HEIGHT
Table 4.4 Input variables of bead height
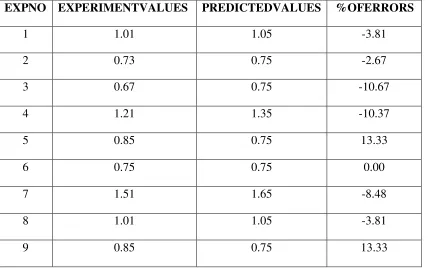
Error Analysis of Bead Penetration (P)
Table 4.9 Error Analysis of Bead Penetration (P)
EXPNO EXPERIMENTVALUES PREDICTEDVALUES %OFERRORS
1 1.01 1.05 -3.81
2 0.73 0.75 -2.67
3 0.67 0.75 -10.67
4 1.21 1.35 -10.37
5 0.85 0.75 13.33
6 0.75 0.75 0.00
7 1.51 1.65 -8.48
8 1.01 1.05 -3.81
9 0.85 0.75 13.33
LOW MEDIUM HIGH
ROTATIONAL SPEED (N) , rpm
-
100 500 900WIRE FEED RATE/TRAVELSPEED (X)
-
30 40 50WIRE FEED RATE (F), m/min
-
4 5.5 7International Journal of Scientific Research and Engineering Development-– Volume 2 Issue 5, Sep – Oct 2019 Available at www.ijsred.com
ISSN : 2581-7175 ©IJSRED: All Rights are Reserved Page 363
10 2.91 3.15 -7.62
11 2.22 2.45 -9.39
12 1.41 1.35 4.44
13 3.16 3.15 0.32
14 2.5 2.45 2.04
15 1.88 1.95 -3.59
16 3.93 3.85 2.08
17 2.78 2.45 13.47
18 2.35 2.45 -4.08
19 5.35 5.25 1.90
20 3.89 3.85 1.04
RESULTS AND DISCUSSION
The fuzzy model has been developed with the experimental results for predicting the bead width, height and penetration. In this work, FIS Modeling was used to validate with experimental results for given conditions. It has been found that results generated by the designed fuzzy model are close to the experimental results with good accuracy.
1. It is observed from that Figure 5.1 % of error is less than 6%positive and less than 9% negative in bead width
2. It is observed from that Figure 5.2 scatter diagram of bead width shows the close to the experimental results with good accuracy.
3. It is observed from that Figure 5.3 % of error is less than the 7% positive and less than 8% negative in bead height.
4. It is observed from that Figure 5.4 scatter diagram of bead height shows the close to the experimental results with good accuracy.
5. It is observed from that Figure 5.5 % of error is less than 20% positive and less than 20% negative in bead penetration.
6. It is observed from that Figure 5.6 scatter diagram of bead penetration shows the close to the experimental results with good accuracy
REFERENCES
ISSN : 2581-7175 ©IJSRED: All Rights are Reserved Page 364 2. Chan, B., Pacey, J., Bibby, M., “Modelling gas metal arc weld geometry using artificial neural network
technology”, Canadian Metallurgical Quarterly, Vol.38 No. 1, pp.43-51, 1999.
3. Carrino, L., Natale, U., Nele, L., Sabatini, M.L., Sorrentino, L., “A neuro-fuzzy approach for increasing productivity in gas metal arc welding”, International Journal Advanced Manufacturing Technology, Vol.32, pp.459–467, 2007.
4. Ganjigatti, J. P., Pratihar, D. K., Roy Choudhury, A., “Modeling of the MIG welding process using statistical approaches”, International Journal Advanced Manufacturing Technology, Vol.35, pp.1166– 1190, 2008.
5. Kannan, T., Yoganandh, J., “Effect of process parameters on clad bead geometry and its shape relationships of stainless steel claddings deposited by GMAW”, International Journal Advanced Manufacturing Technology, Vol.47, pp.1083-1095, 2010.
6. Kim, I.S., Son, J.S., Park, C.E., Lee, C.W., Prasad, Y.K.D.V., “A study on prediction of bead height in robotic arc welding using a neural network”, Journal of Material. Process Technology, Vol.130-13, pp.229-234, 2002.
7. kim, I.S., Son, K.J., Yang, Y.S., Prasad, Y.K.D.V., “Sensitivity analysis for process parameters in GMA welding processes using a factorial design method”, International Journal of Machine Tools & Manufacturing, Vol.43, pp.763-769, 2003.
8. Lee, C.Y., Pi-Cheng, T., Wen-Hou, C., “Adaptive fuzzy sliding modecontrol for an automatic arc welding system”, International Journal Advanced Manufacturing Technology, Vol.29, pp.481-489, 2006.
9. Lee, j.i., K.W. U.m., “A prediction of welding process parameters by prediction of back-bead geometry”, Journal of Material Process Technology, Vol.108, pp.108-113, 2000.
10. Montgomery, D. C., “Design and analysis of experiments”, 5th ed., Wiley, New York, pp.367-372, 2006. 11. Manonmani, K., Muruga, N., Buvanasekaran, G., “Effects of process parameters on the bead geometry of
laser beam butt welded stainless steel sheets”, International Journal Advanced Manufacturing Technology, Vol.32, pp.1125–1133, 2007.