M E T H O D O L O G Y A R T I C L E
Open Access
A next-generation sequencing method for
overcoming the multiple gene copy problem in
polyploid phylogenetics, applied to
Poa
grasses
Philippa C Griffin
1*, Charles Robin
1and Ary A Hoffmann
1,2Abstract
Background:Polyploidy is important from a phylogenetic perspective because of its immense past impact on evolution and its potential future impact on diversification, survival and adaptation, especially in plants. Molecular population genetics studies of polyploid organisms have been difficult because of problems in sequencing multiple-copy nuclear genes using Sanger sequencing. This paper describes a method for sequencing a barcoded mixture of targeted gene regions using next-generation sequencing methods to overcome these problems. Results:Using 64 3-bp barcodes, we successfully sequenced three chloroplast and two nuclear gene regions (each of which contained two gene copies with up to two alleles per individual) in a total of 60 individuals across 11 species of AustralianPoagrasses. This method had high replicability, a low sequencing error rate (after appropriate quality control) and a low rate of missing data. Eighty-eight percent of the 320 gene/individual combinations produced sequence reads, and >80% of individuals produced sufficient reads to detect all four possible nuclear alleles of the homeologous nuclear loci with 95% probability.
We applied this method to a group of sympatric Australian alpinePoaspecies, which we discovered to share an allopolyploid ancestor with a group of AmericanPoaspecies. All markers revealed extensive allele sharing among the Australian species and so we recommend that the current taxonomy be re-examined. We also detected hypermutation in thetrnH-psbA marker, suggesting it should not be used as a land plant barcode region. Some markers indicated differentiation between Tasmanian and mainland samples. Significant positive spatial genetic structure was detected at <100 km with chloroplast but not nuclear markers, which may be a result of restricted seed flow and long-distance pollen flow in this wind-pollinated group.
Conclusions:Our results demonstrate that 454 sequencing of barcoded amplicon mixtures can be used to reliably sample all alleles of homeologous loci in polyploid species and successfully investigate phylogenetic relationships among species, as well as to investigate phylogeographic hypotheses. This next-generation sequencing method is more affordable than and at least as reliable as bacterial cloning. It could be applied to any experiment involving sequencing of amplicon mixtures.
Background
Polyploid species are numerous and economically important. Cycles of polyploidization and diploidization have recurred throughout the evolutionary history of eukaryotes [1,2], such that many eukaryotic species pos-sess more than the two chromosome sets expected in a diploid. There are polyploid animals, fungi and protists
[3,4], but polyploidization has been especially prevalent in flowering plants. The entire angiosperm lineage underwent at least one round of ancient polyploidization early in its evolution [2]. Many family- or lineage-speci-fic polyploidization events have occurred since then (examples reviewed in [5]), and most of our main food and economic crop species are recent polyploids, includ-ing cotton, bread wheat, maize, potatoes, brassicas, bananas, tobacco and coffee [6,7].
Polyploidization is often associated with genome plas-ticity. Chromosomal rearrangements, new transposable
* Correspondence: [email protected]
1
Department of Genetics, University of Melbourne, Parkville 3010, Victoria, Australia
Full list of author information is available at the end of the article
element activity, DNA mutation, duplicate gene deletion, gene expression and epigenetic changes are commonly observed with polyploid formation [2,5,6,8]. Polyploidy maintains higher levels of heterozygosity in a popula-tion, reducing the occurrence of inbreeding depression, although mutant alleles accumulate in polyploid popula-tions more quickly than in diploids [4]. Polyploids can also adapt faster than diploids as long as beneficial mutant alleles are not masked too strongly by wild-type alleles [4]. Each polyploidization event combines genes in novel ways, potentially producing a lineage with new phenotypes, capable of surviving and adapting to envir-onments outside the range of its parent lineages [5,9,10]. Thus polyploidization may be a vital mechanism for adaptation to rapidly-changing environments, such as those expected under anthropogenic climate change.
Practical difficulties have limited our current under-standing of polyploid evolution, diversification and popu-lation dynamics. Nuclear DNA sequence is the most informative data source for phylogenetic inference. Haploid organellar sequence data can be useful, but nuclear regions must be included to obtain multiple unlinked markers. These are necessary where the evolu-tionary history of a lineage is complicated by incomplete lineage sorting or hybridization, because a single marker has a low probability of predicting the true evolutionary tree [11-14]. Nuclear sequence data are often useful in investigating complex evolutionary histories [15-17]. Since polyploids contain multiple distinct copies of each nuclear gene, known as homeologues, it is usually impos-sible to amplify a homogeneous, single amplicon using PCR. DNA sequencing by the Sanger method can only be performed on a single pure amplicon. If more than one copy is amplified with a particular PCR primer pair, direct sequencing will give double peaks at sites that dif-fer within and between homeologues, and the phase of many such double peaks can not be determined. Further-more, if there are insertion-deletion polymorphisms (indels) that distinguish between the copies, then direct sequencing will fail because all sites after an indel will be undecipherable double peaks. The resulting practical dif-ficulties with gene sequencing have been well documen-ted [13,16,18].
Several approaches have been used to overcome this problem, but all have drawbacks, in terms of the extra time and cost associated with each method compared to similar work in diploid or haploid taxa. Many researchers have used bacterial cloning to separate gene copies [17,19,20]. This is time-consuming and expensive, mean-ing that few individuals and few genes are investigated. A single species is often represented by a single individual [17,20,21], which may be adequate for investigating the hybrid origins of species [20], but not for investigating intraspecific variation. Comparisons based on individuals
may also lead to the wrong conclusion about the evolu-tionary history of related taxa, due to undetected incom-plete lineage sorting and/or reticulate evolution [11]. Other researchers have designed primers specific to each known homeologue of a multi-copy nuclear gene [16,22], but this method requires extensive preliminary experimen-tation in poorly-characterized species [13,22,23]. It may also be unsuitable for autopolyploids or some allopolyploid genes for which good distinguishing primers cannot be designed. In some studies, DNA is extracted from a mix-ture of individuals from a single population [24], but this might not accurately estimate the frequency of alleles in a population, as preferential PCR amplification may occur.
Here we describe a new method that uses the capacity of next-generation sequencing technologies to sequence mixtures of DNA rather than pure PCR products. We sequence multiple gene copies, multiple genes, and mul-tiple individuals in a single run, using barcoded samples. Our method demonstrates the utility of 454 sequencing for phylogenetic inference in a group of polyploid grasses that seem to have evolved under a recent, rapid radiation. It could be applied to any experimental design that aims to sequence amplicon mixtures from many independent samples.
Study species
Tussock grasses in the genusPoa(Poaceae) dominate the alpine communities of the Australian Alps. These grasses were initially lumped asPoa australisR. Br. orP. caespi-tosaForst. f., despite variation in morphology and habitat associations [25]. More recently, approximately 50 Austra-lianPoataxa have been described [25], about 12 of which occur in the alpine and/or subalpine region [25,26]. The genusPoahas long been regarded as taxonomically diffi-cult [21,27,28] and even viewed as a massive polyploid complex [29]. The taxonomy of the Australian alpine species is also considered to be imperfect [25,26].
Initial results from a pilot study using microsatellite markers, chloroplast non-coding DNA and nuclear regions amplified in 25 herbarium specimens indicated that thesePoaspecies are tetraploid. This was consistent with evidence from a previous study by Pattersonet al.
[21] that found two copies of each of the two nuclear genes analyzed in a range of Poa species, and with the very common occurrence of polyploidy in the entire grass family [9].
Results
Sequencing results
(mean ± 1 s.d. = 278 ± 153 bp). Approximately 111,200 (92%) of these reads were successfully matched to one of the gene region primer sequences (Figure 1A). After barcode deconvolution and quality control 70,601 reads remained (Figure 1B).
The barcode success rate was checked using a subset of therpl32-trnL reads. Of the 3,448 reads matching at least one of the amplicon primer sequences, 2,732 exhibited the desired amplicon primer + 3-bp barcode + checksum base and so were matched to an individual. A further 656 reads failed to match the amplicon primer + barcode sequence either because they were trimmed at the Adap-ter A end (through fragmentation afAdap-ter the initial PCR, or through sequencing error) or because of sequencing error(s) in the primer region. Only 60 reads (2.0%) were rejected because of checksum base problems, and these were usually because of a missing checksum base rather than an incorrect base call. All mismatches were dis-carded during the barcode deconvolution process.
After quality control, sequence error rate was estimated as the percentage of single-base mutations in therpl
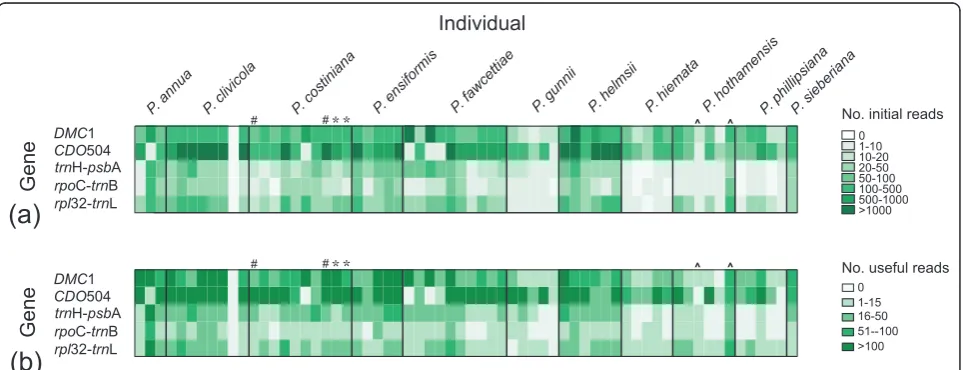
32-trnL region within individuals and was found to be approximately 0.13% (see Methods). Despite efforts to include equal amounts of PCR product for each chloro-plast region/individual combination (and four times that amount for each nuclear gene/individual combination), read numbers varied across genes and individuals and showed some species-specific patterns (Figure 1).
Individual success
Useful sequence (≥1 read per individual) was obtained for 281 out of 320 (88%) of gene/individual combinations
(Figure 1B). The resulting sequences are available in GenBank [30] (accession numbers [HQ542308-HQ542469 and HQ594198-HQ594464]). Eight (21%) of the unsuc-cessful samples dropped out or showed very weak amplifi-cation (<4 ng/μl product) at the PCR stage. The rest of the unsuccessful gene/individual combinations appeared to amplify successfully, but failed at the sequencing stage. Most of these involved a chloroplast region and we sus-pect that they failed because insufficient PCR product was included to ensure useful sequence reads. One sample (a
P. clivicolaindividual) produced no sequence reads for any gene. This does not seem to be a barcode-related pro-blem, because the same barcode was successful in another experiment (CRet al., unpublished work). It probably resulted from experimental error (for example, failure to include this individual in the final amplicon mixture).
Achieving sufficient sequence reads
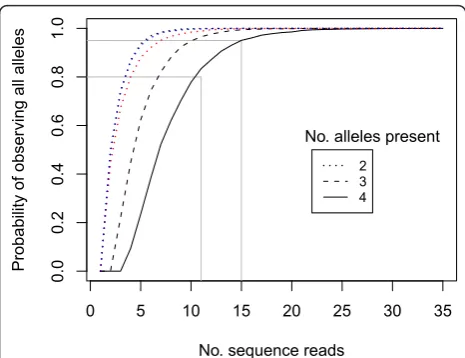
For the chloroplast regions, a single read per individual provided sufficient sequence information, since these regions were single-copy. For the nuclear genes, how-ever, up to four alleles were expected per region (two gene copies with up to two alleles each). Calculating the number of reads required to obtain all existing alleles is an example of the‘Inverse Coupon Collector’s Problem’ in probability theory [31] and was previously modelled by Joly et al.[32]. We simulated the cases of two, three and four existing alleles, assuming that all alleles were amplified evenly, and repeated the simulation 10,000 times for each number of sequence reads (Figure 2). These analyses suggest that at least 15 reads are needed to be 95% sure that all four alleles are sequenced.
Gene
rpl32-trnL
rpoC-trnB
trnH-psbA
CDO504
DMC1 No. useful reads0
1-15 16-50 51--100 >100 Individual
Gene
0 1-10 10-20 20-50 50-100 100-500 500-1000 >1000 * *
P. annua P. clivicola P. costiniana P. ensiformis P. fawcettiae P. gunnii P. helmsii P. hiemata P. hothamensisP. phillipsianaP. sieberiana
rpl32-trnL
rpoC-trnB
trnH-psbA
CDO504
DMC1 # #
No. initial reads
^ ^
(a)
(b)
* * #
# ^ ^
We then wanted to check whether the assumption of equal read proportions for each allele was justified. To do this, we regressed the number of copy B sequence reads against the number of copy A sequence reads for each nuclear gene, with the regression forced through the origin (0, 0). A t-test was used to discover whether the regression slope (the B:A ratio) was significantly dif-ferent from 1 for both nuclear genes. For the CD0504 gene the mean ratio of B copies to A copies was 1.87 ± 0.23 (t55 = 3.77; P< 0.001). For theDMC1 gene there
were also more B copies with a mean ratio of 1.29 ± 0.11 (t 60= 2.64; P < 0.01). Using these ratios in the
simulation algorithm we found that five to seven reads were required to be 95% confident that both copies had been sequenced (Figure 2).
Repeatability
The procedures were repeated (from the DNA extrac-tion stage onwards) for three individuals (twoP. costini-ana and one P. hothamensis), with repeats barcoded separately to test the accuracy and repeatability of the entire process. The two repeated P. costiniana indivi-duals showed identical alleles at the level of stringency chosen here (≥2 bp difference required to assign differ-ent alleles), except for one low-frequency extra DMC1 Copy A allele that was found in one individual but not its repeat (Figure 3). On examination, this apparent extra allele probably resulted from a PCR error as it was identical to the other allele except for a unique 2 bp
insertion. For the repeatedP. hothamensis individual, one repeat produced consistently few sequence reads, while the other sequenced well (Figures 1, 3). This was probably due to a low-quality DNA extraction and poor PCR amplification for the first repeat. These two repeats differed by 3 and 2 bp for the DMC1 A and B allele respectively, but the alignments from the first individual were unreliable because they were based on only two sequence reads each (Figure 3). In general, the method was repeatable and accurate when a minimum of 2 bp difference was required (out of approximately 400) to assign different alleles.
PCR Recombination
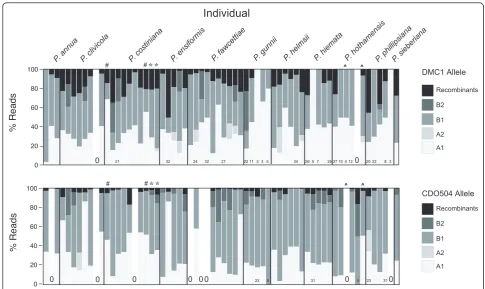
PCR recombination was judged to have resulted in 302/ 10,301 (2.9%) of ‘useful’ reads for CDO504 and 614/ 4,326 (14%) forDMC1. Examining a subset of suspected recombinants in RDP3 [33] supported this judgement (see Methods). At the individual level, recombination frequency (mean ± 1 s.d.) was 3.5 ± 3.6% for CDO504 and 13.6 ± 11.5% forDMC1 (Figure 3).
Polyploidy in nuclear genes
Two distinct copies of each nuclear gene were detected. These were separated by 19 (4.0%) and 35 (8.5%) fixed base differences for DMC1 and CDO504 respectively. Furthermore, there were no shared polymorphisms between the A and B copies for either homologue set. The
DMC1 copies also differed by a 7 bp indel and the CDO504 copies differed by 4 indels 1 to 4 bp in length. No recombination was detected among the two copies for either gene, and the two copies were not in linkage dise-quilibrium (see Methods). For this reason they were trea-ted as separately-evolving, unlinked loci.Poa annuawas the expected outgroup because it is native to Europe, though it is now widespread in Australia. Two distinct copies were also detected in this species and a single
P. annuacopy was included in each alignment as an outgroup.
Coding regions of the nuclear genes were either based directly on GenBank matches (DMC1) or determined using using Artemis and Artemis Comparison Tool (ACT) software [34,35] on an alignment of corn, rice and sorghum sequences from GenBank (GenBank: 226502914, NC_008396 and 239825523, respectively) and representative Poa sequences (CDO504). Coding regions were examined for synonymous and non-synon-ymous mutations, frameshift mutations or stop codons that would render gene copies non-functional in some individuals. Both DMC1 copies had few coding region mutations (DMC1 copy A: one non-synonymous, two synonymous; DMC1 copy B: one non-synonymous, three synonymous). CDO504 copy A exhibited four non-synonymous and six synonymous mutations in the ● ● ●
● ●
● ●
● ●
● ●●
● ●● ● ● ●
● ● ● ● ● ● ● ● ● ● ● ● ● ● ● ● ●
0 5 10 15 20 25 30 35
0.0
0.2
0.4
0.6
0.8
1.
0
No. sequence reads
Probability o
f obser
ving all alleles
2 3 4
No. alleles present
Figure 2Probability of observing all alleles for one nuclear
region vs. number of sequence reads obtained. 10,000 draws
coding region. Overall mutations were rare among indi-viduals for all four gene copies (Tajima’s D <0,P< 0.05 for coding region and overall sequence).
Initially, CDO504 Copy B was detected to have more than two alleles in most individuals, suggesting an extra gene copy was present. Twenty-four percent of all Copy B reads included a 57-bp deletion in the first intron. This‘short’ allele was found in most individuals. These alleles matched Copy B but such a deletion was not detected in any GenBank matches. No secondary struc-ture was detected and so this apparent allele was consid-ered to represent a real gene copy, probably resulting from duplication of CDO504 Copy B. This apparent gene copy was excluded from further analysis but we cannot rule out the possibility that some of the‘long’ Copy B alleles may actually be reassorting at this locus.
Within the ‘long’Copy B coding region, three non-synonymous and four non-synonymous mutations were detected at low frequency (Tajima’s D < 0,P < 0.05 for coding region and overall sequence). Eight individuals had CDO504 copy B alleles with exon insertions that caused frameshift mutations, making the putative pro-tein product non-functional. Since three of these indivi-duals shared a 2-bp insertion, three shared a 5-bp
insertion and two shared a 32-base insertion, individual-specific sequencing errors were unlikely and these inser-tions were considered to be genuine. These frameshift mutations may indicate a loss of function in this gene copy.
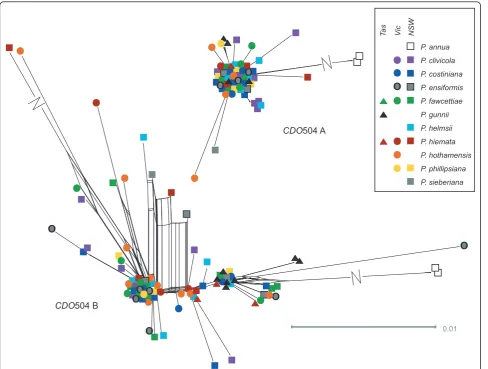
To compare our results to those previously reported for the genusPoa, we built a phylogenetic tree using a subset of the Australian CDO504 copy A and B sequences (spanning the diversity observed in each), along with otherPoaCDO504 sequences obtained from GenBank (see Methods). All of the Australian CDO504 copy A sequences fell within the well-supported sequence class A (as defined by Patterson et al.), and all the CDO504 copy B fell within sequence class C (Figure 4).
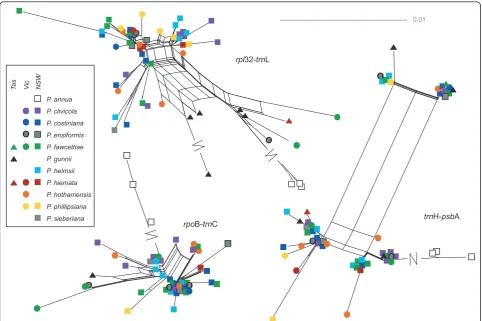
Species differentiation
As expected, the three Poa annuaaccessions formed a clear outgroup to the native Australian species for all gene regions (Figures 5, 6, 7), and most of the parsi-mony-informative sequence variation distinguished
P. annuafrom the rest of the species (Table 1). Among the Australian species, a total of 23 parsimony-informa-tive base changes and 7 informaparsimony-informa-tive insertion-deletion polymorphisms were detected in the chloroplast regions,
Individual
* *
P. annua P. clivicola P. costiniana P. ensiformis P. fawcettiae P. gunnii P. helmsii P. hiemata P. hothamensisP. phillipsianaP. sieberiana #
# ^ ^
% Reads
0 20 40 60 80
100 DMC1 Allele
A1 A2 B1 B2
Recombinants
0
21 32 24 32 27 22 11 235 34 2657 252710412 2023 83
0
0 20 40 60 80 100
A1 A2 B1 B2
Recombinants
CDO504 Allele
% Reads
* * #
# ^ ^
0 0
0 0 0
0 0 0 22 5 31 6 23 31
Figure 3Percentage of useful reads gained for each nuclear gene copy and allele, including recombinant reads. The upper panel shows
and a further 38 base changes and 18 indels in the nuclear regions. By gene region, the chloroplast regions exhibited between 1.8 and 2.7% parsimony-informative variation among the Australian species, and the nuclear regions 1.1 to 5.2%.
No clear, consistent species differentiation was obvious from the genetic distance networks (Figures 5, 6, 7).Poa gunniiappeared somewhat distinct with therpl32-trnL (Figure 5) and CDO504 B (Figure 6) markers, but was significantly differentiated only from two other species,
and only inrpl32-trnL, by a pairwiseFPTcomparison (P. gunniivs.P. clivicolaFPT= 0.39,P< 0.05;P. gunniivs. P. costinianaFPT= 0.44,P< 0.05 after Bonferroni
cor-rection). MostP. clivicolasamples clustered together for bothDMC1 A andDMC1 B (Figure 7), but not for the other gene regions. ForDMC1 B,P. clivicolawas signifi-cantly differentiated fromP. fawcettiae(pairwiseFPT
-0.22,P< 0.05 with Bonferroni correction) but not from any other species. In general, genotypes were shared by individuals of multiple species, and most species 0.02
P. nervosa AY589176
P. arctica AY589152
P. arctica AY589163
P. palustris AY589195 P. annua AY589206 P. helmsii NSW 82 B1
P. clivicola ACT 104 A1
P. arida AY589213 P. ligulata AY589201
P. clivicola ACT 104 B1
P. secunda AY589166
P. nemoralis AY589218 P. secunda AY589164
P. secunda AY589215 P. annua ACT 97 A
P. iberica AY589171 P. nervosa AY589153 P. ensiformis Vic 126 B2
P. hothamensis Vic 191 B2
P. fendleriana AY589154
P. secunda AY589214 P. alpina AY589203
P. compressa AY589200
P. arida AY589191 P. ensiformis Vic 124 B2 P. hiemata NSW 186 B2
P. interior AY589198
P. bulbosa AY589210 P. annua ACT 97 B P. secunda AY589185
P. hothamensis Vic 191 B1
P. sinaica AY589211 P. hiemata NSW 185 B1
P. annua AY589205 P. fendleriana AF249677 P. sieberiana AY589177
P. costiniana NSW 79 B1
P. secunda AY589216 P. iridifolia AY589172
P. arachnifera AY589173
P. fendleriana AY589179
P. bulbosa AY589212 P. fawcettiae NSW 137 B2
P. ensiformis Vic 126 B2
P. supina AY589204 P. trivialis AY589170 P. iridifolia AY589157
P. interior AY589199 P. arctica AY589175
P. sieberiana AY589155
P. arctica AY589167 P. secunda AY589183
P. nemoralis AY589192
Phalaris AY589219
P. secunda AY589165 P. alpina AY589202 P. arida AY589187
P. hothamensis Vic 198 A1
P. arachnifera AY589156 P. gunnii Tas 149 B2 P. arctica AY589174
P. sinaica AY589208 P. compressa AY589188 P. secunda AY589190
P. hybrida AY589162 P. gunnii Tas 149 A1 P. hiemata Vic 188 B2 P. sieberiana AY589178
P. sinaica AY589207 1 / 99
0.96 / 98 1 / 99
1 / 100 1 / 88
0.96 / 61
1 / 100 1 / 88
1 / 100 1 / 99
1 / 100
1 / 93
1 / 98
1 / 100
B
A
Figure 4Phylogenetic tree ofPoaCDO504 sequences. Maximum clade credibility tree made using BEAST [91]: 10,000,000 generations, constant population size, GTR+G model with starting substitution matrix and gamma parameter values chosen in ModelTest 3.7. Nodal support values shown are posterior probabilities/maximum parsimony bootstrap percentages (500 replicates). Only nodes with posterior probabilities ≥0.95 or bootstrap percentages≥80 are shown. Well-supported nodes are also shown with thick lines. Representative sequences from the native Australian species from this study are shaded in grey. Other sequences are from Pattersonet al. [21], downloaded from GenBank, including
were not significantly differentiated by pairwise FPT
comparisons.
Inversional mutations intrnH-psbA
ThetrnH-psbA intergenic spacer produced a very differ-ent network from the other chloroplast regions (Figure 5). The rectangular shape was caused by two small inversions, a 6-bp region and a 2-bp region, which occurred in all four possible combinations with no spe-cies-specific patterns. We suggest this is an example of inversional mutation caused by hairpin secondary struc-ture [36] (see predicted hairpin strucstruc-ture in additional file 1 - Figure S1). The appropriate hairpin structure was predicted using MFold [37], supporting this hypoth-esis. The same 6-bp inversion polymorphism was detected in alignments of multiple Festucaand Lolium
sequences from GenBank. The 2-bp inversion region was extremely polymorphic across many of the Poaceae (see alignment in additional file 1 - Figure S1), and showed intraspecific variation in Puccinellia, Festuca,
DeschampsiaandOryza. In fact, the entire putative hair-pin region exhibited a high degree of variation.
Geographic structure
Two of the chloroplast regions,rpl32-trnL andrpoB-trnC, showed evidence of spatial genetic structure. Significant dissimilarity was seen at the 200 to 300 and 600 to 800 km distance classes: this pattern disappeared when the nian samples were excluded, suggesting that the Tasma-nian-mainland differentiation was responsible (see spatial autocorrelation plots in additional file 2 - Figure S2). For
DMC1 A, low but significant dissimilarity was also seen at the 200 to 300 km distance class (r= -0.077, 95% CI = -0.027 to -0.105), which was strengthened when the Tas-manian samples were excluded (r = -0.089, 95% CI = -0.040 to -0.129). This was not explained by geographic source population (see Methods): no pair of populations was significantly differentiated (AMOVAP> 0.05 after Bonferroni correction).
At a smaller spatial scale, no genetic structure was detected using the nuclear markers, but significant posi-tive structure was detected between 0 to 60 km for
rpl32-trnL (falling to 0 to 30 km when Tasmanian sam-ples were excluded) and 0 to 20 km for rpoB-trnC (see additional file 2 - Figure S2).
rpoB-trnC
0.01
trnH-psbA
rpl32-trnL
Ta
s
P. annua P. clivicola P. costiniana P. ensiformis P. fawcettiae P. gunnii P. helmsii P. hiemata P. hothamensis P. phillipsiana P. sieberiana
Vi
c
NSW
Discussion
Utility of next-generation sequencing
Phylogenetic analysis of polyploid species has typically been problematic, requiring large amounts of time and effort to sequence multiple gene copies in sufficient individuals using traditional Sanger sequencing and bacterial cloning [13,16,18]. However, high-throughput
‘next-generation sequencing’ of barcoded DNA mix-tures is an affordable and successful solution to this problem. This effectively-clonal PCR method is finan-cially viable for any type of mixed DNA sample. Next-generation methods involving sample barcoding have already been applied to a wide variety of bacterial, fun-gal and mixed environmental samples [for example 38, 39], and to multi-copy genes [40], but not to individual taxa containing a mixture of alleles, like polyploids or diploid heterozygotes, though the idea has been sug-gested [41].
In this project we have designed simple barcodes fused to the sequencing adaptors, a different method from those previously suggested [42]. Commercial sequencing facilities typically offer amplicon barcoding using the 10-bp‘multiplex identifiers’suggested by Roche [43]. These services can be expensive, and only 14 multiplex identi-fiers are available [43], limiting the number of samples. The barcode-adapter ligation protocol we describe here is relatively cheap and easy to implement. When sequen-cing an amplicon mixture, the level of barcode accuracy required is lower than that for other applications (gen-ome sequencing projects, for example [44]) because indi-vidual reads with barcode sequencing errors will be detected and discarded in the alignment process. Thus, we suggest that simple 3 to 5 bp barcodes will be suffi-cient for most phylogenetic analyses. Their short length should prevent them from interfering with any stage of the amplification/sequencing process, especially if ligated
0.01
CDO504 A
CDO504 B
Ta
s
P. annua P. clivicola P. costiniana P. ensiformis P. fawcettiae P. gunnii P. helmsii P. hiemata P. hothamensis P. phillipsiana P. sieberiana
Vi
c
NSW
0.01
DMC1 A
DMC1 B
Ta
s
P. annua P. clivicola P. costiniana P. ensiformis P. fawcettiae P. gunnii P. helmsii P. hiemata P. hothamensis P. phillipsiana P. sieberiana
Vi
c
NSW
Figure 7Networks for the twoDMC1 gene copies. All networks created using the NeighbourNet algorithm in SplitsTree 4.11.3 using the EqualAngle layout option, from distance matrices created in Mega 5 (see text for details). Long splits are indicated by a break and not shown to scale.
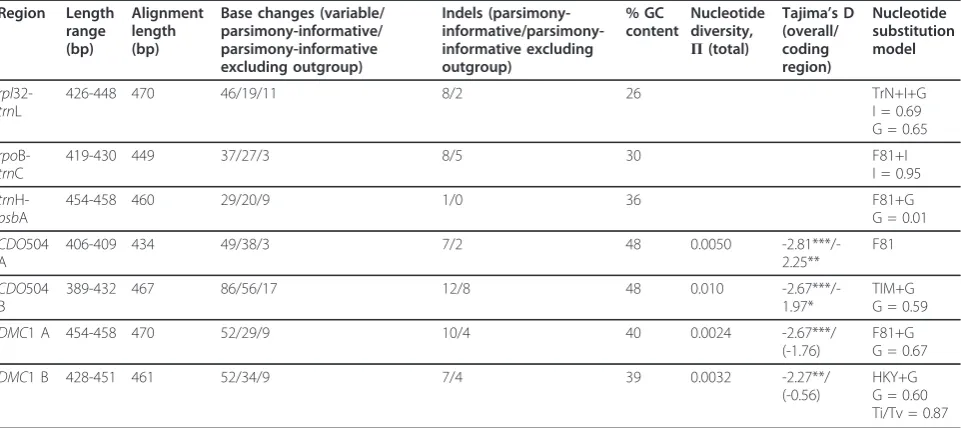
Table 1 Sequence and alignment length, variation and substitution model chosen for each region sequenced
Region Length
range (bp)
Alignment length (bp)
Base changes (variable/ parsimony-informative/ parsimony-informative excluding outgroup)
Indels (parsimony- informative/parsimony-informative excluding outgroup)
% GC content
Nucleotide diversity,
Π(total)
Tajima’s D
(overall/ coding region)
Nucleotide substitution model
rpl
32-trnL
426-448 470 46/19/11 8/2 26 TrN+I+G
I = 0.69 G = 0.65
rpo
B-trnC
419-430 449 37/27/3 8/5 30 F81+I
I = 0.95
trn
H-psbA
454-458 460 29/20/9 1/0 36 F81+G
G = 0.01
CDO504 A
406-409 434 49/38/3 7/2 48 0.0050
-2.81***/-2.25**
F81
CDO504 B
389-432 467 86/56/17 12/8 48 0.010
-2.67***/-1.97*
TIM+G G = 0.59
DMC1 A 454-458 470 52/29/9 10/4 40 0.0024 -2.67***/
(-1.76)
F81+G G = 0.67
DMC1 B 428-451 461 52/34/9 7/4 39 0.0032 -2.27**/
(-0.56)
HKY+G G = 0.60 Ti/Tv = 0.87
after the initial PCR step. Longer barcodes could be designed to identify mixtures of more than the 61 indivi-duals we examined here. Instead of attaching barcodes to the sequencing adapters as we did, it may be more sensi-ble in some cases to synthesise PCR primers with built-in barcodes. In that case, barcoding power could be increased by using both barcoded forward and reverse PCR primers, but this would restrict the length of the sequenced regions, as each region would only be sequenced in one direction. Similar barcodes should also be suitable for other next-generation sequencing meth-ods although distinguishing homeologues may be more difficult with shorter sequence reads such as those pro-duced using the Illumina method. With some creativity and careful study design, appropriate barcodes can be developed to suit any situation.
Researchers accustomed to dealing with individual DNA chromatograms may feel overwhelmed by the large volume of data obtainable from a next-generation sequencing run. However, barcode deconvolution and quality control using the methods we describe here was quick. The entire workflow was completed in under an hour for each gene region. The time bottleneck actually occurred at the alignment and editing stage, which uses the same skills needed for‘traditional’molecular taxon-omy, except that it is applied to larger numbers of sequences.
Sequence success and repeatability
Despite efforts to mix equal amounts of DNA for each individual combination, there were significant differ-ences between initial read numbers between different species. Since we were not interested in the relative abundance of different PCR products, but rather in sequencing all alleles that were present in each indivi-dual for each gene, this was not a problem. Drop-out rate was 12%, comparable to traditional sequencing methods using multiple markers [45]. Since we were able to sequence many more individuals than usual for a phylogenetic analysis, the occasional gene dropout for an individual did not affect our overall results.
Assuming 4 alleles were present at equal frequency in an individual, only 15 sequence reads were required to have a 95% chance of observing all 4 alleles (Figure 2) [32]. This was achieved for 54/64 individuals for CDO504 and 52/64 individuals forDMC1 (Figure 1). Much lower read counts were required to observe all distinct alleles if only two or three alleles were present per individual (Figure 2). This is in broad agreement with the 20 to 40+ clones recommended for sequencing multiple-copy nuclear genes using bacterial cloning [13]. However, we found significantly higher read numbers of copy B in both nuclear genes (copy B read no. 1.9 × copy A for CDO504, 1.2 × copy A forDMC1). This was
despite efforts to reduce preferential amplification as suggested by Smallet al.[13]. Five and seven sequence reads were needed to be confident of obtaining both copies in DMC1 and CDO504, respectively (Figure 2, red and blue lines), which was achieved in 58/64 samples for DMC1 and 54/64 samples for CDO504 (Figure 1).
We argue that the 454 sequencing method is more reliable than bacterial cloning for several reasons. First, cloning bias is avoided. Second, in Sanger sequencing, PCR errors that occur early in the reaction are propa-gated through later cycles, but this should not occur in next-generation sequencing because the sequencing reaction is performed on individual DNA molecules. Therefore sequencing errors are easier to detect in next-generation sequencing read alignments. Third, it is much easier to achieve the required numbers of sequence reads to obtain all alleles: in the past, research-ers have often relied on far fewer clones than the 20 to 40+ recommended [19,22,46] and so missing alleles may be an issue in many phylogenetic studies, especially if preferential copy amplification is common.
PCR-basedin vitrorecombination is often observed in reactions with multiple templates [13,19]. We suspect that most of the PCR recombination we observed occurred in the initial PCR step [21], although it could have also occurred in the adapter-extension PCR step. However, the recombinant alleles were readily identified.
DMC1 showed a higher proportion of recombinant sequences than did CDO504 (13.6% vs 2.9%). We have no clear explanation for this difference.
Allopolyploidy in the Australian alpinePoaspecies Two distinct gene copies were observed for each nuclear gene, differing by 4% and 8.5% (CDO504 andDMC1, respectively). As there was no evidence of recombination between them, we treated them as separately-evolving gene copies. This treatment is appropriate for polyploids. It is thought that homeologues do pair at meiosis in recent autopolyploids, but that most stable polyploid taxa become functionally diploid over time, meaning that gene copies from different ancestral genomes do not recombine [47]. As thesePoaspecies seem to be func-tionally diploid, we would argue that they are relatively
‘old’polyploids. This idea is supported by the fact that the same, identifiable gene copies were identified in all of the native Australian species examined, suggesting that they all evolved from a common allopolyploid ancestor.
B falling within sequence class C (Figure 4). Each of these sequence classes also containedP. arctica,P. nervosa,
P. fendleriana,P. iridifoliaandP. arachnifera, which are mostly restricted to North or South America (P. arctica
is also found in the European Arctic) [48]. Two Austra-lian/New Zealand species were also placed with some of these American species in an earlier study using chloro-plast restriction site data [27]. The diploid progenitors of this Australian/AmericanPoagroup remain to be identi-fied. The lack of resolution within these clades (Figure 4) means we cannot yet determine the geographic pattern of colonization, though it may be similar to that proposed for a related group of grasses, the New Zealand Loliinae, involving long-distance dispersal from North America to New Zealand via South America [49], followed by disper-sal to Australia. We can state with confidence, however, that the Australian alpine species have not undergone polyploidization since colonization of the Alps, but that a polyploidization event took place before the Australian and the American species diverged.
Gene copies resulting from polyploidization often take on distinct functions or lose function [50]. Here we detected very few non-synonymous or synonymous mutations in the coding region of eitherDMC1 copy or CDO504 copy A, indicating that these three loci are probably still functional. Tajima’s D was significantly negative in the introns of all four loci, indicating an excess of rare polymorphisms. This could have resulted from sequencing errors, a selective sweep or a recent population expansion. Sequencing error is unlikely to explain the large number of rare mutations we observed, because our method had a low (0.13%) error rate after quality control, and individual alleles were represented by many sequence reads. We suggest that population expansion is the most likely explanation, either expan-sion after the ancestral hybridization event, or expanexpan-sion to colonize the ‘new’environment of Australia. Sequen-cing this gene in the related New Zealand and American species would help to resolve this issue.
CDO504 copy B showed a different pattern, possessing several frameshift mutations that may render the protein product non-functional. This may indicate a loss of function in copy B, although every individual with an apparently non-functional allele also possessed a func-tional allele. There was also evidence of probable gene duplication in this copy: an allele with a 57-bp intron gap was present in most individuals, but as the gene dynamics were unclear, these alleles were excluded.
Inversional mutation intrnH-psbA
Inversional mutation [36] explains the unusual rectangu-lar network pattern in the trnH-psbA region and this mutation mechanism seems to have occurred through-out the grass family [see additional file 1 - Figure S1].
TrnH-psbA inversions have been reported for other angiosperm families [51-54] but not for grasses, prob-ably because trnL-trnF and other loci are more widely used as phylogenetic markers in the grass family [55-57]. Also, grass phylogenies that have used this mar-ker but only included one individual per species or genus [58,59] would necessarily fail to observe intra-taxon variation. TrnH-psbA has been proposed as a general DNA barcode region for land plants [60]. Our results support the argument thattrnH-psbA is unsuita-ble as a barcode region because of its apparent propen-sity to inversion mutations [51].
Species and geographic structure
The general pattern seen from both the chloroplast and the nuclear genes is one of extensive haplotype sharing between what are currently considered to be different species (Figures 5, 6, 7). The nuclear gene networks showed incongruence both with each other and with the chloroplast gene networks. Nuclear-organellar incongruence is common [18,20,46,61]; incongruence between nuclear genes is less widely reported, but does occur [22]. Both can result from incomplete lineage sorting or hybridization. Either of these processes could be occurring in the Australian alpine Poa species. They may well have resulted from a recent, rapid species radiation maintaining high effective population size, a typical scenario in incomplete lineage sorting [14,62]. Hybridization is also commonly reported within the genusPoa [27,28,63-65] and the entire grass family [9]. Experimental inter-species crosses between some of the species examined did produce viable offspring (Griffin, unpublished). Further work will attempt to distinguish between incomplete lineage sorting and hybridization as an explanation for the lack of species structure observed.
reflecting the source mountain range or broad geo-graphic area and may be a chance result due to sampling bias.
On the local scale, fairly strong spatial genetic structure was detected using two of the chloroplast markers.
Rpl32-trnL found significantly similar genotypes up to 60 km apart, which decreased to 30 km apart when the Tasmanian samples were excluded [see additional file 2 -Figure S2 E-F].RpoB-trnC, which had less genetic varia-tion overall (Table 1), revealed spatial genetic similarity in neighbourhoods of up to 20 km with or without the Tasmanian samples [see additional file 2 - Figure S2 G-H]. No significant local-scale genetic structure was detected with the nuclear markers. Because the chloro-plast is maternally inherited in most angiosperms, these results suggest a smaller neighborhood for seed dispersal than for pollen dispersal. The Australian alpine zone occurs across small, relatively isolated‘sky islands’, and strong spatial genetic structure has been detected in Aus-tralian alpine and montane lizards [70,73,74]. However, it is perhaps not surprising that these alpine grasses lack spatial genetic structure with nuclear markers: they are wind-pollinated, and high population connectivity has been documented in onePoaspecies across mountain-tops approximately 8 kilometres apart [75].
Conclusions
We developed a novel method of barcoding amplicon mixtures from polyploid individuals for 454 sequencing. We successfully sequenced multiple nuclear genes, each with multiple copies and multiple alleles, and also sequenced three single-copy chloroplast regions, all in 64 individuals representing 11 species. This method had high replicability, a low error rate after quality control and a low rate of missing data (88% of the 320 gene/ individual combinations produced sequence reads). This method is cheaper than and at least as reliable as bac-terial cloning. It could be applied to any experiment involving sequencing of amplicon mixtures.
We applied this method to a group of sympatric Aus-tralian alpine Poa species, which were discovered to have an allopolyploid ancestor in common with a group of American Poaspecies. Alleles and haplotypes were shared extensively between the Australian ‘species’and little inter-species differentiation was detected, though the Tasmania and mainland samples were somewhat distinct. Significant spatial genetic structure was detected at <100 km spatial scales using chloroplast but not nuclear markers, indicating smaller seed than pollen neighborhoods. More work is necessary to distinguish incomplete lineage sorting from hybridization in this seemingly recently-evolved group, but we can recom-mend that the current taxonomy be re-examined, as we
found little evidence to support current species concepts.
Methods
Sampling and DNA extraction
Herbarium specimens were examined at the Australian National Herbarium, Canberra, Australia (CANB). Ele-ven species were chosen, with a total of 61 specimens sampled (Table 2). Specimens sampled had been col-lected later than 1970, identified to the species or variety level by experienced taxonomists, and with large amounts of well-preserved leaf tissue from a single plant. A small amount of leaf tissue (1/2 to 5 leaves depending on plant size) was removed. In the labora-tory, approximately 20 mg of leaf tissue was added to a 1.5 ml Eppendorf tube with two glass beads (3 mm dia-meter). DNA was extracted using the DNeasy Plant Mini Kit (Qiagen, Hilden, Germany) following the man-ufacturer’s protocol, grinding leaf tissue in a Mixermill (Retsch MM300) and eluting in a total volume of 200
μl. Duplicate samples of three herbarium specimens were included from the DNA extraction stage onwards, bringing the total number of samples to 64.
Initial PCR and amplicon pooling
The program Primer3 [76] was used to design primers for amplifying regions 400 to 450 bp in length from the nuclear regionsDMC1 and CDO504, and the following chloroplast regions:rpl32-trnL,rpoB-trnC andtrnH-psbA. The maximum sequence length for this study was limited to approximately 500 bp as recommended by Roche [43]. Primers were designed based on initial sequence align-ments gained from a trial panel of 25 individual herbarium specimens [see additional file 3 - Table S1]. These had been obtained using primers designed by Pattersonet al.
[21] (CDO504), Petersen and Seberg [77] (DMC1, primers TDMC1e10 and TDMC1e15R), Shawet al.[78] (trn
H-psbA andrpoB-trnC), and Shawet al.[79] (rpl32-trnL) (results not reported here). For all PCR amplifications, 2 × BIO-X-ACT™Short Mix (Bioline, London, England) con-taining enzyme, buffer, dNTPs and 2.0 mM MgCl2 was
used in 20μl reactions. Primers (0.8μM each primer), template (2μl extracted DNA for nuclear amplifications, 2
μl 1/10-diluted extracted DNA for chloroplast amplifica-tions) and MgCl2 [see additional file 3 - Table SI] were
preferential amplification of particular alleles, as recom-mended by Smallet al.[13]. Amplification products were quantified by agarose gel electrophoresis and comparison to a ladder (HyperLadder™II, Bioline, London, England). For the chloroplast regions, 25 ng of each PCR product was pooled for each individual. 100 ng of each nuclear region was added, because we wanted to represent each of the four possible amplicons equally in the final mixture.
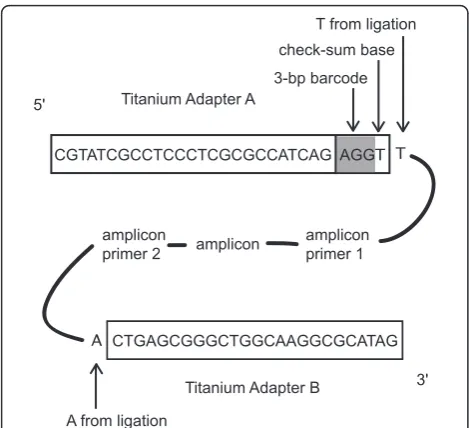
Barcoded amplicon library creation
To avoid synthesizing a composite amplicon primer-bar-code-adapter fusion primer, for every gene × individual combination [42,43], which would have been prohibitively expensive, a ligation reaction was performed to add bar-code sequences to the pooled amplicons. The barbar-codes comprised the GS FLX Adapter A (5’–CGTATCGCCT CCCTCGCGCCATCAG–3’) with a 3-bp barcode sequence at the 3’end as in [44] followed by a checksum base and an extra T to facilitate sticky-ended ligation (Fig-ure 8). The checksum base was included to detect sequen-cing errors in the barcode region, such that the barcodes occupied only 64/256 possible 4-bp-long combinations of the four bases. The reverse complement of this Adapter A-barcode oligonucleotide was also present. Adapter B (5’–CTGAGCGGGCTGGCAAGGCGCATAG–3’) was a non-barcoded, non-biotinylated oligonucleotide identical to that used in the current GS FLX Titanium Lib-L sequencing chemistry [80]. To make the barcodes
double-stranded, equimolar mixtures in ligase buffer (BioLine, London, England) of the forward and reverse-complement oligonucleotides (each 20μM) were subjected to 95°C for 3 minutes and allowed to cool to room temperature.
Barcodes were ligated onto the amplicons using a standard ligation reaction as follows. The amplicon mix-ture for each individual was purified using an Illustra GLX PCR DNA and Gel Band Purification Kit (GE Healthcare, Little Chalfont, UK, 2008 version). The puri-fied product was quantipuri-fied using a NanoDrop 1000 Spectrophotometer (Thermo Scientific, Wilmington, DE, USA).100 ng of the pooled amplicon mixture, double-stranded Adapter A-barcode and double-double-stranded Tita-nium Adapter B (0.25μM each), 5 U T4 polynucleotide kinase (New England Biolabs, Ipswich, MA, USA), 20 cohesive end units T4 DNA ligase (New England Bio-labs, Ipswich, MA, USA) and 10 × T4 ligase buffer were combined in a 40μl ligation reaction. This mixture was subjected to 37°C for 1 hour, followed by 10 cycles of 22°C for 1 hour, then placed at 14°C for 1 hour, and 65° C for 20 minutes before being brought to room tem-perature. The desired ligation product was flanked by the Adapter A-barcode oligonucleotide on one end and the double-stranded Titanium Adapter B on the other end (Figure 8). Some products would have formed with either Adapter A-barcode or Adapter B on both ends; these would be removed automatically later in the pro-cess, in the Enrichment step described in the Roche GS
Table 2 Ecological association and herbarium accessions used for eachPoaspecies
Species Ecological association Herbarium accessions (all CANB)
Victoria New South Wales Tasmania
Poa annua*(5) Subalpine, montane, elsewhere
312513, 343723, 407148
P. clivicola(8) Alpine, subalpine 228786, 228805, 329728, 438760, 647153, 7901040, 8702739, 8906309
P. costiniana(8) Alpine 402908** 228898, 505348, 543047**, 619540, 619578, 8101033, 9707880
P. ensiformis(5) Subalpine, montane 48084, 67340, 363091 645156, 8906370
P. fawcettiae(10) Alpine 67067, 488116, 9501151 228865, 228879, 230925, 345640, 505340, 505353, 505353
P. gunnii(5) Alpine, subalpine Not present Not present 195943, 341316, 402406, 8904303, 9215410
P. helmsii(6) Alpine, subalpine 68026, 228839, 312845, 644862, 8316158, 9301326
P. hiemata(5) Alpine 8500047 343721, 506031, 7705690 9012247
P. hothamensisvar.
hothamensis(6)
Alpine, subalpine 67341, 207890**, 207886, 207893, 409990
Not present Not present
P. phillipsiana(6) Alpine, subalpine 67342, 207889 615444, 651518, 8413383
P. sieberianavar.
sieberiana(1)
Alpine, subalpine, montane, elsewhere
780260
Herbarium accession numbers are listed by Australian state of origin. Total number of accessions used is given in brackets after the species name. * indicates the introduced speciesPoa annua, used as an outgroup.
FLX Titanium emPCR Method Manual [80]. To remove excess adaptors, all ligations were pooled in groups of 5 (10 μl each ligation) and the resulting mixtures were purified using a PCR Purification Kit (Scientifix, Clayton, Victoria, Australia).
To check the success of the ligations for two samples, the ligation products were ligated into a pGEM-T Easy Vector (Promega, Madison, WI, USA) after addition of an A-overhang and used to transform JM-109 competent cells according to the manufacturer’s protocol. Three clones were sequenced for each sample to check whether the original ligation had occurred as desired, using com-mercial ABI-3730XL capillary sequencing (Macrogen Inc, Geumcheon-gu, Seoul, Korea). Sequences were examined using Sequencher 4.7 (GeneCodes Corporation, Ann Arbor, MI, USA).
Our barcodes had been designed to match the 2007 GS FLX chemistry, so the Adapter A sequence was 6 bp shorter than the 2010 Titanium Adapter A (which was to be used in the actual sequencing reaction). To overcome this problem, after the adapter ligation step, we performed three replicate PCR reactions for each mixture using Tita-nium Adapter A as the forward primer and TitaTita-nium Adapter B as the reverse primer. This reaction extended the barcode end of the samples an extra 6 bp so that they were of the form: 5’ Titanium A adapter barcode checksum base T amplicon A Titanium B adapter
-3’, to match exactly with the current Titanium chemistry (Figure 8). PCR protocol was as follows: 96°C for 5 min-utes; 10 cycles of 96°C for 30 seconds, 53°C for 30 seconds, 72°C for 45 seconds; 72°C for 5 minutes; 15°C hold. By designing barcode oligonucleotides to match exactly the current sequencing chemistry, researchers should be able to avoid this step.
After the PCR extension step, the amplicon mixtures were pooled in equal amounts. The resulting barcoded amplicon library (approximately 630 ng of DNA) was purified again using the PCR Purification Kit (Scientifix, Clayton, Victoria, Australia) to remove PCR primers and sequenced using the GS FLX Titanium chemistry (Lib-L; Roche, Basel, Switzerland). A ¼ plate run was performed following appropriate quality control and sample pre-paration carried out by the Australian Genome Research Facility (AGRF), Brisbane, Australia.
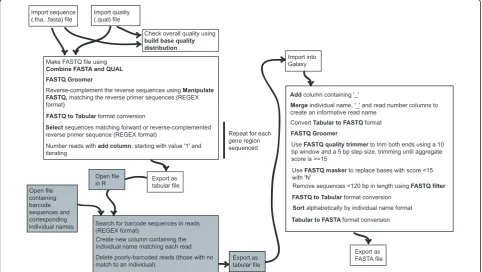
Barcode deconvolution and quality control
Sequence (.fasta) and quality (.qual) files obtained from the sequencing run were imported into the public Galaxy platform, a free online bioinformatics interface available at http://main.g2.bx.psu.edu/[81]. The full dataset was divided into gene regions by regular expression (REGEX) matching the amplicon primer sequences. Since this work was carried out,‘clip adapter’and‘barcode splitter’ tools have become available in the FASTX-Toolkit (http://hannonlab.cshl.edu/fastx_toolkit/) implemented in Galaxy, which may simplify the procedure further. Individual barcodes were then detected using R [82] [see additional file 4 - Supplementary Text].
After this barcode deconvolution, quality control was performed to trim low-quality read ends, mask unreliable base calls and remove short sequences. This workflow is shown in detail in Figure 9. A subset ofrpl32-trnL reads was examined in R to check the accuracy of the quality control procedure and to estimate the frequency of bar-code failure. Finally, a FASTA file containing all good-quality reads for each gene region, named by the source individual, was exported for alignment and editing.
Sequence alignment and editing
Sequences were aligned using Sequencher 4.7 [83] for each combination of individual and gene. Alignments were edited manually to remove adapters, PCR primers and bases that had been added during the ligation cess. For the chloroplast regions, a single consensus pro-duct was expected for each individual. For the nuclear regions, distinct alleles were identified as differing con-sistently by at least two base positions in >80% of reads in the alignment. A separate alignment was then edited manually for each allele.
Sequencing error rate was estimated by counting the single-base variants in 25 of the rpl32-trnL alignments
CGTATCGCCTCCCTCGCGCCATCAG AGGT T
CTGAGCGGGCTGGCAAGGCGCATAG
A
amplicon ampliconprimer 1 amplicon
primer 2 5'
3' Titanium Adapter A
3-bp barcode check-sum base
T from ligation
A from ligation
Titanium Adapter B
(>20,000 bases). Poor-quality (<15) bases were excluded from error estimation as they had been previously masked with Ns. Length variation was also excluded.
Apparent alleles that actually resulted from PCR recom-bination were detected using two criteria. First, these apparent alleles occurred in a minority of reads for that particular individual/gene combination (usually <5%). Sec-ond, one end of the recombinant sequence matched one common allele and the other end matched a different common allele when all three were examined in a contig. A subset of the alleles identified as recombinant were checked using the BootScan method [84] in RDP3 [33].
Once a suitable sequence alignment was produced, indels were coded. Apparent length variation in mono-nucleotide repeats of >5 bp was not scored, as there was often no clear consensus between sequence reads at such regions. Indels that were not phylogenetically informative (that is only occurred in one individual) were also not scored, as they may have resulted from PCR errors. All other indels were coded as‘a’or‘c’and added to the end of the sequence alignment, so weight-ing them as transversions.
Data analysis
For each sequence alignment, the best substitution model was chosen by AIC value comparison using
Modeltest 3.7 [85] implemented in PAUP* v4b10 [86]. A pairwise genetic distance matrix was then calculated using Mega 5 [87] with substitution model parameters as close to those chosen in Modeltest as possible. This distance matrix was followed to make a network in SplitsTree 4.11.3 [88], using the NeighbourNet method and the EqualAngle display option.
For the chloroplast regions, the same pairwise distance matrix was used for investigating species and geographic genetic structure. For the nuclear regions, an uncorrected p-distance matrix made in Mega 5 was converted to an individual distance matrix with Pofad 1.03 [89]. For all seven gene regions, the following analysis was performed in GENALEX 6.3 [90]. First,Poa annuasequences and any species with only a single representative individual were removed. Either species or broad geographic groups (Tasmania, western Victoria, north-eastern Victoria, Kos-ciuszko Main Range (eastern NSW), Australian Capital Territory, NSW lowlands) were coded as populations. An analysis of molecular variance (AMOVA) was performed with 999 permutations and both pairwise and overallFPT
output. Second, the genetic distance matrix was recoded as a single population, and a geographic distance matrix was calculated from the latitude/longitude of sample col-lection listed on the herbarium record of each individual. A spatial autocorrelation analysis was then performed
Import sequence (.fna, .fasta) file
Import quality (.qual) file
Check overall quality using build base quality distribution
Make FASTQ file using Combine FASTA and QUAL FASTQ Groomer
Reverse-complement the reverse sequences using Manipulate FASTQ, matching the reverse primer sequences (REGEX format)
FASTQ to Tabular format conversion
Select sequences matching forward or reverse-complemented
reverse primer sequence (REGEX format) Repeat for each gene region sequenced Number reads with add column, starting with value '1' and
iterating
Export as tabular file
Search for barcode sequences in reads (REGEX format)
Import into Galaxy
Add column containing '_'
Merge individual name, '_' and read number columns to create an informative read name
Convert Tabular to FASTQ format
FASTQ Groomer
Use FASTQ quality trimmer to trim both ends using a 10 bp window and a 5 bp step size, trimming until aggregate score is >=15
Use FASTQ masker to replace bases with score <15 with 'N'
Remove sequences <120 bp in length using FASTQ filter
FASTQ to Tabular format conversion Sort alphabetically by individual nameformat
Tabular to FASTA format conversion Open file
in R
Create new column containing the individual name matching each read Open file
containing barcode sequences and corresponding individual names
Export as tabular file Delete poorly-barcoded reads (those with no
match to an individual)
Export as FASTA file
using ten even distance classes of 100-km intervals, 999 permutations and 999 bootstrap resampling steps. It was repeated for each region excluding all Tasmanian sam-ples. A second analysis was performed with 20-km dis-tance intervals for gene regions that showed spatial genetic structure in the first analysis.
Representative CDO504 copy A and B sequences were chosen that covered the sequence diversity observed in this study. CDO504 sequences for otherPoaspecies were downloaded from GenBank [30]. All sequences were aligned manually using Sequencher 4.7 without coding insertion-deletion polymorphism. The best model of nucleotide evolution was again chosen using Modeltest 3.7, run in PAUP*. Bayesian analysis was then performed on the alignment in BEAST 1.6.1 [91], running 10,000,000 MCMC generations and logging every 1,000 generations, with the following departures from the default priors: con-stant population size; GTR+G substitution model with starting substitution matrix and gamma parameter values chosen using ModelTest. A maximum clade credibility tree was then calculated using TreeAnnotator after remov-ing the first 1,000,000 generations as burnin. A maximum parsimony analysis was also run on the alignment using 200 iterations of the ratchet provided in PaupRat [92] implemented in PAUP*, with random-addition searches with TBR branch swapping. One thousand bootstrap repe-titions were then performed, using 50 random sequence addition heuristic searches and TBR branch swapping.
Additional material
Additional file 1: Figure S1 - Alignment of partial trnH-psbA spacer
region showing insertional mutation across the Poaceae. The
predicted hairpin structure is shown in the upper panel, with conserved regions involved in hairpin binding colored as per the alignment in the lower panel. Species names are shaded according to subfamily: Arundinoideae (pink), Bambusoideae (light blue), Chloridoideae (green), Ehrhartoideae (Yellow), Panicoideae (dark blue), Pooideae (red), uncertain (grey). One Liliaceae sequence is included, outlined in black.
Additional file 2: Figure S2 - Spatial genetic autocorrelation plots
for the chloroplast markers. The two markers that revealed spatial
genetic structure are shown:rpl32-trnL (A-B, E-F) andrpoB-trnC (C-D, G-H). Analyses were repeated including (A, C, E, G) and excluding (B, D, F, H) the Tasmanian samples, and for large-scale (A-D) and small-scale (E-H) distances. Solid black line joins the meanrvalues for each distance class, with 95% CI shown by the error bars (determined by 999 bootstrap resampling repeats). The dotted red lines bound the 95% CI about the null hypothesis (determined by 999 permutations).
Additional file 3: Table SI - Primers and PCR details for the regions
amplified. Table showing primer sequences and variation from the PCR
protocol described in the text for each gene region amplified.
Additional file 4: Supplementary Text - Detailed instructions for
barcode deconvolution in R. Text file including R code.
Abbreviations
G: Gamma parameter (in a nucleotide substitution model); GTR: Gamma Time-Reversible; I: proportion Invariant sites (in a nucleotide substitution
model); Indel: insertion-deletion mutation; PCR: Polymerase Chain Reaction; SNP: Single-Nucleotide Polymorphism; TBR: Tree Bisection-Reconnection.
Acknowledgements
We thank Rob Good for technical help and advice. We also thank the staff of the National Herbarium, Canberra (CANB) for allowing leaf sampling from herbarium specimens. This study was funded by an ARC Linkage Grant with financial support from the Department of Sustainability and Environment and Parks Victoria. It was also supported by a Holsworth Wildlife Research Endowment awarded to PG and ARC Laureate Fellowship to AAH.
Author details
1Department of Genetics, University of Melbourne, Parkville 3010, Victoria,
Australia.2Department of Zoology, University of Melbourne, Parkville 3010, Victoria, Australia.
Authors’contributions
PCG performed the molecular lab work, developed the barcode
deconvolution and quality control method, carried out the data analysis, and drafted the manuscript. CR developed the sample barcode design, participated in the study design, suggested some tests of the sequencing method, annotated nuclear regions and helped to draft the manuscript. AAH participated in the study design and helped to draft the manuscript. All authors read and approved the final manuscript.
Received: 1 March 2011 Accepted: 23 March 2011 Published: 23 March 2011
References
1. Bennett M:Perspectives on polyploidy in plants - ancient and neo.Biol J Linn Soc Lond2004,82:411-423.
2. Soltis D, Soltis P, Tate J:Advances in the study of polyploidy sincePlant speciation.New Phytol2003,161:173-191.
3. Mable B:Breaking down taxonomic barriers in polyploidy research.
Trends Plant Sci2003,8:582-590.
4. Otto S:The evolutionary consequences of polyploidy.Cell2007, 131:452-462.
5. Adams K, Wendel J:Polyploidy and genome evolution in plants.Curr Opin Plant Biol2005,8:135-141.
6. Leitch A, Leitch I:Genomic plasticity and the diversity of polyploid plants.Science2008,320:481-483.
7. Blanc G, Wolfe K:Widespread paleopolyploidy in model plant species inferred from age distributions of duplicate genes.Plant Cell2004, 16:1667-1678.
8. Chen Z, Ha M, Soltis D:Polyploidy: genome obesity and its consequences.New Phytol2007,174:717-720.
9. Levy A, Feldman M:The impact of polyploidy on grass genome evolution.Plant Physiol2002,130:1587-1593.
10. Arnold M:Transfer and origin of adaptations through natural hybridization: were Anderson and Stebbins right?Plant Cell2004, 16:562-570.
11. Maddison W, Knowles L:Inferring phylogeny despite incomplete lineage sorting.Syst Biol2006,55:21-30.
12. Heled J, Drummond A:Bayesian inference of species trees from multilocus data.Mol Biol Evol2010,27:570-580.
13. Small R, Cronn R, Wendel J:Use of nuclear genes for phylogeny reconstruction in plants.Australian Systematic Botany2004,17:145-170. 14. Degnan J, Rosenberg N:Gene tree discordance, phylogenetic inference
and the multispecies coalescent.Trends Ecol Evol2009,24:332-340. 15. Jakob S, Blattner F:Two extinct diploid progenitors were involved in
allopolyploid formation in theHordeum murinum(Poaceae: Triticeae) taxon complex.Mol Phylogenet Evol2009,55:650-659.
16. Lihová J, Shimizu K, Marhold K:Allopolyploid origin ofCardamine asarifolia(Brassicaceae): Incongruence between plastid and nuclear ribosomal DNA sequences solved by a single-copy nuclear gene.Mol Phylogenet Evol2006,39:759-786.
18. Lundberg M, Töpel M, Eriksen B, Nylander J, Eriksson T:Allopolyploidy in Fragariinae (Rosaceae): Comparing four DNA sequence regions, with comments on classification.Mol Phylogenet Evol2009,51:269-280. 19. Fehrer J, Krak K, Chrtek J Jr:Intra-individual polymorphism in diploid and
apomictic polyploid hawkweeds (Hieracium, Lactuceae, Asteraceae): disentangling phylogenetic signal, reticulation, and noise.BMC Evol Biol
2009,9:239.
20. Fortune P, Pourtau N, Viron N, Ainouche M:Molecular phylogeny and reticulate origins of the polyploidBromusspecies from sectionGenea (Poaceae).Am J Bot2008,95:454-464.
21. Patterson J, Larson S, Johnson P:Genome relationships in polyploidPoa pratensisand otherPoaspecies inferred from phylogenetic analysis of nuclear and chloroplast DNA sequences.Genome2005,48:76-87. 22. Joly S, Heenan P, Lockhart P:A Pleistocene inter-tribal allopolyploidization
event precedes the species radiation of Pachycladon (Brassicaceae) in New Zealand.Mol Phylogenet Evol2009,51:365-372.
23. Schmickl R, Jørgensen M, Brysting A, Koch M:The evolutionary history of the Arabidopsis lyratacomplex: a hybrid in the amphi-Beringian area closes a large distribution gap and builds up a genetic barrier.BMC Evol Biol2010, 10:98.
24. Jiang LY, Qian ZQ, Guo ZG, Wang C, Zhao GF:Polyploid origins in Gynostemma pentaphyllum(Cucurbitaceae) inferred from multiple gene sequences.Mol Phylogenet Evol2009,52:183-191.
25. Vickery J:A taxonomic study of the genusPoaL. in Australia.
Contributions from the NSW National Herbarium1970,4:145-243. 26. Walsh N:Poaceae.InFlora of Victoria: Volume 2.Edited by: Walsh N,
Entwisle T. Melbourne: Inkata Press; 1994:356-625.
27. Soreng R:Chloroplast-DNA phylogenetics and biogeography in a reticulating group: study inPoa(Poaceae).Am J Bot1990,77:1383-1400. 28. Bor N:The genusPoaL. in India. Part I.Journal of the Bombay Natural
History Society1952,50:787-838.
29. Stebbins G:Variation and evolution in plantsNew York: Columbia University Press; 1950.
30. Benson D, Karsch-Mizrachi I, Lipman D, Ostell J, Wheeler D:GenBank.
Nucleic Acids Res2005,33:D34-D38.
31. Dawkins B:Siobhan’s problem: the coupon collector revisited.The American Statistician1991,45:76-82.
32. Joly S, Starr J, Lewis W, Bruneau A:Polyploid and hybrid evolution in roses east of the Rocky Mountains.Am J Bot2006,93:412-425. 33. Martin D, Williamson C, Posada D:RDP2: recombination detection and
analysis from sequence alignments.Bioinformatics2005,21:260-262. 34. Carver T, Rutherford K, Berriman M, Ranjandream M, Barrell B, Parkhill J:
ACT: the Artemis Comparison Tool.Bioinformatics2005,21:3422-3423. 35. Rutherford K, Parkhill J, Crook J, Horsnell T, Rice P, Ranjandream M, Barrell B:
Artemis: sequence visualization and annotation.Bioinformatics2000, 16:994-995.
36. Kelchner S, Wendel J:Hairpins create minute inversions in non-coding regions of chloroplast DNA.Curr Genet1996,30:259-262.
37. Zuker M:Mfold web server for nucleic acid folding and hybridization prediction.Nucleic Acids Res2003,31:3406-3415.
38. Jumpponen A, Jones K:Massively parallel 454 sequencing indicates hyperdiverse fungal communities in temperateQuercus macrocarpa phyllosphere.New Phytol2009,184:438-448.
39. Sønstebø J, Gielly L, Brysting A, Elven R, Edwards M, Haile J, Willerslev E, Coissac E, Rioux D, Sannier J, Taberlet P, Brochmann C:Using next-generation sequencing for molecular reconstruction of past Arctic vegetation and climate.Molecular Ecology Resources2010,10:1009-1018. 40. Taudien S, Groth M, Huse K, Petzold A, Szafranski K, Hampe J, Rosenstiel P,
Schreiber S, Platzer M:Haplotyping and copy number estimation of the highly polymorphic human beta-defensin locus on 8p23 by 454 amplicon sequencing.BMC Genomics2010,11:252.
41. Chenuil A, Hoareau T, Egea E, Penant G, Rocher C, Aurelle D, Mokhtar-Jamai K, Bishop J, Boisson E, Diaz A, Krakau M, Luttikhuizen PC, Patti FP, Blavet N, Mousset S:An efficient method to find potentially universal population genetic markers, applied to metazoans.BMC Evol Biol2010, 10:276.
42. Roche :GS Junior System: Guidelines for Amplicon Experimental Design. 2010.
43. Roche :Amplicon fusion primer design guidelines for GS FLX Titanium series Lib-A chemistry.2009.
44. Lennon N, Lintner R, Anderson S, Alvarez P, Barry A, Brockman W, Daza R, Erlich R, Giannoukos G, Green L, Hollinger A, Hoover CA, Jaffe DB, Juhn F, McCarthy D, Perrin D, Ponchner K, Powers TL, Rizzolo K, Robbins D, Ryan E, Russ C, Sparrow T, Stalker J, Steelman S, Weiand M, Zimmer A, Henn MR, Nusbaum C, Nicol R:A scalable, fully automated process for construction of sequence-ready barcoded libraries for 454.Genome Biol2010,11:R15. 45. Pirie M, Humphreys A, Galley C, Barker N, Verboom G, Orlovich D, Draffin S,
Lloyd K, Baeza C, Negritto M, Ruiz E, Sanchez JH, Reimer E, Linder HP:A novel supermatrix approach improves resolution of phylogenetic relationships in a comprehensive sample of danthonioid grasses.Mol Phylogenet Evol2008,48:1106-1119.
46. Duan S, Lu B, Li Z, Tong J, Kong J, Yao W, Li S, Zhu Y:Phylogenetic analysis of AA-genomeOryzaspecies (Poaceae) based on chloroplast, mitochondrial, and nuclear DNA sequences.Biochem Genet2007, 45:113-129.
47. Ramsey J, Schemske D:Neopolyploidy in flowering plants.Annu Rev Ecol Syst2002,33:589-639.
48. Germplasm Resources Information Network (GRIN).[http://www.ars-grin. gov].
49. Inda L, Segerra-Moragues J, Müller J, Peterson P, Catalán P:Dated historical biogeography of the temperate Loliinae (Poaceae, Pooideae) grasses in the northern and southern hemispheres.Mol Phylogenet Evol2008, 46:932-957.
50. Blanc G, Wolfe K:Functional divergence of duplicated genes formed by polyploidy duringArabidopsisevolution.Plant Cell2004,16:1679-1691. 51. Whitlock B, Hale A, Groff P:Intraspecific inversions pose a challenge for
thetrnH-psbAplant DNA barcode.PLoS One2010,5:e11533. 52. Sang T, Crawford D, Stuessy T:Chloroplast DNA phylogeny, reticulate
evolution, and biogeography ofPaeonia(Paeoniaceae).Am J Bot1997, 84:1120-1136.
53. Bain J, Jansen R:A chloroplast DNA hairpin structure provides useful phylogenetic data within tribe Senecioneae (Asteraceae).Can J Bot2006, 84:862-868.
54. Joly S, Pfeil B, Oxelman B, McLenachan P, Lockhart P:Correction.Am Naturalist2010,175:621-622.
55. Sha L, Fan X, Yang R, Kang H, Ding C, Zhang L, Zheng Y, Zhou Y: Phylogenetic relationships betweenHystrixand its closely related genera (Triticeae; Poaceae) based on nuclearAcc1,DMC1and chloroplasttrnL-Fsequences.Mol Phylogenet Evol2010,54:327-335. 56. Liu Z, Chen Z, Pan J, Li X, Su M, Wang L, Li H, Liu G:Phylogenetic
relationships inLeymus(Poaceae: Triticeae) revealed by the nuclear ribosomal internal transcribed spacer and chloroplasttrnL-Fsequences.
Mol Phylogenet Evol2008,46:278-289.
57. Jakob S, Blattner F:A chloroplast genealogy ofHordeum(Poaceae): long-term persisting haplotypes, incomplete lineage sorting, regional extinction, and the consequences for phylogenetic inference.Mol Biol Evol2006,23:1602-1612.
58. Triplett J, Clark L:Phylogeny of the temperate bamboos (Poaceae: Bambusoideae: Bambuseae) with an emphasis onArundinariaand allies.
Systematic Botany2010,35:102-120.
59. Souza-Chies T, Essi L, Rua G, Valls J, Miz R:A preliminary approach to the phylogeny of the genusPaspalum(Poaceae).Genetica2006,126:15-32. 60. Kress W, Erickson D:A two-locus global DNA barcode for land plants: the
codingrbcLgene complements the non-codingtrnH-psbAspacer region.
PLoS One2007,2:e508.
61. Doyle J, Doyle J, Rauscher J, Brown A:Diploid and polyploid reticulate evolution throughout the history of the perennial soybeans (Glycine subgenusGlycine).New Phytol2003,161:121-132.
62. Knowles L, Chan YH:Resolving species phylogenies of recent evolutionary radiations.Annals of the Missouri Botanical Garden2008, 95:224-231.
63. Darmency H, Gasquez J:Spontaneous hybridization of the putative ancestors of the allotetraploidPoa annua.New Phytol1997,136:497-501. 64. Gillespie L, Soreng R:A phylogenetic analysis of the bluegrass genus
Poabased on cpDNA restriction site data.Systematic Botany2005, 30:84-105.
65. Grun P:Cytogenetic studies ofPoa. I. Chromosome numbers and morphology of interspecific hybrids.Am J Bot1954,41:671-678. 66. Lambeck K, Chappell J:Sea level change through the last glacial cycle.
![Figure 4 Phylogenetic tree of Poa CDO504 sequences. Maximum clade credibility tree made using BEAST [91]: 10,000,000 generations,constant population size, GTR+G model with starting substitution matrix and gamma parameter values chosen in ModelTest 3.7](https://thumb-us.123doks.com/thumbv2/123dok_us/8916122.1839136/6.595.59.539.88.516/phylogenetic-sequences-credibility-generations-population-substitution-parameter-modeltest.webp)