* Corresponding author. Tel.: +91-9822267995 E-mail: [email protected] (P. S. Desale) © 2014 Growing Science Ltd. All rights reserved. doi: 10.5267/j.ijiec.2013.11.005
International Journal of Industrial Engineering Computations 5 (2014) 265–272
Contents lists available at GrowingScience
International Journal of Industrial Engineering Computations
homepage: www.GrowingScience.com/ijiec
Modeling the effect of variable work piece hardness on surface roughness in an end milling using multiple regression and adaptive Neuro fuzzy inference system
Purushottam S. Desalea* and Ramchandra S. Jahagirdarb
a
SJJT University, Jhunjhunu -333001, Rajasthan, India
b
Institute Of Knowledge, College Of Engineering, Pune -412208, Maharashtra, India C H R O N I C L E A B S T R A C T
Article history: Received July 2 2013
Received in revised format September 7 2013
Accepted November 23 2013 Available online
November 26 2013
The aim of this study is to correlate work piece material hardness with surface roughness in prediction studies. The proposed model is for prediction of surface roughness of tool steel materials of hardness 55 HRC to 62 HRC (±2 HRC). The machining experiments are performed under various cutting conditions using work piece of different hardness. The surface roughness of these specimens is measured. The result showed that the influence of work piece material hardness on surface finish is significant for cutting speed and feed in CNC end milling operation. It is also observed that the surface roughness prediction accuracy of Adaptive neuro fuzzy inference system using triangular membership function is better than Gaussian, bell shape membership function and regression analysis. Surface roughness prediction accuracy with material hardness as input parameter is 97.61%.
© 2014 Growing Science Ltd. All rights reserved
Keywords:
End Milling Tool steel Surface roughness Fuzzy inference system Regression
1. Introduction
By using a hybrid learning algorithm which combines the gradient method and the least squares estimate to identify parameters, the ANFIS can construct an input–output mapping based on both human knowledge (in the form of fuzzy if–then rules) and the stipulated input–output data pairs (Jang et al., 2004). Therefore, Lo (2003) used the ANFIS with the hybrid learning algorithm to model the relationship between the surface roughness and the milling parameters (i.e., spindle speed, feed rate and depth of cut) in the end milling process. Down milling process of Alumic-79 using ANFIS to predict the effect of surface variables on the surface roughness (Dweiri et al. 2003).The papers are presented on modelling of end milling considering speed, feed and depth of cut as an input machining parameter and output parameter as surface roughness and tool wear. The work is also reported with and without step over ratio and speed feed and depth of cut as an input cutting parameter (Topal, 2009).
An adaptive network-based fuzzy inference system (ANFIS) with the genetic learning algorithm was used to predict the work piece surface roughness for the end milling process. The hybrid Taguchi-genetic learning algorithm (HTGLA) was applied in the ANFIS to determine the most suitable membership functions and to simultaneously find the optimal premise and consequent parameters by directly minimizing the root-mean-squared-error performance criterion (Ho et al., 2009). A neural-fuzzy scheme is applied to perform the prediction of flank wear from cutting force signals. In this the construction of an ANFIS system that seeks to provide a linguistic model for the estimation of tool wear from the knowledge embedded in the neural network was discussed (Z Uros, C Franc & K Edi 2009). In order to improve the prediction accuracy in end milling process, an improved approach is proposed to model surface roughness with adaptive network-based fuzzy inference system (ANFIS) and leave-one-out cross-validation (LOO-CV) approach (Dong & Wang, 2010). This approach focuses on both architecture and parameter optimization. LOO-CV, which is an effective measure to evaluate the generalization capability of mode, is employed to find the most suitable membership function and the optimal rule base of ANFIS model for the issue of surface roughness prediction 96.38%. Rajasekaran et al. (2011) researched the influence of machining parameters combination so as to obtain a good surface finish in turning and to predict the surface roughness values using fuzzy modelling. An
empirical model using fuzzy logic and regression analysis is studied (Kovac et al., 2012).The values of surface roughness predicted by these models are then compared. The results showed that the proposed system can significantly increase the accuracy of the product profile when compared with the regression analysis. The input variables used to model surface roughness was speed, feed, depth of cut and flank width. The results indicate that the fuzzy logic modelling technique can be effectively used for the prediction of surface roughness in dry machining.
The modelling work is not reported using material hardness as an input parameter in prediction of surface roughness. The published work focus on material with specific hardness and material properties, therefore the prediction model for each material will not be identical. In the proposed paper hardened tool steel of different hardness is used as an input parameter along with speed, feed and depth of cut for experimentation and prediction work. Tool steel material is used in High-duty cutting tools (dies and punches), blanking and punching tools, wood working tools, shear blades for cutting light gauge material, thread rolling tools, tools for drawing, deep drawing and cold extrusion, pressing tools for the ceramics and pharmaceutical industries, cold rolls (working rolls) for multiple roll stands, measuring instruments and gauges, small moulds for the plastics industry where excellent wear resistance is required. For purpose of the proposed work the range of hardness considered for machining of die steel materials within the range of 55 HRC to 62 HRC with ±2 HRC variation.
phenomena results in to good surface roughness (Benardos, 2003). The selection of machining parameters, cutting tool properties and cutting phenomena depends on material property such as hardness. Therefore optimum selection of hardness of work piece material to achieve the desired surface roughness is necessary.
The effect of work piece material hardness along with speed, feed and depth of cut on response variable surface roughness is proposed in this paper. The effect of work piece hardness using Böhler K340 ISODUR die steel material of variable hardness is studied. The proposed prediction model will help practitioners in selection optimum work piece material hardness to get desired surface roughness.
2. Experimental setup
The experimental setup was set for the three machining parameter spindle speed (m/min), feed (mm/rev) and depth of cut (mm). The machining centre for End milling process was vertical milling centre (MAKINO S56) Fanuc Professional – 5 controlled. Tool insert R 0.8 with Al Ti Si N coated carbide two flute End mill Cutter Helix angle 45°, 25 mm diameter. The material used for experimentation was Böhler K340 ISODUR of hardness 55 HRC, 58HRC, 60HRC and 62 HRC. The material chemical composition was C, 1.10 %; Si, 0.90 %; Mn, 0.40%; Cr, 8.30 %; Mo, 2.10 %; V, 0.50 %. The work piece size 100 mm × 80 mm × 40 mm was used to generate the data of 144 sets. Four work pieces of hardness 55 - 62HRC were prepared and used for experimentation. The surface roughness (Ra) was measured with surfcom - 130A, ZEISS make surface roughness tester. The surface roughness parameter was selected according to UNE-EN-ISO 4287:1999 standard and center line average (CLA). The range of input machining parameter for the investigation was, spindle speed (S) 75 – 150 m/ min, Feed (F) 0.02 – 0.06 (mm/rev), depth of cut (D) 2 - 6 (mm) and work piece material hardness (H) 55 – 62 (HRC). The surface roughness data is collected for work piece material one by one of four different hardness keeping same values of speed, feed and depth of cut in each setup.
3. Regression
Since multiple regression is used to determine the correlation between a criterion variable and a combination of predictor variables, the statistical multiple regression method is applied. It can be used to analyze data from any of the major quantitative research designs such as causal-comparative, correctional, and experimental. This method is also able to handle interval, ordinal, or categorical data and provide estimates both of the magnitude and statistical significance of the relationships between variables Therefore, multiple regression analysis will be useful to predict the criterion variable finish surface roughness via predictor variables such as feed rate, spindle speed, depth of cut and work piece material hardness (M. S. Lou et al.). After the experimentation on hardened tool steel material with hardness ranging from 55 – 62 HRC 144 datasets are collected. Out of this data set 108 data sets are used for training and randomly selected 36 datasets (1/4 of total datasets) for testing prediction accuracy. An empirical expression was established based on the regression analysis for predicting surface roughness of dry end milling.
Ra = 0.000185S . F . D . H . , (1)
where, Ra—surface roughness (mean centerline average) [μm], S—cutting speed in m/min, F— feed per mm/rev, D—depth of cut in mm and H—Work piece material hardness HRC.
values are used for comparison with ANFIS prediction model values to verify the accuracy of prediction models.
4. Adaptive Neuro Fuzzy Inference system
Significant deviation is observed in the scatter diagram (Fig. 5) between measured value and Regression predicted value of response variable surface roughness for the same set of input parameters. Therefore adaptive neuro fuzzy inference system is used to establish the better relation between variable input parameters and output parameter.
Adaptive Neuro Fuzzy Inference System (ANFIS) is a fuzzy inference system implemented in the frame work of adaptive networks. Using a given input/output data set, the ANFIS method constructs a fuzzy inference system (FIS) whose membership function parameters are tuned (adjusted) using a back propagation gradient descent and a least-squares type of method. This allows fuzzy systems to learn from the data they are modelling. FIS structure is a network-type structure, which maps inputs through input membership functions and associated parameters, and then through output membership functions and associated parameters to outputs. ANFIS applies two techniques in updating parameters. For premise parameters that define membership functions, ANFIS employs gradient descent to fine-tune them. For consequent parameters that define the coefficients of each output equations, ANFIS uses the least-squares method to identify them. This approach is thus called hybrid learning method since it combines the gradient descent method and the least-squares method.
Knowledge base
Database Rule
based
Input Output
Fuzzification interface
Defuzzification interface
(Crisp) (Crisp)
Decision-making unit
(Fuzzy) (Fuzzy)
Fig.1. Adaptive Neuro-Fuzzy Inference System (Jang, 2004)
ANFIS modelling process starts by obtaining a data set (input–output data pairs) and dividing it into training and testing data sets. The training data set is used to find the initial premise parameters for the membership functions by equally spacing each of the membership functions. A threshold value for the error between the actual and desired output is determined. The consequent parameters are found using the least-squares method. Then an error for each data pair is found. If this error is larger than the threshold value, update the premise parameters using the gradient decent method. The process is terminated when the error becomes less than the threshold value. Then the testing data set is used to compare the model with actual system. A lower threshold value is used if the model does not represent the system Jang (1993).
Rule 1: If (x is A ) and (y is B ) then( z = p x + q y + r ),
Rule 2: If (x is A ) and (y is B ) then( z = p x + q y + r ),
where x and y are the inputs, A and B are the fuzzy sets , z (i = 1,2) are the output within the fuzzy region specified by the fuzzy rules, p, q and r are the design parameters that are determined during the training process.
5. Results and discussion
The experimental data 144 set was collected out of which 108 datasets were utilized as a training data and the remaining 36 data sets as a testing data. The fuzzy inference system was trained up to 100 epochs. To verify the accuracy of prediction other 36 sets were used as a testing data. The training was conducted using Sugeno type fuzzy inference system with 27 rule, three membership function of each input parameter, hybrid of least square – gradient descent learning algorithm and linear output. The membership is categorized in low, medium and high for each input parameter. The analysis of experimental data was conducted on Mat Lab 7.6.0 workstation. The data input to the ANFIS workbench of Mat lab 7.6.0 was in the form of four columns. The first three columns were treated as input and the last column as output data for the training Fuzzy inference system (FIS).
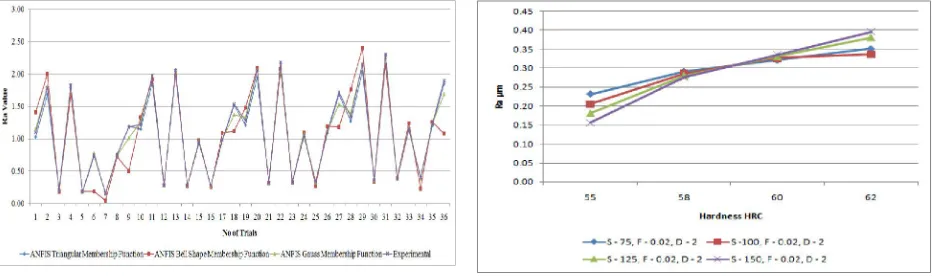
Fig. 2 - 4 show the scatter diagrams of measured values and predicted values of the surface roughness of 36 sets of testing data when triangular, Gaussian, bell shape membership functions are used in ANFIS. Fig. 2 shows that the predicted values of surface roughness with triangular membership function (MF) follow a 450 line very closely as compare to Gaussian (fig. 3) and bell shape membership function (fig. 4). The scatter diagram is also found closely follow the measured data (450 line) with ANFIS triangular membership than regression analysis values (Fig. 5). Predicted values and measured values of the surface roughness of 36 sets of testing data after training by ANFIS with triangular, Gaussian and bell shape membership functions are shown in fig.6. Within experimental testing data set and fuzzy prediction with triangular membership function data very little deviation is observed. The response variable surface roughness exhibits better linearity with respect to input parameters, therefore the prediction accuracy of ANFIS with the triangular membership function is higher than that when Gaussian and bell shape membership function is used.
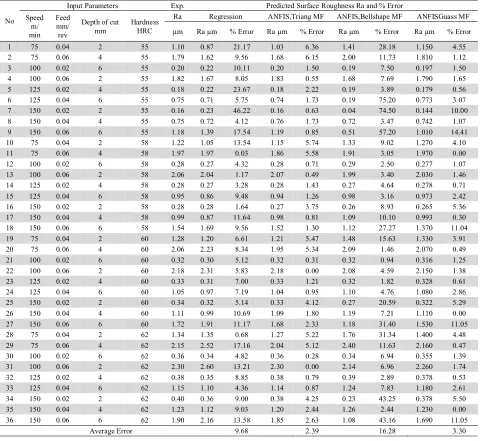
This is also evident from results shown Table 1 in which ANFIS triangular MF, Ra is compared with regression analysis Ra value. Therefore the prediction accuracy of ANFIS with triangular MF is higher as compare to Gaussian, Bell shape and regression prediction models. It is also observed that predicted surface roughness accuracy is 97.61% with triangular membership function with average deviation of 2.39%. Where as in regression analysis the average deviation observed is 9.68 % at 95% confidence level.
Table 1
Experimental, Predicted surface roughness and percentage error
No
Input Parameters Exp. Predicted Surface Roughness Ra and % Error
Speed m/ min
Feed mm/ rev
Depth of cut mm
Hardness HRC
Ra Regression ANFIS,Triang MF ANFIS,Bellshape MF ANFISGuass MF
µm Ra µm % Error Ra µm % Error Ra µm % Error Ra µm % Error
1 75 0.04 2 55 1.10 0.87 21.17 1.03 6.36 1.41 28.18 1.150 4.55
2 75 0.06 4 55 1.79 1.62 9.56 1.68 6.15 2.00 11.73 1.810 1.12
3 100 0.02 6 55 0.20 0.22 10.11 0.20 1.50 0.19 7.50 0.197 1.50
4 100 0.06 2 55 1.82 1.67 8.05 1.83 0.55 1.68 7.69 1.790 1.65
5 125 0.02 4 55 0.18 0.22 23.67 0.18 2.22 0.19 3.89 0.179 0.56
6 125 0.04 6 55 0.75 0.71 5.75 0.74 1.73 0.19 75.20 0.773 3.07
7 150 0.02 2 55 0.16 0.23 46.22 0.16 0.63 0.04 74.50 0.144 10.00
8 150 0.04 4 55 0.75 0.72 4.12 0.76 1.73 0.72 3.47 0.742 1.07
9 150 0.06 6 55 1.18 1.39 17.54 1.19 0.85 0.51 57.20 1.010 14.41
10 75 0.04 2 58 1.22 1.05 13.54 1.15 5.74 1.33 9.02 1.270 4.10
11 75 0.06 4 58 1.97 1.97 0.03 1.86 5.58 1.91 3.05 1.970 0.00
12 100 0.02 6 58 0.28 0.27 4.32 0.28 0.71 0.29 2.50 0.277 1.07
13 100 0.06 2 58 2.06 2.04 1.17 2.07 0.49 1.99 3.40 2.030 1.46
14 125 0.02 4 58 0.28 0.27 3.28 0.28 1.43 0.27 4.64 0.278 0.71
15 125 0.04 6 58 0.95 0.86 9.48 0.94 1.26 0.98 3.16 0.973 2.42
16 150 0.02 2 58 0.28 0.28 1.64 0.27 3.75 0.26 8.93 0.265 5.36
17 150 0.04 4 58 0.99 0.87 11.64 0.98 0.81 1.09 10.10 0.993 0.30
18 150 0.06 6 58 1.54 1.69 9.56 1.52 1.30 1.12 27.27 1.370 11.04
19 75 0.04 2 60 1.28 1.20 6.61 1.21 5.47 1.48 15.63 1.330 3.91
20 75 0.06 4 60 2.06 2.23 8.34 1.95 5.34 2.09 1.46 2.070 0.49
21 100 0.02 6 60 0.32 0.30 5.12 0.32 0.31 0.32 0.94 0.316 1.25
22 100 0.06 2 60 2.18 2.31 5.83 2.18 0.00 2.08 4.59 2.150 1.38
23 125 0.02 4 60 0.33 0.31 7.00 0.33 1.21 0.32 1.82 0.328 0.61
24 125 0.04 6 60 1.05 0.97 7.19 1.04 0.95 1.10 4.76 1.080 2.86
25 150 0.02 2 60 0.34 0.32 5.14 0.33 4.12 0.27 20.59 0.322 5.29
26 150 0.04 4 60 1.11 0.99 10.69 1.09 1.80 1.19 7.21 1.110 0.00
27 150 0.06 6 60 1.72 1.91 11.17 1.68 2.33 1.18 31.40 1.530 11.05
28 75 0.04 2 62 1.34 1.35 0.68 1.27 5.22 1.76 31.34 1.400 4.48
29 75 0.06 4 62 2.15 2.52 17.16 2.04 5.12 2.40 11.63 2.160 0.47
30 100 0.02 6 62 0.36 0.34 4.82 0.36 0.28 0.34 6.94 0.355 1.39
31 100 0.06 2 62 2.30 2.60 13.21 2.30 0.00 2.14 6.96 2.260 1.74
32 125 0.02 4 62 0.38 0.35 8.85 0.38 0.79 0.39 2.89 0.378 0.53
33 125 0.04 6 62 1.15 1.10 4.36 1.14 0.87 1.24 7.83 1.180 2.61
34 150 0.02 2 62 0.40 0.36 9.00 0.38 4.25 0.23 43.25 0.378 5.50
35 150 0.04 4 62 1.23 1.12 9.03 1.20 2.44 1.26 2.44 1.230 0.00
36 150 0.06 6 62 1.90 2.16 13.58 1.85 2.63 1.08 43.16 1.690 11.05
Average Error 9.68 2.39 16.28 3.30
Fig. 2. Scatter diagram of measured value and fuzzy predicted (triangular membership function) surface roughness value
Fig. 4. Scatter diagram of measured value and fuzzy predicted (Bell shape membership function) surface roughness value
Fig. 5.Scatter diagram of Experimental value and Regression predicted surface roughness value
Fig. 6. Correlation between Fuzzy predictions with triangular, bell shape, gauss membership function and experimental value of surface roughness
Fig. 7.Measured surface roughness Ra, at variable cutting speed and material hardness
6. Conclusions
The small range work piece material (Böhler K340) of hardness 55 HRC to 62 HRC has been considered in proposed work, since die steel manufacturing industries prefer to keep hardness within this range. An ANFIS is used to analyse the effect of milling parameters speed, feed, depth of cut and work piece hardness in end milling process. Out of 144 data sets 36 sets of data are used as a testing data. The measured values of surface roughness are compared with ANFIS predicted values. Within ANFIS three membership functions: triangular, Gaussian and bell shape membership function are used for prediction of surface roughness. The surface roughness prediction accuracy by ANFIS with triangular membership function is 97.61%, with the error of 2.39%. The average error by ANFIS using gaussian and bell shape membership function is 3.3% and 16.28% respectively.
References
Altan, T., Lilly, B., & Yen, Y. C. (2001). Manufacturing of dies and molds. CIRP
Annals-Manufacturing Technology, 50(2), 404-422.
Benardos, P. G., & Vosniakos, G.-C. (2003). Predicting surface roughness in machining: a review,
International Journal of Machine Tools Manufacturing, 43, 833 – 844.
Dong, M., & Wang N. (2011). Adaptive network based fuzzy inference system with leave-one-out cross-validation approach for prediction of surface roughness. Applied Mathematical Modelling, 35 (3), 1024–1035.
Dweiri M., Al-Jarrah F., & Al-Wedyan H. (2003). Fuzzy surface modelling of CNC down milling.
Journal of Material Processing Technology, 133, 266 – 275.
Ho W. H., Tsai J. T., Lin B. T., & Chou J. H. (2009). Adaptive network-based fuzzy inference system for prediction of surface roughness in end milling process using hybrid Taguchi-genetic learning algorithm. Expert Systems with Applications, 36, 3216–3222.
Jang, J. S. (1993). ANFIS: adaptive-network-based fuzzy inference system.Systems, Man and
Cybernetics, IEEE Transactions on, 23(3), 665-685.
Jang, J. S. R., Sun, C. T., & Mizutani, E. (2004). Neuro-fuzzy and soft computing, Taipei: Pearson Education.
Kovac P., Rodic D., Pucovsky V., Savkovic B., & Gostimirovic M. (2013). Application of fuzzy logic and regression analysis for modeling surface roughness in face milling. Journal of Intelligent
manufacturing, 24(4), 755-762.
Lo, S. P. (2003). An adaptive-network based fuzzy inference system for prediction of workpiece
surface roughness in end milling. Journal of Materials Processing Technology, 142(3), 665-675.
Lou, M. S., Chen, J. C., & Li, C. M. (1998). Surface roughness technique for CNC End milling.
Journal of Industrial Technology, 15 (1), 1-6.
Rajasekaran, T., Palanikumar, K., & Vinayagam, B. K. (2012). Application of fuzzy logic for modeling
surface roughness in turning CFRP composites using CBN tool. Production Engineering, 5(2), 191
– 199.
Topal E.S. (2009). Role of stepover ratio in prediction of surface roughness in flat milling.
International Journal of Mechanical Sciences, 51, 782 – 789.