R E S E A R C H A R T I C L E
Open Access
Olfactory coding from the periphery to
higher brain centers in the
Drosophila
brain
Yoichi Seki
1,3*, Hany K. M. Dweck
2,3, Jürgen Rybak
3, Dieter Wicher
3, Silke Sachse
3and Bill S. Hansson
3Abstract
Background:Odor information is processed through multiple receptor-glomerular channels in the first order olfactory center, the antennal lobe (AL), then reformatted into higher brain centers and eventually perceived by the fly. To reveal the logic of olfaction, it is fundamental to map odor representations from the glomerular channels into higher brain centers.
Results:We characterize odor response profiles of AL projection neurons (PNs) originating from 31 glomeruli using whole cell patch-clamp recordings inDrosophila melanogaster. We reveal that odor representation from olfactory sensory neurons to PNs is generally conserved, while transformation of odor tuning curves is glomerulus-dependent. Reconstructions of PNs reveal that attractive and aversive odors are represented in different clusters of glomeruli in the AL. These separate representations are preserved into higher brain centers, where attractive and aversive odors are segregated into two regions in the lateral horn and partly separated in the mushroom body calyx.
Conclusions:Our study reveals spatial representation of odor valence coding from the AL to higher brain centers. These results provide a global picture of the olfactory circuit design underlying innate odor-guided behavior.
Keywords:Drosophila melanogaster, Insect olfaction, Antennal lobe, Mushroom body, Lateral horn, Whole cell patch-clamp
Background
A common feature of the olfactory system in insects, mammals, and most other higher animals possessing a sense of smell is an organization where the first order olfactory center (the antennal lobe (AL) and the olfac-tory bulb) comprise spherical neuropils called glomeruli, each of which receives convergent input from olfactory sensory neurons (OSNs) expressing a given odorant receptor (OR) [1, 2]. Most odors are detected by multiple olfactory receptor classes with various binding affinities. This enables animals to discriminate many more odors than the number of receptor classes expressed. However, although one of the fundamental questions in olfaction is to understand the central processing underlying such combinatorial coding, the answer still remains elusive.
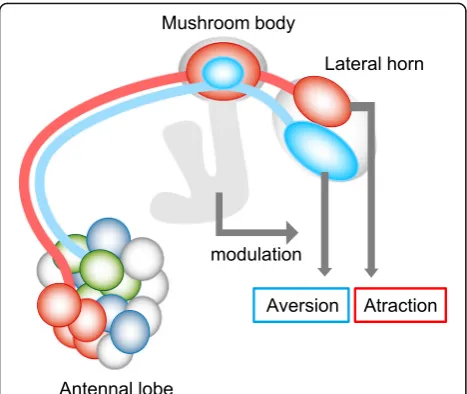
The olfactory system of Drosophila melanogaster has become an excellent model system to study and to under-stand the neuronal processing of olfactory information. The neuromorphological organization of the Drosophila AL circuitry has been extensively studied [3, 4]. The axons of OSNs expressing the same olfactory receptor converge onto one of the 52 AL glomeruli [5–8]. There they form synapses with two types of projection neurons (PNs): one type consists of cholinergic (i.e., excitatory) PNs that mainly receive input in a single glomerulus and relay the information to the mushroom body (MB) calyx and the lateral horn (LH) (Fig. 1a), while the other PN type repre-sents GABAergic (i.e., inhibitory) PNs that mainly innerv-ate multiple glomeruli and send their axons directly to the LH [9–15]. Several studies analyzing the anatomical map of axonal projections of PNs in the MB calyx and the LH have shown less deterministic wiring patterns in the MB calyx and highly stereotyped projection patterns in the LH [11, 13, 16, 17]. This supports the view that the MB is involved in plastic processes such as learning and memory, while the LH is directly linked to innate behaviors [13, 18–22].
* Correspondence:[email protected]
1Present address: Laboratory of Molecular Neuroscience and Neurology,
School of Life Sciences, Tokyo University of Pharmacy and Life Sciences, 1432-1 Horinouchi, Hachioji, Tokyo 192-0392, Japan
3Department of Evolutionary Neuroethology, Max Planck Institute for
Chemical Ecology, Hans-Knöll-Strasse 8, 07745 Jena, Germany Full list of author information is available at the end of the article
a
d
e
f
b
c
The Drosophila and the vertebrate olfactory system share a similar organization from the first order process-ing areas up to higher brain centers [23, 24]. In mice, axonal projections of mitral and tufted cells (equivalent to PNs) from individual glomeruli spread diffusely to the piriform cortex without apparent spatial preference, while they show relatively stereotyped innervation to the cortical amygdala. Since the piriform cortex is associated with olfactory learning, and the cortical amygdala plays an important role in innate behavior, this dichotomous organization resembles the MB and LH structures in insects [23, 24]. Comparing such similarities and differences between vertebrates and insects helps in shed-ding light on general principles of the olfactory system.
How does a fly interpret odor information? Previous studies have revealed a relationship between odor represen-tations in the AL and innate behaviors [25]. Several eco-logically relevant odors use a dedicated pathway leading to an innate behavior, such as the male-produced pheromone 11-cis-vaccenyl acetate (cVA) [26, 27], the mating enhan-cing pheromone methyl laurate [28], CO2[29], acids [30],
ammonia and amines [22], parasitoid odors [31], and the microbial odorant geosmin [32]. In contrast, other odors that also induce innate attraction or aversion are processed via a combinatorial code comprising multiple glomeruli. For instance, a highly attractant mixture induces a specific activation pattern among a combination of glomeruli [33]. Knaden et al. screened 110 monomolecular odorants for their innate odor valence, thereby revealing a valence-related spatial representation often comprising combinator-ial glomerular activation patterns [34]. Although another study demonstrated that individual glomeruli, rather than the entire pattern of active glomeruli, mediate innate olfac-tory attraction and aversion [35], a recent study demon-strated that flies’innate odor responses can be predicted by a model summing normalized glomerular responses, in which each glomerulus contributes a specific, small amount to odor preference [36]. How does such odor information of different innate valence converge and interact at higher brain centers? Without a precise neural map and a func-tional map to place on top of it, it is difficult to assess how glomerular activation patterns would be integrated into higher brain centers.
In this study, we used in vivo whole cell patch-clamp recordings inDrosophila melanogasterand mapped odor response profiles of 71 PNs emerging from 31 glomeruli (covering 60% of ~50 glomeruli in total) to 17 different odors including innately attractive and aversive odors. We addressed the following questions: How is odor in-formation transformed from OSNs to PNs? How is odor information mapped at the level of AL glomeruli and transformed into higher brain centers? And, finally, how is this map related to the fly’s perception and innate behavior?
Results
Many odors are encoded by PNs in a combinatorial manner
We characterized odor response profiles of 71 PNs using in vivo whole cell patch-clamp recordings and subse-quently stained them to identify the innervated glomeru-lus for each individual neuron (Fig. 1b–d). A total of 67 out of the recorded 71 PNs represent uniglomerular PNs that extended their primary dendrites into a single glom-erulus and sent their axons to the calyx of the MB and the LH through the medial antennal lobe tract (mALT) also known as the inner antenno-cerebral tract (IACT) (Fig. 1a). The remaining four PNs innervated either two glomeruli or the region posterior to the AL (data not shown). In this study, we focused our analyses on the 67 uniglomerular PNs innervating one out of 31 glomeruli and therefore covering ~60% of 52 olfactory glomeruli present in the DrosophilaAL. We tested 17 behaviorally relevant monomolecular odors that flies encounter under natural conditions (Additional file 1: Table S1). These odors induce innate attractive or aversive behav-iors, which was earlier demonstrated using diverse behavioral assays, such as the trap assay [34], the T-maze assay [13, 32, 37], or the FlyWalk [38, 39]. We de-fined the 17 odors as attractive or aversive if flies showed attractive or aversive odor-guided behavior toward these odors in at least one of the behavioral assays (see Additional file 1: Table S1).
PNs showed a spike firing increase when activated by an odor (Fig. 1d). To evaluate odor-induced neural activ-ities, we quantified spike numbers during the 1-s odor
(See figure on previous page.)
stimulus as an indicator of odor response intensity. We observed some slight variations in odor-induced temporal firing patterns, such as lengths of firing phases (Fig. 1d, e), but confined our analysis to the odor re-sponse intensity emphasizing rate coding on the system. Temporal patterns might convey critical information on odor stimulus features as demonstrated in other olfac-tory systems [40], but we address this issue later (see the section on Temporal dynamics of odor representation).
There are in total ~150 uniglomerular PNs and 52 glomeruli; the number of PNs innervating the same glomerulus is on average three but is variable between glomeruli in that the glomeruli innervated by narrowly tuned OSNs seem to possess a larger number of PNs, while the glomeruli innervated by broadly tuned OSNs possess a smaller number of PNs [4, 41, 42]. A previous study reported that these sister PNs have highly corre-lated patterns of activity in odor responses as well as spontaneous synaptic inputs [43]. Therefore, it can be assumed that sister PNs should be identical in terms of odor responses, thereby resulting in ~50 PN classes. In the present study, we investigated one PN per fly; there-fore, it was necessary to confirm that odor responses of each PN class would be reproducible under our record-ing conditions, even when recorded in different individ-uals. Indeed we found that odor response profiles of the same PN class (i.e., innervating the same glomerulus) were highly similar (Fig. 1e). The degree of variation in the odor responses of the same PN class is shown in Additional file 2: Figure S1, illustrating the caveat that although the response patterns were similar, there was inter-neuron variability in the magnitude of odor responses among the same class of PNs. Furthermore, we calculated the Pearson’s correlation coefficient based on odor response intensities to 17 odors between the pairs of all PNs and corroborated that the responses in pairs of PNs innervating the same glomerulus were highly correlated (median r= 0.9402, n= 46), while the responses in pairs of PNs innervating different glomeruli were not (median r=–0.0634, n= 2034, p< 10–24, Wilcoxon rank sum test; Fig. 1f ). From this we concluded that characteristics of PNs investigated in different flies could be directly compared.
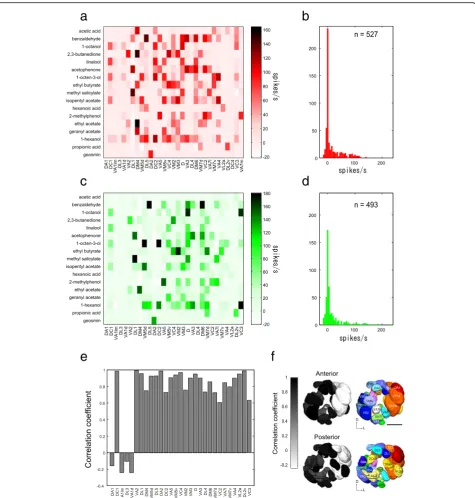
We characterized the odor response profiles of 31 PN classes from 67 PN recordings using in vivo whole cell patch-clamp recordings (Fig. 2a, Additional file 3: Table S2). The data obtained from the different PN classes revealed that many odors activated more than one PN class and most PNs showed an increased spiking rate to more than one odor, except for a few PN classes (Fig. 2a). Hence, many odors are encoded by PNs in a combinatorial manner at an odor concentration of 10–3, thereby confirming previous studies (e.g., [44]). However, strong re-sponses were sparse: by comparing all odor-PN class
pairs, only 16.7% (n= 88/527) exceeded the response of ≥50 spikes during the 1-s odor stimulus and 22.8% (n= 120/527) exceeded the response of 30 spikes/s (Fig. 2b). In addition, a few PN classes did not show any clear re-sponses (rere-sponses were≤10 spikes/s) to any odors in our odor set (e.g., PNs innervating glomeruli DA1 and DL3).
A global picture of odor transformation between OSNs and PNs
How is the odor information transformed from OSNs to PNs? A previous study comparing neurons innervating seven glomeruli revealed that odor tuning curves tend to be broader in PNs than in the corresponding OSNs that innervate the same glomerulus [45]. By contrast, nar-rowly tuned odor response profiles are conserved between OSNs and PNs in the case of dedicated chan-nels mediating odors of specific ecological significance [28, 32, 46]. As these investigations point in different directions, we asked if there is a general rule for odor transformation using our set of 17 odors recorded in PNs innervating more than half of the AL glomeruli.
First, in order to characterize the odor response profiles of OSNs corresponding to our PN recordings, we per-formed single sensillum recordings (SSRs). InD. melano-gaster, 17 types of sensilla have been described, including trichoid, basiconic, and coeloconic types; each houses one to four OSN classes [5, 47]. Via a system-wide SSR screen from all OSN classes [32, 48], we were able to characterize odor response profiles of 29 OSN classes corresponding to 29 of the 31 glomeruli that were covered by our PN recordings (n= 3 for each OSN class, Fig. 2c, Additional file 4: Table S3). Odor response profiles of two OSN clas-ses could not be characterized; one OSN class projecting to DC4 is housed in grooved sensilla that project to the in-terior of the sacculus that are not accessible by SSR [30], and the other OSN class projecting to VA7m has not been assigned to a specific functional class [5]. Our SSRs show that many odors activate more than one OSN class and many OSN classes respond to more than one odor (Fig. 2c). There are thus similar combinatorial patterns as observed for the PN recordings. Only 13.8% of the odor-OSN pairs investigated (n= 68/493) showed ≥50 spikes during the 1-s odor stimulus and 18.6% (n= 90/473) exceeded ≥30 spikes to the set of odors tested in the present study (Fig. 2d).
between the corresponding OSN and PN classes for the 29 glomeruli, where both OSN and PN odor response profiles were available. The correlation was moderately high (r= 0.72 ± 0.38,n= 29, p< 0.01 for the 25 glomeruli except for DA1, VA1lm, DL3, and VA1d, Pearson’s
correlation; Fig. 2e, f ). When the OSN and PN glomeru-lar combinations were randomized, the high correlation was dramatically decreased (r= 0.14 ± 0.038, n= 29, 100 runs). Notably, for the four glomeruli DA1, VA1lm, DL3, and VA1d, a low correlation was found (r= 0.19 ± 0.07,
a
b
c
e
f
d
n= 4, p> 0.1 for all four glomeruli, Pearson’s correl-ation). These glomeruli are innervated by OSNs present in trichoid sensilla, and the specific ligands for the OSNs and PNs targeting these were not included in our odor set [28, 49]. Except for these low response glomeruli, we found a similar range of correlation (r2= 0.37–0.99) in the 25 glomeruli as previously reported (r2= 0.26–0.81 in the 7 glomeruli [45]), supporting the idea that odor response profiles are generally conserved between OSNs and PNs, but likely modulated by lateral interactions between glomeruli [50, 51].
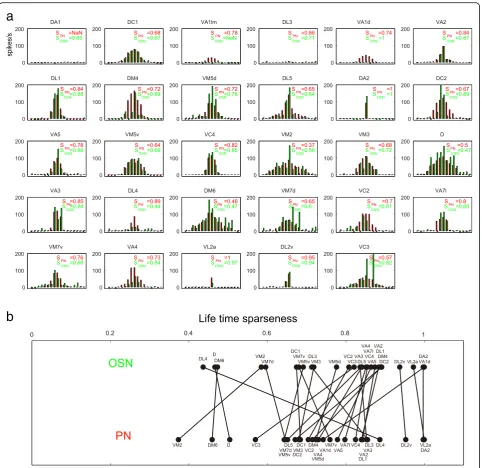
Finally we calculated the lifetime sparseness as a quan-titative measure for the odor tuning curves observed and compared these values between OSNs and PNs innervating the same glomerulus [44, 45] (Fig. 3a). In some glomeruli, odor tuning curves indeed became broader in PNs as compared to the cognate OSNs, whereas in other glomeruli only small changes of odor tuning curves were observed or tuning curves became even narrower (Fig. 3b). These results, contrary to earlier hypotheses, suggest that transformations of odor tuning curves are complex and vary in a glomerulus-dependent manner.
Our results thus provide a global perspective of the transformation in the AL by covering more than half of the glomeruli and their innervating input and output elements. Further, we reveal a non-uniform trend of odor tuning transformation between OSNs and PNs. As in most olfactory studies, a general caveat is that our odor set included only 17 odors, which will inevitably cause some bias. We do, however, know that these odors are behaviorally significant to the fly.
A functional odor representation map in the AL
Our results confirmed that most odors are encoded by a combinatorial pattern involving multiple glomeruli. Each odor can thus be represented in a multidimensional odor space with each glomerular channel representing a single dimension. We proceeded to investigate how odors can be classified by the multiple glomerular channels investi-gated. In our dataset, each odor can be denoted by an odor response vector consisting of the odor response intensities of the 31 PN classes to the odor. A distance of two odors can be evaluated by calculating a distance between the two odor response vectors. In a previous study, a close relationship between odor discrimination and ensemble PN population activity was demonstrated, where the distances between two odors were evaluated by using cosine or Euclidean distances of PN population activities, and where these distances could account for the degree of odor discrimination between odors [21]. These two metrics could thus be suitable for evaluating odor representation of the ensemble PN population ac-tivities. The difference between the two distance metrics
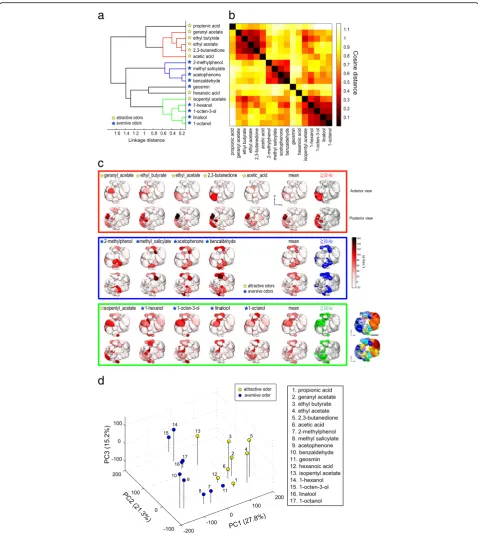
is that the cosine distance is insensitive to amplitude, thereby emphasizing the patterns of PN activities, while the Euclidean distance is sensitive to amplitude, thus emphasizing absolute response intensities. First, we performed a hierarchical cluster analysis for our 17 odors based on response intensities of the 31 PN classes using cosine distances (Fig. 4a, b). We found that three groups of odors were classified (Fig. 4a, b): The first cluster included five odors including three esters, a ketone, and an acid, all of which are attractive to the fly (Fig. 4a; colored in red). The second cluster included four aversive odors that are all aromatic compounds (Fig. 4a; colored in blue). The third cluster included four aversive odors (a terpene and three alcohols) and one attractive odor (an ester) (Fig. 4a; colored in green). The reconstructed activity patterns induced by the odors in the first cluster showed that glomeruli activated by these odors were biased to the medial side of the AL, while those activated by odors in the second cluster comprised several glomeruli located in the dorsal and ventral regions of the AL, and those activated by odors in the third cluster comprised dorsal and anterior-central glomeruli (Fig. 4c). Notably, the odor-specific patterns often comprised neighboring glomeruli. First, we confirmed this by examining the cluster-specific patterns by averaging odor response intensities among the odors within the same cluster and extracting the glomeruli that mainly contributed to forming the cluster-specific patterns (by setting the threshold of the mean spike rate at 30 spikes/s) (Fig. 4c). These patterns were not completely distinct, as there was a small overlap between the different patterns such that the VM2 glomerulus was included in all three patterns, while glomeruli D and DM6 were included in both aversive odor patterns (Fig. 4c). Second, we calculated the correlation between glomerular anatomical distances and the PN odor response similarity using cosine distances for each pair of the 31 glomeruli (Additional file 6: Figure S3). We found a moderate correlation (r= 0.232; p= 4.22 × 10⁻⁷). When the labels between the pairs of glomeruli and their anatomical distances were randomized, this correlation disappeared (r= 0.0038 ± 0.3532, 100 runs). This result suggests that there is an anatomical arrangement, where neighboring glomeruli tend to have similar odor response properties, thus corroborating the clustering arrangement of glomeruli.
based on the low response intensities elicited by these odors (Additional file 7: Figure S4a, colored in red).
We next applied a principal component analysis (PCA) to visualize the 31-dimensional odor space in three dimensions (Fig. 4d). Consistent with the hierarch-ical cluster analysis, we found that attractive and aversive odors clustered separately. The PC1, accounting for 27.8% data variance, roughly separated attractive and aversive odors, as demonstrated by a previous study (Knaden et al. 2012) [34], and the PC2 (21.3%) further
separated the two aversive odor groups. In summary, these results indicate that attractive and aversive odors are significantly separately represented by different combinations of glomeruli (p< 0.001, one-way analysis of similarities, ANOSIM).
Implication of the AL functional map
By measuring the distances among odors in PN neural space, we found three odor clusters that were repre-sented by separate, but partly overlapping, groups of
a
b
a
c
d
b
neighboring glomeruli (Fig. 4a–c). Since we have shown that the odors within the same cluster induced similar glomerular activation patterns among PNs (Fig. 4c), we asked how these odors are chemically related. We obtained physicochemical properties of these 16 odors (except for geosmin) calculated by the Dragon software with 32 descriptors from [52] and applied cluster analysis based on Euclidean distances among the physi-cochemical properties of the odors (Additional file 8: Figure S5a, b). Some pairs or combinations of odors that have similar physicochemical properties clustered closely, such as acetophenone and benzaldehyde, 1-octanol, 1-hexanol, and 1-octen-3-ol (Additional file 8: Figure S5a), also clustered in the PN neural space (Fig. 4a). We performed a PCA to visualize the 32-dimensional physicochemical space in three dimensions (Additional file 8: Figure S5c). This map showed similar but slightly modified distribution of the odors in the physicochemical space compared to those in neural space represented by PN odor responses (Fig. 4d and Additional file 8: Figure S5c). These results suggest that PN neural space largely preserves relationships as mea-sured by physicochemical properties of odors. However, the space was not a simple reflection, but was modified. The degree of similarity of the representations was tested by comparing the correlation between physico-chemical distances and PN response distances for each odor pair (Additional file 8: Figure S5d). We found a moderate correlation between these two parameters (r= 0.518; p= 1.43 × 10⁻⁹). Thus, the physicochemical space is reorganized into PN neural space, where odors are encoded by a combination of AL glomerular groups.
We next addressed the question about how neighbor-ing glomerular groups (defined in Fig. 4c) represent specific odor groups. One hypothesis was that neighbor-ing glomerular groups possess similar odor response profiles because the OSNs projecting to these glomeruli might preserve similar OR protein sequences. Therefore, we examined similarity of OR protein sequences by generating a phylogenetic tree of ORs. The phylogenetic tree of 60 ORs and the distance matrices among these ORs indicated that ORs that project to the same glomeru-lar groups (labeled in the same color) did not cluster but rather spread widely (Additional file 9: Figure S6a, b). Thus, these glomerular groups were not targeted by OSNs expressing similar ORs. Further, the correlation between sequence similarity and glomerular anatomical distances (r = 0.168;p= 0.00360) and the correlation between sequence similarity and PN response distance (r= 0.211; p= 0.000246) were very weak (Additional file 9: Figure S6c, d). These results show that neighboring glomerular groups building up the AL functional map are not targeted by OSNs expressing similar OR protein sequences. This relationship can be partly explained by the fact that ORs
are so divergent that even within the same species sequence similarity does not necessarily indicate that similar odor response profiles are conserved. Taken together, the similar-ity of odor response profiles of the PNs innervating the three AL glomerular clusters can thus not simply be explained by OR protein sequence similarity but might be due to other, so far unknown, factors.
Conversion of the odor representation map from the AL to higher brain centers
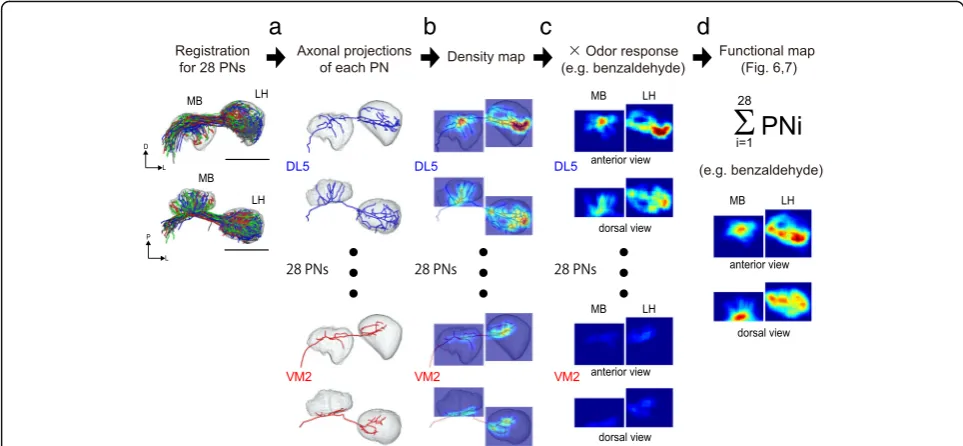
How are the odor representations in the AL transferred to higher brain centers, where both convergence and di-vergence might take place? Jefferis et al. reconstructed the virtual odor response map by combining an anatom-ical map of PN axonal projections with OSN odor responses [11]. However, no study so far has combined an anatomical projection map with actual odor re-sponses of PNs to map odor representation in the MB calyx and LH. In the present study, we mapped virtual odor representation at the input level of the LH and MB by using the actual odor responses and morphology obtained from multiple PN classes.
contributing to representation of attractive odors in the first cluster of Fig. 4a (colored in red) innervate the posterior-dorsal region of the LH (except for the VM7d PN), while the PN classes in the second and third clusters (colored in blue and green respectively) mainly innervated the more ventral region with smaller bifur-cated branchings in the medio-dorsal region in the LH (Additional file 10: Figure S7, Additional file 11: Figure S8). As we failed to reconstruct the two PN classes from the first cluster glomerular groups (VA2 and VM3), we com-pared with VA2 and VM3 PN projection patterns estab-lished in the previous study [11] and confirmed that these PN classes project to the posterior-dorsal region of the LH, supporting this tendency. Although the dataset is limited, these results suggest that there might be a loosely hard-wired pathway from the glomerular groups in the AL to the LH, while the AL map is represented in a more distributed fashion in the calyx of the MB.
Odor valence segregation and integration in the MB and LH
Next, we weighted our measured odor response inten-sities on the density maps of axonal projections of the 28 PNs (Fig. 5c). Then, we summed odor responses from the 28 PN classes and generated a virtual activity map for each odor (Fig. 5d).
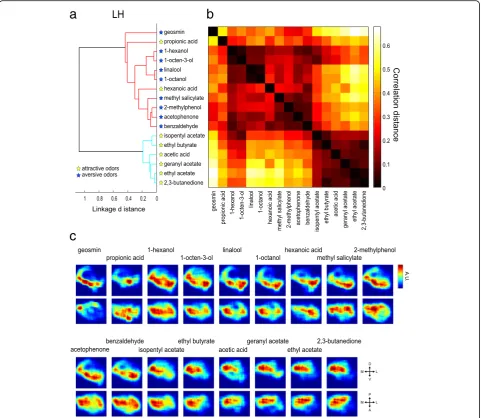
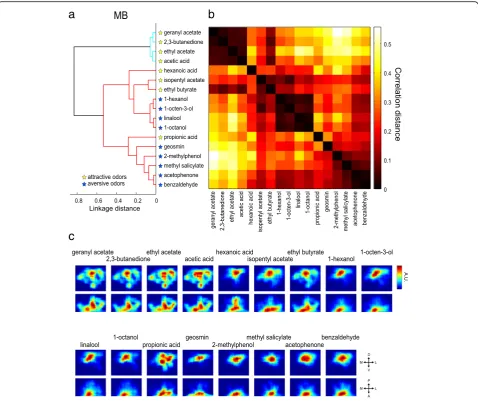
Virtually reconstructed summed responses of the 28 PN classes for each odor are shown in Fig. 6 (in the LH) and Fig. 7 (in the MB calyx). We applied a hierarchical cluster analysis to evaluate the similarity of these spatial
odor response patterns in the LH and the MB calyx respectively, using correlation distances of the recon-structed activity maps between two pairs of odors (Figs. 6a, b, 7a, b). This method was also used to evalu-ate the similarity of a three-dimensional density map in [11]. The correlation distance, which is insensitive to intensity, was deemed suitable for comparing patterns of regional activities.
Several previous studies suggested that the LH could be directly linked to innate behaviors [13, 18, 20–22]. Thus, reconstructing the odor representation map in the LH is key to understanding how flies perceive odor valence. Our reconstructed functional maps demon-strated that the attractive and aversive odors were classi-fied into two separate clusters in the LH (Fig. 6a, b). Aversive odors activated ventral regions, while attractive odors activated posterior-dorsal regions (Fig. 6c). These results suggest that odor valence is integrated into two separate regions in the LH. The exceptions were hexa-noic acid and propionic acid, which had been catego-rized as attractive odors in behavioral assays [34] but grouped with the aversive odors (Fig. 6a). This is likely due to our under sampling of acid responding glomeruli (ionotropic receptor projected glomeruli [7]) in the present study, as revealed by rather small total activities induced by these two odors (Additional file 5: Figure S2). Our results further showed that the two aversive odor groups separated in the representations in the AL con-verged to the ventral regions of the LH. This area might
a
b
c
d
thus form an integration site for information brought by these aversive odors.
The MB, on the other hand, plays a role in circuit plasticity and is involved in learning and memory. Several studies have indicated that the MB is dispensable for innate odor-guided behavior [18–21]. The recon-structed activity maps of the MB calyx revealed that the odors were classified into two clusters; one including exclusively attractive odors and the other including both attractive and aversive odors (Fig. 7a, b). In the MB, attractive odors in the first cluster activated the entire calyx regions including ventral portions, while aversive odors in the second cluster activated more focal regions
near the base of the calyx (Fig. 7c). Interestingly, a gradual transition was observed from broad to focal activation patterns in the second cluster, corresponding to an attractive-to-aversive transition. These results sug-gest that there might be a concentric organization, where the peripheral region of the calyx contributes to attractive behavior while the focal region contributes to aversive, and thereby also suggest that the MB might play an auxil-iary role underlying innate odor-guided behavior.
Finally, to address the question of whether labeled line pathways and combinatorial pathways that carry infor-mation of similar valence converge in higher brain centers, we focused on the aversive pathway, as our
a
c
b
coverage of attractive odor processing channels was less comprehensive than that of aversive ones. Geosmin is processed via a dedicated pathway through the DA2 glomerulus, while eight other aversive odors (benzaldehyde, acetophenone, methyl salicylate, 2-methylphenol, 1-octanol, linalool, 1-octen-3-ol, and 1-hexanol) are represented by combinatorial activation of glomeruli [32, 34] (Fig. 2a, Additional file 5: Figure S2a). In the LH, the eight aversive odors activated the ventral part, while geosmin activated a ventral-posterior region. Although the regions activated by the eight odors extended to the entire region of the ventral LH, there was an overlap at the ventral-posterior region (Fig. 6c). This suggests that the activation patterns of these two different types of aversive odors partially overlap in the LH. In the MB, the geosmin activation pattern was more
similar to other aversive odors (Fig. 7c). Our results thus show that the geosmin-activated regions in the LH and the MB calyx are not isolated, but overlap to some degree with regions activated by other aversive odors (Figs. 6c, 7c).
Temporal dynamics of odor representation
Although previous studies demonstrated that not only spatial but also temporal patterns of the neural code are essential for fine odor discrimination [40], we so far employed only spike numbers during 1-s odor stimuli as an indicator of odor response intensity. Now, we asked whether temporal patterns of PN responses add add-itional coding capacity to the system under study or not. First, we examined how odor representations evolve in the ensemble PN population over the course of the odor
a
c
b
presentation by virtually assembling 31 PN class responses to 17 odors. We described trajectories of three representative odors (ethyl butyrate, acetophenone, and 1-octen-3-ol) by reconstructing PN population responses and visualizing them in a three-dimensional PC space (Additional file 12: Figure S9a). The trajectories showed that odor representations developed rapidly to reach a peak firing rate at 150 ms and slowly returned to the baseline. Next, we reconstructed trajectories for all odors in a two-dimensional PC space. Odors were rapidly separated with a similar pattern as observed by the clustering in Fig. 4a (Additional file 12: Figure S9b). Inter-odor distances between all odor pairs showed that separation peaked at 150 ms and gradually declined to the baseline at 2 s after the onset of odor stimulation. (Additional file 12: Figure S9c). Since previous studies have revealed that slow temporal patterns through de-correlation of mitral cells ensemble activities represent the key factor for fine odor discrimination (e.g., [53]), we examined developing changes of distance matrices during the course of olfactory stimulation. Distance matrices retained a similar degree of distinction during the 1-s odor stimulus, and the pattern disappeared at 1 s after the odor offset (Additional file 12: Figure S9d). We also confirmed similar time course changes in the dis-tance matrices mapped on the LH and MB (Additional file 12: Figure S9e, f ). Taken together, these results sug-gest that in the Drosophila AL, slow temporal patterns may not contribute to fine odor discrimination through de-correlation ensemble representation, as has been shown in the zebrafish olfactory system [53]. Therefore, analyzing response intensity during 1-s odor stimulation was a suitable compromise to evaluate odor representa-tion without losing critical informarepresenta-tion for fine odor discrimination. However, note that we could not address another important temporal factor, “oscillatory syn-chrony,”which was considered less prominent compared to other olfactory systems but demonstrated in a previous study in the Drosophila AL [54], as precise synchronization must be analyzed by local field potentials (LFPs) being recorded simultaneously as a reference.
Discussion
We used in vivo whole cell patch-clamp recordings and stainings, mapped odor response profiles of 31 glomeru-lar channels, and followed the flow of information into higher brain centers. We characterized odor response profiles of OSNs and PNs in ~30 glomeruli and found that the majority of odors are indeed represented in multiple glomeruli in a combinatorial manner (Fig. 2). Odor representation is thus largely combinatorial, while a few single odors highly important for survival and/or reproduction are processed through dedicated pathways.
This organization enables the fly to discriminate a vast number of different odors, while maintaining a very robust and specific odor processing system for a few crucial, directly fitness-related odors. Our results show a rather conservative transformation between OSNs and PNs (Fig. 2) [55, 56]. Earlier studies focused on a few specific glomeruli and generalized the results to the entire system [44, 45]. Our study expands the scale to more than half of the glomerular channels and demon-strates that transformation of odor tuning curves is not homogeneous but glomerulus-dependent (Fig. 3).
Although our PN samplings were comprehensive, covering ~60% of glomerular channels, the depth of rep-lication (the number of samples for each glomerulus) was moderate, as it was limited by technical difficulties. Therefore, inter-individual variation that may exist both in physiological odor responses (Additional file 2: Figure S1) and morphological axonal projection (Additional file 10: Figure S7) should be taken into account. However, our efforts to minimize such biases by the selection of analytical methods and application of registration tech-niques minimize ambiguity.
Whether a topographical representation that reflects the feature of olfactory stimuli is present is a central issue for olfactory coding. Interestingly, we found a few glomerular groups that are relevant for odor valence representation, often comprising neighboring glomeruli (Fig. 4). This organization tempts us to postulate that through evolution these glomeruli have divided from the same ancestral glomerulus, or one glomerulus has derived from the neighboring glomerulus. However, we found no evidence that these neighboring glomeruli are targeted by OSNs expressing phylogenetically related ORs (Additional file 8: Figure S5). Future studies should address the developmental mechanisms by which a glomerulus can be divided, which might provide an explanation as to why the AL has a topographical map.
Odor valence thus seems to be represented by different clusters of glomeruli in the AL. How is this information transformed into higher brain centers? When we reconstructed a functional map combining the anatomical map with odor response characteristics, we discovered segregated odor valence representation in the LH and partly in the MB calyx.
Other than pheromones, dedicated pathways processing aversive CO2or acids via glomeruli V and DC4
respect-ively have been shown. These two pathways converge to the medial side of the LH, while information regarding ammonia and amines that are attractive to flies is proc-essed via the VM1 glomerulus, for which PNs converge in the lateral posterior part of the LH [22]. Our group recently showed that dedicated pathways processing aversive geosmin and parasitoid odor information via the DA2 and DL4 glomeruli respectively converge onto very similar regions in the LH [31]. These odors are ecologically important for flies and directly trigger specific behaviors via dedicated neural pathways.
On the other hand, it is largely unknown how more general odors that induce innate odor-guided behavior are represented in the LH. A recent study revealed a topographical LH map relating to hedonic odor valence by imaging inhibitory PNs and ventro-lateral protocereb-rum (vlpr) neurons (third order neurons projecting to the vlpr from the LH) [13]. However, how odor informa-tion carried by excitatory PNs is represented in the LH has remained unknown. Our results for the first time show that information conveyed by excitatory PNs con-verges into two regions that could be integration sites for attractive and aversive odors. Attractive odor stimu-lation activated the posterior-dorsal region of the LH (Fig. 6). This region appears to correspond to the fruit odor processing region shown in [11]. Conversely, aver-sive odors activated the ventral regions of the LH (Fig. 6). We found that two categories of aversive odors, repre-sented in different clusters of AL glomeruli (Fig. 4a, c), activated largely overlapping regions in the ventral part of the LH (Fig. 6c). Furthermore, the labeled line pathway mediating geosmin aversive information also activated the ventral region of the LH, showing a partial overlap with the activation pattern for other aversive odors that are represented by combinatorial activation of glomeruli. Third order neurons that convey information from this region to the vlpr were also demonstrated in recent studies [12, 13]. In another study, third order neurons conveying attractive information from the dorsal region of the LH to the superior medial protocerebrum were found [63].
The MB consists of numerous Kenyon cells (KCs), among which combinatorial activation patterns of PNs are converted into a sparse representation [64, 65]. Since the connection patterns between PNs and KCs are likely to be random, there would be no hard-wired circuit connecting specific glomeruli to specific KCs [16, 66]. However, a recent study suggests that a KC receives inputs from several different glomeruli and integrates activation evoked by similar odors [67]. In addition, a zonal organization has been found in the MB. The different zones are innervated by different types of KCs,
and corresponding coarse regional PN projection pat-terns were also revealed [15, 17]. Our results revealed that odor valence segregation is partly observed also in the MB calyx (Fig. 7). The role of the MB for innate odor preference is less understood compared to its well-established role for olfactory learning. A previous study demonstrated that the MB is relevant for innate odor at-traction, while it is irrelevant for innate odor aversion [18, 68]. Our results suggest that the MB is also able to partly contribute to categorize hedonic odor valence via a concentric organization. Such an organization in the calyx of the MB has already been observed at neuroana-tomical levels, where it is proposed that the termination zones schematized as concentric circles from the inner to outer MB calyx correspond to a progression from the anterior-ventral to posterior-dorsal LH [11, 15]. Recent studies demonstrated that ensemble activity of MB output neurons can determine odor-guided behavior and that response profiles of these neurons are individually modulated, possibly by experience [69–71]. It is not clear how the odor map revealed in the MB calyx is read out by different types of KCs and then by the MB output neurons, but the MB output should be important to modulate innate odor-guided behavior by associative learning. Taken together, our results suggest that there is an organization in the LH and MB that allows the insect to categorize odor valence information. Beyond these anatomically defined areas, positive and negative odor information has to be integrated and put into the context of other sensory input and of the physiological state of the insect. This integration can then form the basis for a behavioral decision.
representation patterns at the PN level do not change, flies can display an opposite behavior. This could be ex-plained by the role of the MB. MB output neurons could overwrite the read-out from the LH [69]. Although our results reveal a snapshot of activation patterns at a single concentration and innate state, they provide the basis for the circuit design underlying innate odor-guided behavior. Further studies will show how these basic olfactory circuits are modulated by experience, physio-logical state, and multimodal sensory input.
Conclusions
A fundamental question in olfactory coding is to under-stand how odor information initially separated by mul-tiple receptor-glomerulus channels is integrated and read out by higher brain centers. In addition, little is known about how odor maps at higher processing centers are related to the animal's perception and innate behavior. The present study provides a major break-through to answer these questions, by mapping the olfactory information flow from the periphery to higher brain centers in unprecedented detail, using the Dros-ophila olfactory system. We found that attractive and aversive odors were separately represented by different clusters of glomeruli in the AL, and these representa-tions were segregated into two different regions in the LH and partly separated in the MB. Since it has been increasingly evident that the anatomical organization of the olfactory system in mice has a similar architecture to
that of the Drosophilaolfactory system, our results may provide an important stepping stone toward understand-ing the common principle of the olfactory circuit design underlying innate olfactory behaviors.
Methods
Fly stocks
Flies were maintained on conventional medium
under a 12-h light/12-h dark cycle at 25 °C. Adult females 1–3 days after eclosion were used in all ex-periments. Fly lines used in this study were
Canton-S (n= 42), GAL4-GH146/UAS-mCD8GFP (n= 25),
GAL4-NP5221/UAS-mCD8GFP (n= 3), and
GAL4-NP7217/UAS-mCD8GFP (n= 1).
In vivo whole cell patch-clamp recording
Patch-clamp recordings were performed with the same configuration as previously described (Seki et al. 2010) [72], except that an in vivo preparation was used and odor stimuli were given (Fig. 1b). The in vivo prepar-ation was similar to the one used in imaging experi-ments (Stökl et al. 2010) [33]. Briefly, flies were anesthetized on ice and fixed in a Plexiglas stage using a copper plate (G220-5, Athene Grids). The neck was fixed with a minutien pin (#26002-10, Fine Science Tools, Foster City, CA, USA), and the back of the head was glued with colophony resin (Royal Oak Rosinio, Royal Oak, Germany) to prevent moving of the head. The antennae were pulled forward with a fine metal wire (Rediohm-800, HP Reid Co., Palm Coast, FL, USA). After a few hours, plastic cover glass (L4193, Plano-em, Germany) with a hole covered by stretched parafilm was put on the head. The parafilm was ripped to expose the surface of the head, and the gap between the parafilm and the head capsule was filled with two component silicone (KWIK-SIL, World Precision Instruments, Sarasota, FL, USA). Then the head capsule was removed to expose the brain. At the same time, the brain was immersed with ringer solution containing (in millimoles) 130 NaCl, 5 KCl, 2 MgCl2, 2 CaCl2, 36 sucrose, and 5
4-(2-hydroxyethyl)-1-piperazineethanesulfonic acid (HEPES); pH 7.3. Tracheae and muscles were removed for the both AL to be exposed, and the neurolemma was carefully removed with fine forceps. Cell bodies of PNs were visual-ized under an infrared DIC microscope (BX51WI Olympus, Hamburg, Germany) (Fig. 1c). Whole cell recording was made from a cell body of PN with a glass pipette containing the internal solution: (in millimoles) 140 potassium aspar-tate, 10 HEPES, 1 KCl, 4 Mg-ATP, 0.5 Na3GTP, 1 ethylene
glycol-bis(β-aminoethyl ether)-N,N,N',N'-tetraacetic acid (EGTA), and 1 Lucifer yellow CH or 7 biocytin; pH 7.3. The membrane potential was recorded in current clamp mode using an EPC 10 patch-clamp amplifier (HEKA Elektronik, Lambrecht, Germany) with Patch-master software. The
membrane potential was kept around–50 mV when inject-ing a small current if necessary. One neuron per brain was stimulated, recorded, and stained.
Odor stimulation
Odorants were diluted (10–2 v/v) except for geosmin (mostly 10–3, only three PNs were tested with 10–2and they did not respond to 10–2geosmin) in H2O (for acetic
acid, propionic acid) or mineral oil (for all other odors). Odors used for PN recordings were acetic acid, benzal-dehyde, 1-octanol, 2,3-butanedione, linalool, acetophe-none, 1-octen-3-ol, ethyl butyrate, methyl salicylate, isopentyl acetate, hexanoic acid, 2-methylphenol, ethyl acetate, geranyl acetate, 1-hexanol, propionic acid, and geosmin. We tested all PNs with all odors and three controls (mineral oil, H2O, empty pipette),“20 stimuli as
one set of stimuli,”at least one time with the fixed order as written above (i.e., acetic acid, benzaldehyde… geos-min, mineral oil, H2O, empty pipette) and proceeded the
second round of stimuli until the recording stopped. If we lost recording without completing the whole odor set, we did not use those data for analysis and did not try recording another PN in the same preparation. The stimulus duration was 1 s, and the stimulus inter-val was ~40 s. 10μl of the diluted odors was put on the filter paper (Whatman), placed inside a glass Pasteur pipette. A stimulus controller (Stimulus Controller CS-55, Syntech, Kirchzarten, Germany) was used to produce a continuous airstream (1.2 L/min), which was joined with the airstream (0.12 L/min) from an empty pip-ette at 8 cm from the end of the delivery tube, and to switch to the stream from an odor stimulus pipette (0.12 L/min), which was joined to the continuous air-stream at 6.5 cm from the end of the delivery tube. The end of the delivery tube, which was 5 mm in diameter, was placed 8 mm from the fly. The applied odor stimuli were thus additionally diluted approximately 10 times when merging to the continuous airstream.
Single sensillum recording (SSR)
SSR measurements were performed as described previ-ously [32]. The recording electrode and the reference electrode (inserted into the eye) were positioned under a
microscope (Olympus BX51W1). The recording
electrode was positioned by using a motorized, piezo-translator-equipped micromanipulator (Märzhäuser DC-3 K/PM-10, Wetzlar-Steindorf, Germany). The signal was amplified (Syntech UN-06), digitally converted (Syntech IDAC-4), and finally visualized and analyzed by using Syntech AutoSpike v3.2.
Morphological analysis
To visualize glomerular structures and regions in the higher brain centers, nc82 immunostainings were
performed as previously described (Seki et al. 2010) [72]. Additionally, biocytin-injected neurons were labeled with (1:500) Alexa Fluor 555 streptavidin (S-32355, Invi-trogen), which was incubated with the secondary anti-body for nc82, (1:200) goat anti-mouse Alexa Fluor 633 (A21052, Invitrogen). Images were taken with a Zeiss LSM510 META confocal microscope (Carl Zeiss, Jena, Germany). Axons of the stained PNs were reconstructed using the Amira 4.1.1 or 5.3.3 software (Visage Imaging, Berlin, Germany) as previously described [72]. For neuron reconstruction the Skeleton plugin [73] of Amira was used. This module allowed the tracing process and created vertex models in which neurites were approxi-mated by cylinders of a particular diameter. The inner-vated glomeruli were identified based on the glomerular map in [5], except that the“Vm7” and the unnamed“1” glomerulus in [5] were called “Vm7d” and “Vm7v” re-spectively, according to the recent nomenclature [14].
Registration method for PN axonal projection
Axonal projections of a single PN were reconstructed, and the MB calyx and LH structures were segmented in each brain. The MB calyx and LH were registered to a template brain using non-linear surface-matching methods. Image stacks were imported to Amira 5.6 (Fei), and neuronal ar-borizations and neuropils were manually segmented. For registration of datasets a label template of the central brain (MB calyx and LH) was chosen out ofn= 58 prepa-rations as described in [74]. The warping of segmented la-bels of the MB calyx and LH onto the template was done in a two-step process: an affine transformation with 12 de-grees of freedom (DOF) followed by an elastic registration using modules of Amira. The calculated transformation matrix was applied to the neuron reconstructions that were thus transformed to the template reference space.
Data analysis
Response intensity
PN responses were evaluated using spike numbers dur-ing the 1-s odor stimulus (0.05 s after the onset of stim-uli to 1.05 s; 0.05 s was an approximate delay for the odors to reach the antennae and pulps from the onset of the stimulus pulse). Spike numbers used for analysis were made by subtraction with the control stimulus (ei-ther mineral oil or H2O, depending on the solvent for
Lifetime sparseness
The lifetime sparseness (see Fig. 3) was calculated to quantify the selectivity of a neuron’s odor response pro-file [45]:
S¼ 1 1−1
N
!
1− XNj¼1rj=N
2
= XNj¼1r2 j=N
where N= number of odors (17 in this study), and rjis the odor response intensity of the neuron to odorj. Any values of rj <0 were set to zero before computing life-time sparseness.
Density map
The density maps of axonal projections of PNs in the MB calyx and LH were generated similarly to the process in [11]. (See Fig. 5, Additional file 11: Figure S8.) Each neuron was divided into segments of length equal to 0.5 μm by setting the interval of vertices as 0.5μm. To generate a density map in the space of the MB calyx and LH, the voxel size was set to 1 μm3. The central points of each segment (vertex) were binned onto the grid of 135 × 135 × 105 voxels. A three-dimensional histogram was generated for each PN axonal innervation in the MB calyx region (55 × 46 × 32 μm) and the LH region (52 × 53 × 43μm) by counting the vertices in each 1 μm3 voxel. Then the histogram was filtered three dimensionally with a boxcar filter (9 pixels). To visualize a two-dimensional projection, each column of voxels was integrated along the projection axis.
Functional map
We generated the predicted odor response map as a func-tional map in the MB calyx and LH. (See Figs. 6 and 7). On the basis of density maps generated for each PN class, the odor response intensity value (any values <0 were set to zero) was multiplied by the density value and then summed with all the PN classes. The similarities of functional maps of each odor were compared by using cluster analysis with correlation distances and Ward’s classification method.
Physicochemical analysis
Physicochemical properties of 16 odors calculated with a set of 32 descriptors using Dragon were obtained from [52].
Phylogenetic tree and odorant receptor sequence analysis Sixty aligned OR amino acid sequences ofD. melanoga-ster were obtained from the Database of Olfactory Re-ceptors (DOR; http://caps.ncbs.res.in/DOR/index.html) [75]. The distance matrix and the phylogenetic tree were generated using Molecular Evolutionary Genetics Analysis version 7 (MEGA7) [76]. Analyses were con-ducted using the Jones-Taylor-Thornton (JTT)
matrix-based model [77]. The analysis involved 60 amino acid se-quences. All positions containing gaps and missing data were eliminated. The evolutionary history was inferred using the neighbor-joining method [78]. The percentage of replicate trees in which the associated ORs clustered to-gether in the bootstrap test (1000 replicates) is shown next to the branches [79]. The tree is drawn to scale, with branch lengths in the same units as those of the evolution-ary distances used to infer the phylogenetic tree.
The PCA and hierarchical cluster analysis were per-formed using MATLAB. Hierarchical cluster analysis was performed using cosine distance (Fig. 4a), Euclidean distance (Additional file 7: Figure S4, Additional file 8: Figure S5, Additional file 9: Figure S6) or correlation dis-tance (Figs. 6, 7 and Additional file 11: Figure S8), and Ward’s classification method. One-way ANOSIM (Bray-Curtis similarity, sequential Bonferroni correction for ties, 10,000 permutations) was done with Paleontological STatistics (PAST) software (https://folk.uio.no/ohammer/ past/).
Data are given as “mean ± s.d., n number”, unless otherwise noted.
Additional files
Additional file 1: Table S1.Odor list. (DOCX 63 kb)
Additional file 2: Figure S1.Odor response intensity of all individual PNs. Odor response intensity of each PN to 17 odors for each glomerulus, calculated by using spike frequencies during a 1-s odor stimulation period.nindicates the number of PNs recorded for each glomerulus. Odor responses of different PNs within the same PN class are indicated by different colors. The order of the 17 odors is arranged as in theinset on thebottom rightfor all graphs. (PDF 822 kb)
Additional file 3: Table S2.Odor responses of 31 PN classes to 17 odors. (XLSX 18 kb)
Additional file 4: Table S3.Odor responses of 29 OSN classes to 17 odors. (XLSX 17 kb)
Additional file 5: Figure S2.Similar spatial odor representation patterns between PNs and OSNs in the AL. (a) Spatial response patterns for each odor are reconstructed on a template AL using odor response intensity of the 31 PN classes. (b) Spatial response patterns for each odor are reconstructed on a template AL using odor response intensity of the 29 OSN classes. In each map, the AL is viewed from anterior (top) and posterior (bottom). Each glomerulus name is indicated on the template AL (bottom right). Scale bars = 20μm. (PDF 105472 kb)
Additional file 6: Figure S3.Correlation between glomerular distance and PN odor response similarity. Scatterplot of anatomical glomerular distance versus PN response distance for all 465 pairwise combinations of the 31 glomeruli. Pairwise distance of PN response distance was calculated based on odor response of 31 PN classes using cosine distances for 17 odors. (PDF 740 kb)
Additional file 8: Figure S5.Physicochemical properties of odors partly correlate with AL odor representation. (a) Hierarchical cluster analysis for the 16 odors (except for geosmin, due to no data available) based on the Euclidean distances between physicochemical properties of the 16 odors. Glomerular names are colored according to the three clusters found in Fig. 4a, to facilitate comparison between these two analyses. (b) A complete distance matrix measured with Euclidean distances for 16 odors based on physicochemical properties. Each axis of the matrix is ordered as in (a). (c) Principal component analyses for the 16 odors based on physicochemical properties. The percentages of variance accounted by each PC component are shown on each axis. (d) Scatterplot of physicochemical distance versus PN response distance for all 120 pairwise combinations of the 16 odors. Pairwise distance of odors based on PN odor responses was calculated as in Fig. 4b. (PDF 762 kb) Additional file 9: Figure S6.Sequence similarity of odorant receptors (ORs) is not the main factor to determine odor response similarity in the AL glomerular clusters. (a) Phylogenetic tree ofD. melanogaster60 ORs. The alignment data of the 60 ORs were obtained from the Database of Olfactory Receptors (DOR; http://caps.ncbs.res.in/DOR/index.html), and the phylogenetic tree of the 60 ORs was calculated according to [75]. The percentages of replicate trees in which the associated ORs clustered together in the bootstrap test (1000 replicates) are shown next to the branches. Glomerular name is indicated after the OR name if it is identified in the established OR-glomerulus map [5]. Glomerular names are colored according to the three glomerular clusters detected in Fig. 4c. (b) A complete distance matrix measured with Euclidean distances for 25 OR sequence similarities. (c) Scatterplot of sequence distance versus anatomical glomerular distance for all 300 pairwise combinations of the 25 ORs and the 25 glomeruli. (d) Scatterplot of sequence distance versus PN response distance for all 300 pairwise combinations of the 25 ORs and the 25 glomeruli. Pairwise distance of PN response distance was calculated based on odor response of 25 PN classes using cosine distances for 17 odors. Multiple receptors co-expressed in the same OSN class and project to the same glomerulus (i.e., DL3 and DL4) have been excluded in these analyses (c, d). (PDF 842 kb)
Additional file 10: Figure S7.Axonal projections of PNs in the LH and in the MB. (a) The position of glomeruli are mapped on a template AL. (b) Reconstructed axonal projections in the MB calyx and LH. The PNs are labeled with the same color scheme as in (a). (c) Individual traces of reconstructed axonal projections for the 28 PN classes after registration to the template MB calyx and LH. PNs and glomeruli are colored according to the clusters in Fig. 4c, except for VM2 (magenta), which is included in all the three clusters, and D, DM6 (cyan), which are included in the second and third clusters. Anterior view (top) and dorsal view (bottom). Scale bars = 50μm. (PDF 43110 kb)
Additional file 11: Figure S8.Axonal density maps of PNs in the LH and in the MB. (a) Hierarchical cluster analysis for 28 PN classes based on the correlation distances between axonal density maps in the LH. (b) Hierarchical cluster analysis for 28 PN classes based on the correlation distances between axonal density maps in the MB. (c) The density maps of axonal projections of each PN class are visualized two-dimensionally in the LH. The pseudo color for each PN is scaled respectively. (d) The density maps of axonal projections of each PN class are visualized two-dimensionally in the MB. The pseudo color for each PN is scaled respectively. (PDF 755 kb)
Additional file 12: Figure S9.Temporal dynamics of odor
representation. (a) Represented trajectories of PN ensemble activities for three odors (red: ethyl butyrate,blue: acetophenone,green: 1-octen-3-ol) visualized in the three-dimensional PC space. Color is matched with Fig. 4a. Each trajectory is reconstructed with 100-ms steps indicated with circles,andfilled circlesindicate 150, 450, and 950-ms time frames. (b) Two-dimensional view of the odor response trajectories for all odors. The odors within the same cluster (colored inred,blue,green, andgray) in Fig. 4a have similar trajectories compared to those between different clusters. (c) Inter-odor distances between pairs of odors measured by ensemble PN odor responses with Euclidean distances. (d) Distance matrices of odor representations by PNs at different time frames. Odors are ordered in the same order as in Fig. 4b, to facilitate comparison to the pattern reconstructed with the mean firing rate for 1-s odor stimuli.
Clustering of odors remain largely distinct during 1-s odor stimulus but disperse at 2 s. (e), (f) Distance matrices of odor representations in the LH (e) and MB (f) at different time frames. Odors are ordered in the same order as in Fig. 6b (for LH) and Fig. 7b (for MB) to facilitate comparison to the pattern reconstructed with the mean firing rate for 1-s odor stimuli. (PDF 994 kb)
Abbreviations
AL:Antennal lobe; KC: Kenyon cell; LH: Lateral horn; MB: Mushroom body; OR: Odorant receptor; OSN: Olfactory sensory neuron; PN: Projection neuron; SSR: Single sensillum recording; vlpr: Ventro-lateral protocerebrum
Acknowledgements
This study was supported by the Max Planck Society (Max-Planck-Gesellschaft). We thank Johanna Langner for assisting with morphological reconstructions. We thank Silke Trautheim and Sabine Kaltofen for excellent technical assistance. The nc82 antibody generated by E. Buchner was obtained from the Developmental Studies Hybridoma Bank, developed under the auspices of the National Institute of Child Health and Human Development (NICHD) and maintained by the University of Iowa.
Funding
This study was funded by the Max-Planck-Gesellschaft (to BSH) and the Bundesministerium für Bildung und Forschung (to SS). The funders had no role in study design, data collection and interpretation, or the decision to submit the work for publication.
Availability of data and materials
The values of odor response intensity for PNs and OSNs used and analyzed in this study appear in Additional file 3: Table S2 and Additional file 4: Table S3 respectively. The other datasets used and/or analyzed during the current study are available from the corresponding author on reasonable request.
Authors’contributions
YS helped with study conception and design, performed whole cell patch-clamp experiments, helped with acquisition of data and with analysis and interpretation of data, and drafted and revised the article; HD performed SSR experiments and helped with data acquisition and data analysis and interpretation; JR performed morphological analysis, analyzed and interpreted data, and revised the article; DW helped with study conception and design, interpretation of data, and revising of the article; SS helped with conception and design, interpretation of data, and revising of the article; BSH helped with conception and design, interpretation of data, and drafting and revising of the article, and provided intellectual and financial support. All authors read and approved the final manuscript.
Competing interests
The authors declare that they have no competing interests.
Consent for publication
Not applicable.
Ethics approval and consent to participate
Not applicable.
Publisher’s Note
Springer Nature remains neutral with regard to jurisdictional claims in published maps and institutional affiliations.
Author details
1Present address: Laboratory of Molecular Neuroscience and Neurology,
School of Life Sciences, Tokyo University of Pharmacy and Life Sciences, 1432-1 Horinouchi, Hachioji, Tokyo 192-0392, Japan.2Present address:
Department of Molecular, Cellular, and Developmental Biology, Yale University, New Haven, CT 06520, USA.3Department of Evolutionary
Received: 15 April 2017 Accepted: 2 June 2017
References
1. Hildebrand JG, Shepherd GM. Mechanisms of olfactory discrimination: converging evidence for common principles across phyla. Annu Rev Neurosci. 1997;20:595–631.
2. Su CY, Menuz K, Carlson JR. Olfactory perception: receptors, cells, and circuits. Cell. 2009;139(1):45–59.
3. Vosshall LB, Stocker RF. Molecular architecture of smell and taste in Drosophila. Annu Rev Neurosci. 2007;30:505–33.
4. Masse NY, Turner GC, Jefferis GS. Olfactory information processing in Drosophila. Curr Biol. 2009;19(16):R700–13.
5. Couto A, Alenius M, Dickson BJ. Molecular, anatomical, and functional organization of theDrosophilaolfactory system. Curr Biol. 2005;15(17):1535–47. 6. Fishilevich E, Vosshall LB. Genetic and functional subdivision of the
Drosophilaantennal lobe. Curr Biol. 2005;15(17):1548–53.
7. Silbering AF, Rytz R, Grosjean Y, Abuin L, Ramdya P, Jefferis GS, Benton R. Complementary function and integrated wiring of the evolutionarily distinct Drosophilaolfactory subsystems. J Neurosci. 2011;31(38):13357–75. 8. Grabe V, Strutz A, Baschwitz A, Hansson BS, Sachse S. Digital in vivo 3D atlas
of the antennal lobe ofDrosophila melanogaster. J Comp Neurol. 2015; 523(3):530–44.
9. Wong AM, Wang JW, Axel R. Spatial representation of the glomerular map in theDrosophilaprotocerebrum. Cell. 2002;109(2):229–41.
10. Marin EC, Jefferis GS, Komiyama T, Zhu H, Luo L. Representation of the glomerular olfactory map in theDrosophilabrain. Cell. 2002;109(2):243–55. 11. Jefferis GS, Potter CJ, Chan AM, Marin EC, Rohlfing T, Maurer Jr CR, Luo L.
Comprehensive maps ofDrosophilahigher olfactory centers: spatially segregated fruit and pheromone representation. Cell. 2007;128(6):1187–203. 12. Liang L, Li Y, Potter CJ, Yizhar O, Deisseroth K, Tsien RW, Luo L. GABAergic
projection neurons route selective olfactory inputs to specific higher-order neurons. Neuron. 2013;79(5):917–31.
13. Strutz A, Soelter J, Baschwitz A, Farhan A, Grabe V, Rybak J, Knaden M, Schmuker M, Hansson BS, Sachse S. Decoding odor quality and intensity in theDrosophilabrain. Elife. 2014;3:e04147. doi:10.7554/eLife.04147. 14. Tanaka NK, Endo K, Ito K. Organization of antennal lobe-associated neurons in
adultDrosophilamelanogaster brain. J Comp Neurol. 2012;520(18):4067–130. 15. Tanaka NK, Awasaki T, Shimada T, Ito K. Integration of chemosensory
pathways in theDrosophilasecond-order olfactory centers. Curr Biol. 2004; 14(6):449–57.
16. Caron SJ, Ruta V, Abbott LF, Axel R. Random convergence of olfactory inputs in theDrosophilamushroom body. Nature. 2013;497(7447):113–7. 17. Lin HH, Lai JS, Chin AL, Chen YC, Chiang AS. A map of olfactory
representation in theDrosophilamushroom body. Cell. 2007;128(6):1205–17. 18. de Belle JS, Heisenberg M. Associative odor learning inDrosophilaabolished by chemical ablation of mushroom bodies. Science. 1994;263(5147):692–5. 19. Heisenberg M. Mushroom body memoir: from maps to models. Nat Rev
Neurosci. 2003;4(4):266–75.
20. Heimbeck G, Bugnon V, Gendre N, Keller A, Stocker RF. A central neural circuit for experience-independent olfactory and courtship behavior in Drosophila melanogaster. Proc Natl Acad Sci U S A. 2001;98(26):15336–41. 21. Parnas M, Lin AC, Huetteroth W, Miesenbock G. Odor discrimination in
Drosophila: from neural population codes to behavior. Neuron. 2013;79(5):932–44. 22. Min S, Ai M, Shin SA, Suh GS. Dedicated olfactory neurons mediating
attraction behavior to ammonia and amines inDrosophila. Proc Natl Acad Sci U S A. 2013;110(14):E1321–9.
23. Sosulski DL, Bloom ML, Cutforth T, Axel R, Datta SR. Distinct representations of olfactory information in different cortical centres. Nature.
2011;472(7342):213–6.
24. Miyamichi K, Amat F, Moussavi F, Wang C, Wickersham I, Wall NR, Taniguchi H, Tasic B, Huang ZJ, He Z, et al. Cortical representations of olfactory input by trans-synaptic tracing. Nature. 2011;472(7342):191–6.
25. Knaden M, Hansson BS. Mapping odor valence in the brain of flies and mice. Curr Opin Neurobiol. 2014;24(1):34–8.
26. Kurtovic A, Widmer A, Dickson BJ. A single class of olfactory neurons mediates behavioural responses to aDrosophilasex pheromone. Nature. 2007;446(7135):542–6.
27. Ruta V, Datta SR, Vasconcelos ML, Freeland J, Looger LL, Axel R. A dimorphic pheromone circuit inDrosophilafrom sensory input to descending output. Nature. 2010;468(7324):686–90.
28. Dweck HK, Ebrahim SA, Thoma M, Mohamed AA, Keesey IW, Trona F, Lavista-Llanos S, Svatos A, Sachse S, Knaden M, et al. Pheromones mediating copulation and attraction inDrosophila. Proc Natl Acad Sci U S A. 2015;112(21):E2829–35.
29. Suh GS, Wong AM, Hergarden AC, Wang JW, Simon AF, Benzer S, Axel R, Anderson DJ. A single population of olfactory sensory neurons mediates an innate avoidance behaviour inDrosophila. Nature. 2004;431(7010):854–9. 30. Ai M, Min S, Grosjean Y, Leblanc C, Bell R, Benton R, Suh GS. Acid sensing
by theDrosophilaolfactory system. Nature. 2010;468(7324):691–5. 31. Ebrahim SA, Dweck HK, Stokl J, Hofferberth JE, Trona F, Weniger K, Rybak J,
Seki Y, Stensmyr MC, Sachse S, et al.Drosophilaavoids parasitoids by sensing their semiochemicals via a dedicated olfactory circuit. PLoS Biol. 2015;13(12):e1002318.
32. Stensmyr MC, Dweck HK, Farhan A, Ibba I, Strutz A, Mukunda L, Linz J, Grabe V, Steck K, Lavista-Llanos S, et al. A conserved dedicated olfactory circuit for detecting harmful microbes inDrosophila. Cell. 2012;151(6):1345–57. 33. Stökl J, Strutz A, Dafni A, Svatos A, Doubsky J, Knaden M, Sachse S, Hansson
BS, Stensmyr MC. A deceptive pollination system targeting drosophilids through olfactory mimicry of yeast. Curr Biol. 2010;20(20):1846–52. 34. Knaden M, Strutz A, Ahsan J, Sachse S, Hansson BS. Spatial representation of
odorant valence in an insect brain. Cell Rep. 2012;1(4):392–9. 35. Semmelhack JL, Wang JW. SelectDrosophilaglomeruli mediate innate
olfactory attraction and aversion. Nature. 2009;459(7244):218–23. 36. Badel L, Ohta K, Tsuchimoto Y, Kazama H. Decoding of context-dependent
olfactory behavior inDrosophila. Neuron. 2016;91(1):155–67.
37. Stensmyr MC, Giordano E, Balloi A, Angioy AM, Hansson BS. Novel natural ligands forDrosophilaolfactory receptor neurones. J Exp Biol. 2003;206(Pt 4): 715–24.
38. Steck K, Veit D, Grandy R, Badia SB, Mathews Z, Verschure P, Hansson BS, Knaden M. A high-throughput behavioral paradigm forDrosophilaolfaction
—The Flywalk. Sci Rep. 2012;2:361.
39. Thoma M, Hansson BS, Knaden M. Compound valence is conserved in binary odor mixtures inDrosophila melanogaster. J Exp Biol. 2014;217(Pt 20): 3645–55.
40. Laurent G. Olfactory network dynamics and the coding of multidimensional signals. Nat Rev Neurosci. 2002;3(11):884–95.
41. Jefferis GS, Marin EC, Stocker RF, Luo L. Target neuron prespecification in the olfactory map ofDrosophila. Nature. 2001;414(6860):204–8. 42. Grabe V, Baschwitz A, Dweck HK, Lavista-Llanos S, Hansson BS, Sachse S.
Elucidating the neuronal architecture of olfactory glomeruli in the Drosophilaantennal lobe. Cell Rep. 2016;16(12):3401–13.
43. Kazama H, Wilson RI. Origins of correlated activity in an olfactory circuit. Nat Neurosci. 2009;12(9):1136–44.
44. Wilson RI, Turner GC, Laurent G. Transformation of olfactory representations in theDrosophilaantennal lobe. Science. 2004;303(5656):366–70. 45. Bhandawat V, Olsen SR, Gouwens NW, Schlief ML, Wilson RI. Sensory
processing in theDrosophilaantennal lobe increases reliability and separability of ensemble odor representations. Nat Neurosci. 2007;10(11): 1474–82.
46. Schlief ML, Wilson RI. Olfactory processing and behavior downstream from highly selective receptor neurons. Nat Neurosci. 2007;10(5):623–30. 47. Shanbhag S, Müller B, Steinbrecht R. Atlas of olfactory organs ofDrosophila
melanogaster: 1. Types, external organization, innervation and distribution of olfactory sensilla. Int J Insect Morphol Embryol. 1999;28(4):377–97. 48. Dweck HK, Ebrahim SA, Kromann S, Bown D, Hillbur Y, Sachse S, Hansson
BS, Stensmyr MC. Olfactory preference for egg laying on citrus substrates in Drosophila. Curr Biol. 2013;23(24):2472–80.
49. Olsen SR, Wilson RI. Lateral presynaptic inhibition mediates gain control in an olfactory circuit. Nature. 2008;452(7190):956–60.
50. Olsen SR, Wilson RI. Lateral presynaptic inhibition mediates gain control in an olfactory circuit. Nature. 008;452(7190):956–60.
51. Olsen SR, Bhandawat V, Wilson RI. Divisive normalization in olfactory population codes. Neuron. 2010;66(2):287–99.
52. Haddad R, Khan R, Takahashi YK, Mori K, Harel D, Sobel N. A metric for odorant comparison. Nat Methods. 2008;5(5):425–9.
53. Friedrich RW, Laurent G. Dynamic optimization of odor representations by slow temporal patterning of mitral cell activity. Science.
2001;291(5505):889–94.