© Author(s) 2009. This work is distributed under the Creative Commons Attribution 3.0 License.
Geophysicae
The structure of low-latitude Pc3 pulsations observed by CHAMP
and on the ground
D. C. Ndiitwani and P. R. Sutcliffe
Hermanus Magnetic Observatory, P.O. Box 32, Hermanus, 7200, South Africa University of Kwazulu-Natal, Private Bag X54001, Durban, 4000, South Africa
Received: 25 August 2008 – Revised: 5 February 2009 – Accepted: 6 February 2009 – Published: 12 March 2009
Abstract. The structure of low-latitude continuous pulsa-tions termed Pc3, which are naturally occurring MHD waves in the Earth’s magnetosphere, were studied by comparing ground and satellite magnetic field measurements. Data from two induction magnetometers, located at Hermanus and Sutherland in South Africa were used in conjunction with Challenging Minisatellite Payload (CHAMP) satellite obser-vations to study a Pc3 event observed on 15 February 2003, at a time when CHAMP was passing over the ground stations. We observed a number of discrete frequency oscillations for the fast mode wave, one of which drives a field line resonance (FLR) at characteristic latitude as detected by both ground and satellite measurements. Consequently, our observations confirmed the compressional wave as being the driver of the field line resonance. The toroidal mode frequency observed on CHAMP experienced a Doppler frequency shift due to the rapid motion across the resonance region. Polarization hodograms in the resonance region clearly showed the ex-pected 90◦ rotation of the field line resonant magnetic field components.
Keywords. Magnetospheric physics (Magnetosphere-ionosphere interactions; MHD waves and instabilities; Solar wind-magnetosphere interactions)
1 Introduction
Geomagnetic pulsations are the magnetic signature of ultra low frequency (ULF) waves, which are naturally occurring magnetohydrodynamic (MHD) waves in the Earth’s magne-tosphere. Depending on their waveform and wave period the pulsations were classified into two groups by IAGA in 1963
Correspondence to: D. C. Ndiitwani
(Jacobs et al., 1964). This study is about the class of con-tinuous pulsations, termed Pc3 and characterised by a period ranging from 10 to 45 s, which occur at low, mid, and high latitudes. The main source of Pc3 pulsations is thought to be upstream waves in the Earth’s foreshock region (Russell et al., 1983); however, the wave structure may be affected by cavity modes (Menk et al., 2000). If oscillations in the Pc3 frequency band are generated outside the magnetopause they must propagate across magnetic field lines to reach the low latitude stations at which they are frequently observed. The fast mode compressional waves can drive field line reso-nances, which can be pictured as standing waves along geo-magnetic field lines with ends fixed at conjugate ionospheres. The Earth’s foreshock is the region upstream from the bow shock where the interplanetary magnetic field intersects the bow shock and is characterised by backstreaming electrons, ions and associated waves (Le and Russell, 1994). ULF waves generated in the region upstream of the bow shock are convected downstream by the solar wind into the mag-netosheath. Under the condition of small IMF cone angle, waves in the subsolar upstream region are carried to the mag-netopause boundary. The magmag-netopause responds to these pressure fluctuations and transfers wave energy into the day-side magnetosphere where they can excite field line reso-nances. It is generally agreed that upstream waves are the major source for dayside Pc3 and 4 magnetic pulsations (Le and Russell, 1994).
neutrals and provide the Pederson current. These currents cause modifications to the wave modes as they are transmit-ted through the ionosphere and the atmosphere (Hughes and Southwood, 1976). The magnetic signal on the ground is ro-tated through 90◦ with respect to the magnetic field of the transverse Alfv´en mode in the magnetosphere because the signal below the ionosphere is proportional to the Hall cur-rent (Kivelson and Southwood, 1988). For the fast mode wave the ionosphere has no effect, thus the magnetic field on the ground is aligned in the same way as the transverse poloidal component of the magnetospheric wave field. An-other effect of the ionosphere on these waves is smoothing of the amplitude and phase variation, that is, short scale vari-ations less than the height of the ionosphere are strongly at-tenuated on the ground.
Heilig et al. (2007) used magnetic field measurements from the CHAMP satellite to investigate upstream waves (UW) in the topside ionosphere and made suggestions on the entry mechanism of UW’s from the foreshock region into the magnetosphere. They compared their comprehensive observations of UW in the topside ionosphere observed by CHAMP with pulsations observed on the ground. The mean signal power of compressional wave activity in CHAMP data for the group of waves confined on the dayside (06:00– 18:00 LT) was shown to be highest over the equator and min-imum around 40◦ latitude. They tested the effect of solar wind speed, interplanetary magnetic field (IMF) and cone angle on the UWs, since these are parameters known to con-trol the generation of UWs. They confirmed that high solar wind speed provided higher power input to UWs and that the frequency of the UWs is proportional to the IMF strength. They also provided the first observational verification of the Doppler shift of the UW frequency, relative to the satellite frame, caused by the super Alfv´enic solar wind.
Menk et al. (2000) utilized a ground station array to in-vestigate the properties of low latitude Pc3 pulsations. For their work they used a ground magnetometer array in east-ern Australia spanningL=1.3 to 2.0 to study the dynamics of field line resonances (FLR), e.g. variation in Pc3–4 power with latitude, the nature and low-latitude limit of FLRs, and properties of spectral components below the local resonant frequency. They found that the resonant frequency increases with decreasing latitude up to L∼1.6 and then decreases at lower latitudes as a result of mass loading on field line eigenfrequency due to the effect of ionospheric heavy ions at low altitudes (Hattingh and Sutcliffe, 1987). Regarding the source, their results were consistent either with the modula-tion of the incoming fast-mode waves or the existence of cav-ity or waveguide modes. The fast mode waves or wave guide modes drive discrete forced oscillations of low-latitude field lines across a range of frequencies and couple to the local field line resonance where the frequencies match.
As a test of theoretical predictions, Vellante et al. (2004) compared ground and satellite signatures of a Pc3 field line resonance. They presented an analysis of a Pc3 pulsation
event observed simultaneously in space by CHAMP and on the ground by the SEGMA array during a conjunction on 6 July 2002. They identified both compressional and trans-verse oscillations in CHAMP magnetic measurements and observed a close correspondence between the compressional component and the ground signals. The azimuthal compo-nent showed evidence for the occurrence of a field line res-onance, however, the frequency of the azimuthal oscillations was 20% higher than the frequency of both the compressional and ground pulsations. They explained this difference in terms of a Doppler shift caused by the rapid movement of the satellite across the resonance region. The direct comparison of SEGMA and CHAMP pulsations provided confirmation of the expected 90◦ rotation of the ULF wave polarization ellipse through the ionosphere.
Baransky et al. (1985) proposed a method for the direct measurement of the eigenfrequency of the magnetic field lines using ground based magnetometer data. They demon-strated that either the difference or ratio of Pc3–4 pulsation amplitude spectra observed at two closely spaced meridianal ground stations can be used to determine the eigenfrequency associated with the field lines between the two stations. The resonant frequency was identified as the frequency where the amplitude difference equalled zero or the amplitude ratio equalled unity. Waters et al. (1991), on applying this method to low-latitude Pc3 pulsation data, found that it was diffi-cult to identify the resonant frequency unambiguously, since more than one frequency satisfied the condition. They pro-posed an alternative method of determining the presence of a field line resonance by the use of the H-components from two closely spaced stations to obtain the cross-phase differ-ence. With this method the peak in the cross-phase spectrum identifies the resonance. In their studies the technique based on the cross-phase spectrum has been used to identify eigen-frequencies of Pc3 pulsations recorded at stations located at L=1.8 andL=2.7 and used to study the temporal evolution of local field line resonances. The amplitude difference and cross-phase spectrum methods were both used in this study to determine the presence of a field line resonance.
In this study the Pc3 structure observed at low-latitude is investigated by comparing CHAMP and ground magnetome-ter observations. The main objective is to understand the coupling between the fast and Alfv´en modes and the propa-gation of Pc3 pulsations between the magnetosphere and the ground. This was accomplished by comparing the frequency structure in spectra of the field aligned and transverse com-ponents in the ionosphere and the H- and D-comcom-ponents on the ground and investigating ionospheric rotation.
2 Data and analysis
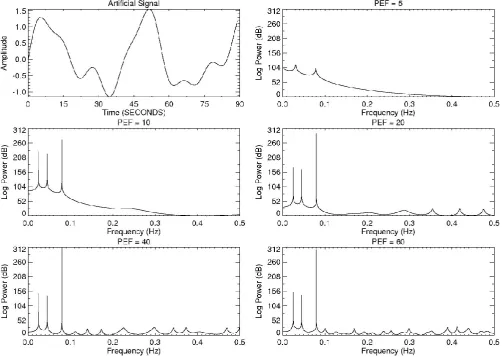
Fig. 1a. MESA spectral estimates of a 90 s test signal consisting of three sinusoids without random noise.
CHAMP was launched on 15 July 2000 into a near-polar cir-cular orbit at an initial altitude of 454 km which after three years has decayed to∼400 km. One of the CHAMP mis-sion objectives was to study the geomagnetic field, therefore the satellite was equipped with high quality magnetometers and star cameras. Due to CHAMP’s orbit it traverses the latitudinal structure of geomagnetic field lines very rapidly. Thus, for example, for a Pc3 pulsation signal CHAMP cov-ers a latitudinal range of 1◦–2◦ in 1 wave period. Never-theless, previous studies have demonstrated that CHAMP data are extremely useful for studies of ULF waves (Sutcliffe and L¨uhr, 2003; Vellante et al., 2004; Heilig et al., 2007). The CHAMP data used for this study were the pre-processed data from the fluxgate vector magnetometer (product identi-fier CH-ME-2-FGM-FGM). The data in the sensor reference frame were used because the data transformed into the North-East-Centre (NEC) coordinate system are contaminated by attitude noise and not entirely suitable for Pc3 studies. The data were therefore first rotated into a pseudo NEC nate system and then transformed to a field-aligned coordi-nate system determined from the low pass filtered data. In
this coordinate system the compressional (Bcom)component is aligned with the ambient magnetic field direction (posi-tive North), the toroidal (Btor)component represents the az-imuthal perturbation (positive East), and the poloidal (Bpol) component lies in the magnetic meridian plane (positive in-ward).
Currently two induction magnetometers for recording ge-omagnetic pulsations in South Africa are located at Her-manus (HER) (34◦250S, 19◦130E) and Sutherland (SUT) (32◦240S, 20◦400E). The induction magnetometers at both stations sample the H-component (magnetic North-South) and D-component (magnetic East-West) data at 1 s intervals. The station pair facilitates field line resonance detection us-ing the amplitude difference (Baransky et al., 1985) and cross phase techniques (Waters et al., 1991, 1994).
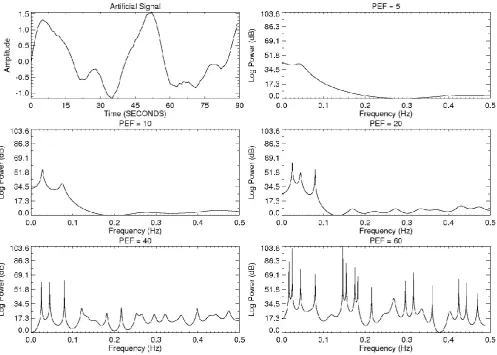
Fig. 1b. MESA spectral estimates of a 90 s test signal consisting of three sinusoids with 5% random noise.
shortcoming of the Fast Fourier Transform (FFT) in ana-lyzing short duration signals is the limited resolving power (Chen and Stegen, 1974). Maximum Entropy Spectral Anal-ysis (MESA) introduced by Burg (1967, 1968) is a nonlin-ear method, for computing spectral estimates. The idea of the method is to choose the spectrum which corresponds to the most random or unpredictable time series of which the auto-correlation function agrees with a set of known values. The attributes of MESA are that it provides greater resolu-tion than linear methods and has the ability to analyze short data records (Haykin and Kesler, 1979). In order to com-pute a MESA spectrum, the so called prediction error filter (PEF) coefficients must first be computed. Chen and Ste-gen (1974) carried out a detailed investigation using short harmonic signals and demonstrated that MESA sometimes suffers anomalous behaviour, such as frequency shifts, when the Burg (1968) algorithm is used to compute the PEF coeffi-cients. Ulrych and Clayton (1976) and Swingler (1979) inde-pendently proposed an alternative method of computing the PEF coefficients, which they called the least squares estima-tor and which obviates the shortcomings of the Burg (1968)
algorithm. We used the Ulrych and Clayton (1976) method for computing the PEF coefficients.
Table 1. Frequency and Amplitude values used to generate
artifi-cially signal.
Frequency (Hz) Period (s) Amplitude Phase 0.025 40.00 1.00 0 0.045 22.20 0.45 0 0.080 12.50 0.25 0
been added required a PEF value of 20 to resolve the three peaks. For both noise and non-noise signals the value of 40 starts introducing spurious peaks into the spectrum. When 20% noise was added to the synthetic signal, we found that a PEF length of 35 was required to resolve the three peaks. A greater PEF length is also required if one of the amplitudes is very much less than the other others (e.g. by a factor 10) especially if random noise greater than 5% is added to the signal. The important point to note is that for a pure signal the shorter length is preferable whereas for signals contami-nated with noise a longer length is preferable.
We also experimented with HER ground data and com-puted dynamic spectra using different PEF lengths in the range of 15 to 45, changing the length in steps of 5. The results are not shown here but it was noticed that for PEF length greater than 25 splitting of the most intense frequency band present in the dynamic spectra are sometimes observ-able. Since the prime objective of this study was to identify FLRs, which if present, are generally one of the more in-tense spectral components, we regarded PEF’s of 15 and 20, respectively, for the ground-based and satellite data as ade-quate. However, if one were interested in studying the fast mode fine structure in more detail, then a larger PEF length than the above would probably be desirable.
CHAMP traverses the latitudinal structure of the geomag-netic pulsation field quite rapidly; consequently, the spectral content will also likely change rapidly. In order to take ac-count of this effect we used dynamic MESA spectra com-puted for 90 s data lengths and progressively shifted by 10 s in a manner similar to that used by Vellante et al. (2004). However, our analysis differed from Vellante et al. (2004) in two important respects. First, we used a shorter PEF length than Vellante, since we found that the length of 40 used by them sometimes introduced what we considered to be spuri-ous peaks into the spectrum. Second, we plotted the dynamic spectra on a logarithmic scale to emphasize the oscillations at lower power levels.
3 Observations
[image:5.595.66.265.99.156.2]On 15 February 2003 CHAMP passed close to HER in one of its orbits over southern Africa when there was good Pc3 pulsation activity. Figure 2 shows a map of the southern
Fig. 2. Map of the southern African region showing the
satellite-ground track as it traversed the region during a Pc3 pulsation on 15 February 2003. The locations of the two ground stations are also shown.
African region indicating the locations of the two induction magnetometer stations. The line across the map shows the satellite-ground track as the satellite traversed the region dur-ing 10 min of pulsation activity. The first point durdur-ing the considered time is indicated by the diamond symbol. During the 10 min the satellite covered almost 40 degrees of latitude due to the low Earth orbit.
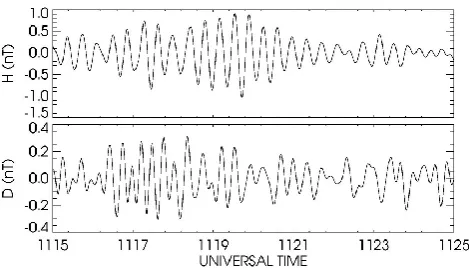
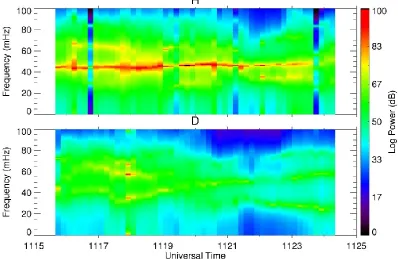
During the CHAMP traverse a Pc3 was simultaneously ob-served on the ground and in the magnetosphere as shown in Fig. 3a and b, respectively. Figure 3a shows the H- and D- components measured by the HER ground station. The components in a field-aligned coordinate system observed by CHAMP are shown in Fig. 3b. The data were filtered in the Pc3 frequency band, 20–100 mHz. The ground sig-nal exhibits a wave packet structure, which is a characteristic of Pc3 pulsations. The H-component has larger amplitude than the D-component and appears rather monochromatic. The satellite data appear to be more broadband, with the sig-nal containing a mixture of frequencies. The toroidal com-ponent exhibits the largest amplitude oscillation (∼6 nT), which maximises around 11:19 UT, suggesting that a reso-nance may be occurring at the time. This occurrence of a Pc3 pulsation when the satellite was crossing over HER pro-vided an opportunity to test some of the predictions of MHD wave theory.
Fig. 3a. H and D components of the Pc3 pulsation observed on the
ground at Hermanus on 15 February 2003.
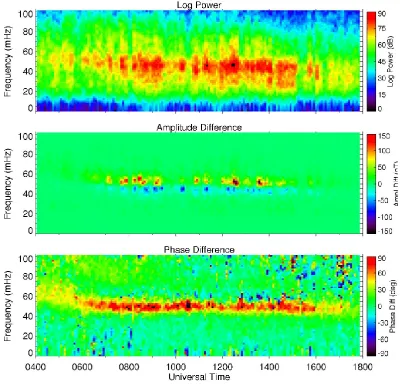
and phase differences indicate the intermittent occurrence of a field line resonance throughout the day close to 50 mHz, which is a slightly higher frequency than 45 mHz where the maximum power at HER is found.
To allow for comparison of the signals observed on the ground and above the ionosphere, dynamic MESA spec-tra at HER and CHAMP were computed for the time of the CHAMP crossing as shown in Fig. 5. The spectra were computed using a 90 s data window and progressively shifted by 10 s. The PEF values of 15 and 20 were used in ground and satellite data respectively. In Fig. 5a the HER H-component spectrum clearly shows a field line resonance around 45 mHz. The D-component shows power at multi-ple frequencies. The slightly lower resonant frequency ob-served in Fig. 5 relative to Fig. 4 is expected since HER lies at higher latitude than the average HER-SUT latitude used to determine the resonant frequency by the amplitude and phase difference methods.
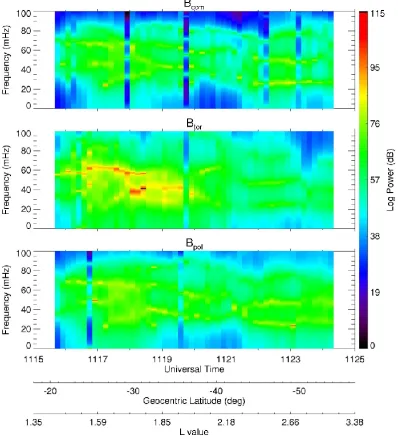
Figure 5b displays the dynamic spectra for the CHAMP data. All three components show multiple frequency struc-tures that change over the 10 min interval of the dynamic spectra. Similar frequency structures are observed in the compressional and poloidal components. During the first three minutes they both exhibit clear oscillations at 45 and 65 mHz. There is evidence of an oscillation at 25 mHz of which the frequency seems to increase and then decrease slightly with time. During the last three minutes there are clear oscillations at 25 and 45 mHz and evidence of an oscil-lation at 75 mHz.
There are similarities between the compressional (source) and toroidal (forced wave) components. However, there are differences between the first and last parts of the dynamic spectrum where toroidal mode (Btor)intensities are high and low respectively. There is a short interval of intense oscilla-tions inBtorat 60 mHz centred at 11:17.5 UT when CHAMP was at geocentric latitude of 27◦ south. This is followed by a short interval of intense oscillations at 40 mHz cen-tred at 11:19 UT when CHAMP was at geocentric latitude of 34◦S and corresponds to the time when CHAMP was
cross-Fig. 3b. The Pc3 signal observed along the CHAMP satellite
tra-jectory on 15 February 2003. The three field-aligned components, i.e. compressional (Bcom), toroidal (Btor)and poloidal (Bpol), are
shown from top to bottom.
ing close to HER. It thus appears that these high intensity toroidal mode oscillations are shifted to slightly lower fre-quencies relative to the fast mode oscillations at 65 mHz and 45 mHz, respectively, observed in the compressional compo-nent. The 40 mHz signal is also shifted to a lower frequency relative to the field line resonance oscillation observed on the ground at HER. During the last three minutes there are also clear oscillations inBtor at 25 and 45 mHz and evidence of oscillations at 75 mHz. Thus, in contrast to the toroidal oscil-lations during the first part of the dynamic spectrum, toroidal oscillations during the second part of the dynamic spectrum do not suffer a frequency shift; they are also of a much lower intensity.
Comparison of the satellite and ground dynamic spec-tra exhibit similarities. The dynamic spectrum of the com-pressional component,Bcom, has some similarities with the ground D-component spectrum. The three most significant frequency bands in the satellite dynamic spectrum are also observable in the ground dynamic spectrum at 75, 45 and 25 mHz. This correlation is in agreement with previous Pc3– 4 observations by Odera et al. (1991), Kim and Takahashi (1999) and recently by Vellante et al. (2004). The intense os-cillation in the H-component at frequency 45 mHz is ascribed to a field line resonance and manifests itself below 45 mHz in Btorof the satellite dynamic spectrum. This is a consequence of the rapid motion of the satellite across the resonance re-gion where the phase varies rapidly.
[image:6.595.309.544.60.258.2]Fig. 4. Dynamic spectra of the Pc3 pulsation H-component observed on the ground. Top panel: dynamic log power at HER, Middle panel:
SUT-HER amplitude difference and bottom panel: SUT-HER phase difference.
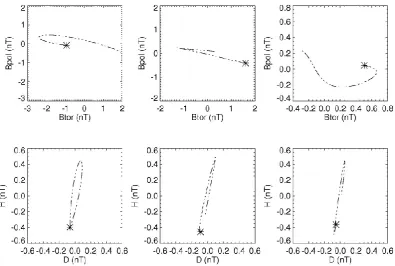
through the ionosphere. Figure 6 displays hodograms in the Bpol–Btorplane for the satellite and in the H-D plane for the ground measurements for three consecutive 20 s time inter-vals during CHAMP’s path over HER. First points are indi-cated by asterisks in the hodograms. The data were filtered in the frequency band 35 to 50 mHz in accordance with the dy-namic spectrum observations. The 90◦rotation of the mag-netic field components due to ionospheric currents is clearly observable.
4 Discussion
We discuss our observations and findings in the light of the-oretical expectations and previous published observations. The ground FFT dynamic amplitude and phase difference spectra (Fig. 4) indicate the intermittent occurrence of a field line resonance close to HER throughout the day. The
Fig. 5a. MESA ground dynamic spectra for the H- and D-components observed at Hermanus on 15 February 2003.
theBpol frequency to be 20% higher thanBcom and which they ascribed to a Doppler effect as a result of the rapid mo-tion of CHAMP across field lines. Our observamo-tions for the FLR driven by Bcom at 65 mHz indicate that Bpol did not experience a Doppler shift. However, for the FLR driven by Bcom at 45 mHz, the frequency of the Bpol component decreased at the time that CHAMP crossed over HER. In the non-uniform plasma of the real magnetosphere, the fast and transverse waves have a degree of coupling, and in such case thenBpol might be expected to be affected by a FLR as shown by Hughes and Southwood (1976). In their model it was demonstrated that phase variation and consequently the Doppler shift ofBpolaround the resonance is less dras-tic but can not be completely ignored. This can explain the frequency decrease ofBpolwhen CHAMP approached HER latitude. Despite the intermittent nature of the structure in the spectra and the changing latitude of CHAMP, some fre-quencies seem to persist, e.g. 25 mHz and 45 mHz. This is reminiscent of the results of Menk et al. (2000), who found power spectra for a ground magnetometer array to be similar over a range of latitudes.
The dynamic spectra of Bcom, which acts as the source wave, andBtor, which represents the driven or forced wave, exhibit some correlation. However, the nature of this corre-lation is different between the parts of the spectrum where Btor intensities are high and the parts where intensities are low. We interpret the short intervals of intense oscillations, centred at 11:17.5 UT and 11:19 UT, as times when CHAMP
is crossing a field-line resonance. The observation of an ap-parent Doppler shift inBtorfrequency for the first part of the dynamic spectrum where intensities are high agrees with Vel-lante et al. (2004), who reported theBtorfrequency to be 20% higher thanBcom. However, in our case the Doppler shift is to lower frequencies due to the satellite moving poleward rather than equatorward. In contrast with the first part of the spec-trum, the last three minutes of theBtorspectrum shows clear oscillations of much lower intensity at three frequencies as inBcom and Bpol. The latter are not subject to a Doppler shift. The absence of any Doppler shift at these frequencies can be explained by the oscillations not being associated with a FLR. TheBtoroscillations arise due to weak coupling be-tween the fast mode and Alfv´en mode waves. Note that these three frequencies are observed when CHAMP traverses mag-netic shells withL>∼2.4 and at these L-values the resonant frequency is expected to be<20 mHz according to previous observations (e.g. Menk et al., 2004; Dent et al., 2006). Con-sequently, the absence of a FLR and the associated Doppler shift at these frequencies is justifiable.
Fig. 5b. MESA dynamic spectra for magnetic field components as measured by the CHAMP satellite on 15 February 2003. Also shown are
the geocentric latitude and L-shell values during the satellite traverse.
65 and 45 mHz from 11:16 to 11:20 UT. Consequently, we can expect toroidal mode oscillations to occur at these fre-quencies at latitudes where they match the field line resonant frequency. In Fig. 5b we see that for a driving frequency of 65 mHz inBcom, this occurs at latitudes centered on 27◦S as evidenced by the short interval of intense oscillations inBtor. Note, however, that theBtorfrequency observed on CHAMP is Doppler shifted to a lower frequency of 60 mHz. Vellante et al. (2004) provide an explanation and derivation of this Doppler shift, which is due to the rapid rate at which a LEO satellite traverses the rapid phase change across the field line resonance region. In the case of the example given by Vel-lante et al. (2004) the Doppler shift was to higher frequencies
due to CHAMP moving equatorward. In our example the Doppler shift is to lower frequencies due to CHAMP moving poleward. Ninety seconds later CHAMP crosses another res-onance centered at 34◦S, where theBcomdriving frequency is 45 mHz and the Btor resonance frequency is shifted to 40 mHz as observed on CHAMP. The latter latitude is that of HER and the fast mode frequency matches the resonant fre-quency observed in the H-component on the ground at HER as shown in Fig. 5a.
Fig. 6. CHAMP (top panel) and ground (bottom panel) wave hodograms for three consecutive 20 s intervals at the time when the satellite
was over the Hermanus ground station.
Odera’s observations (Odera et al., 1991), who suggested that Pc3 energy is transported through compressional fluc-tuations. The hodograms computed confirm the 90◦rotation of the magnetic field components.
5 Summary and conclusions
In this paper we studied a Pc3 geomagnetic pulsation event at a time when the CHAMP satellite passed over the HER ground station. The data were analysed using Fourier and MESA techniques. When a compressional wave is seen along the CHAMP trajectory, similar structures are observed in the D-component on the ground. These observations of a compressional wave in space and on the ground at same frequency and similar wave forms is viewed as an indicator that Pc3–4 wave energy is transported through compressional fluctuations, confirming previous observations. We observed oscillations at a number of discrete frequencies in the fast mode wave, one of which drives a field line resonance at the characteristic latitude as detected by both ground and satel-lite measurements. Therefore our observations confirm the compressional wave as being the driver of the field line res-onance. The toroidal mode frequency observed on CHAMP experienced a Doppler frequency shift due to the rapid mo-tion across the resonance region. Polarizamo-tion hodograms in the resonance region show the expected 90◦rotation of the magnetic field components.
Acknowledgements. The satellite data used in this study were
ob-tained from the CHAMP Information System and Data Centre (http://isdc.gfz-potsdam.de/CHAMP). We thank A. D. M. Walker and L. G. Magnus for useful discussions during the course of this work.
Topical Editor I. A. Daglis thanks M. Vellante and another anonymous referee for their help in evaluating this paper.
References
Baransky, L. N., Borovkov, J. E., Gokhberg, M. B., Krylov, S. M., and Troitskaya, V. A.: High resolution method of direct measure-ment of the magnetic field line’s eigenfrequencies, Planet. Space Sci., 33, 1369–1374, 1985.
Burg, J. P.: Maximum entropy spectral analysis, Paper presented at 37th meeting, Soc. Geophys., Oklahoma City, Okla., October 1967.
Burg, J. P.: A new analysis technique for time series data, Paper pre-sented at NATO Advanced Study Institute on Signal processing, Enschede, Netherlands, August 1968.
Chen, W. Y. and Stegen, G. R.: Experiment with maximum entropy power spectra of sinusoids, J. Geophys. Res., 79, 3019–3022, 1974.
1987.
Haykin, S. and Kesler, S.: Prediction-error filtering and maximum-entropy spectral estimation, in: Nonlinear Methods of Spectral Analysis, edited by: Haykin, S., Springer-Verlag, Berlin, 9–72, 1979.
Heilig, B., L¨uhr, H., and Rother, M.: Comprehensive study of ULF upstream waves observed in the topside ionosphere by CHAMP and on the ground, Ann. Geophys., 25, 737–754, 2007, http://www.ann-geophys.net/25/737/2007/.
Hughes, W. J. and Southwood, D. J.: An illustration of modification of geomagnetic pulsation structure by the ionosphere, J. Geo-phys. Res., 81, 3241–3247, 1976.
Jacobs, J. A., Kato, Y., Matsushita, S., and Troitskaya, V. A.: Classification of geomagnetic micropulsations, J. Geophys. Res., 69(1), 180–181, 1964.
Kim, K. H. and Takahashi, K.: Statistical analysis of compressional Pc3-4 pulsations observed by AMPTE CCE atL=2–3 in the day-side magnetosphere, J. Geophys. Res., 104, 4539–4558, 1999. Kivelson, M. G. and Southwood, D. J.: Hydromagnetic waves and
the ionosphere, Geophys. Res. Lett., 15, 1271–1274, 1988. Le, G. and Russell, C. T.: The Morphology of ULF Waves in the
Earth’s Foreshock, in: Solar wind sources of magnetospheric Ultra-Low-Frequency waves, pp. 87–98, Geophysical Monogr., 81, AGU, Washington, D.C., 1994.
Menk, F. W., Waters, C. L., and Fraser, B. J.: Field line resonances and waveguide modes at low latitudes: 1. Observations, J. Geo-phys. Res., 105, 7747–7761, 2000.
Menk, F. W., Mann, I. R., Smith, A. J., Waters, C. L., Clilverd, M. A., and Milling, D. K.: Monitoring the plasmapause using geo-magnetic field line resonances, J. Geophys. Res., 109, A04216, doi:10.1029/2003JA010097, 2004.
Odera, T. J., Van Swol, D., Russell, C. T., and Green, C. A.: Pc 3,4 magnetic pulsations observed simultaneously in the magne-tosphere and at a multiple ground stations, Geophys. Res. Lett., 18, 1671–1674, 1991.
Reigber, C, L¨uhr, H., and Schwintzer, P.: CHAMP mission status, Adv, Space Res., 30, 129–134, 2002.
Russell, C. T., Luhmann, J. G., Odera, T. J., and Stuart, W. F.: The rate of occurrence of day side Pc3, 4 pulsations; the L-value de-pendence of the IMF cone angle effect, Geophys. Res. Lett., 10, 663–666, 1983.
Sutcliffe, P. R. and L¨uhr, H.: A comparison of Pi2 pulsa-tions observed by CHAMP in low Earth orbit and on the ground at low latitudes, Geophys. Res. Lett., 30(21), 2105, doi:10.1029/2003GL018270, 2003.
Swingler, D. N.: A comparison between Burg’s maximum entropy method and a nonrecursive technique for the spectral analysis of deterministic signals, J. Geophys. Res., 84, 676–685, 1979. Ulrych, T. J. and Clayton, R. W.: Time series modelling and
maxi-mum entropy, Phys. Earth Planet. Inter., 12, 188–200, 1976. Vellante, M., L¨uhr, H., Zhang, T. L., Wesztergom, V., Villante, U.,
De Lauretis, M., Piancatelli, A., Rother, M., Schwingenschuh, K., Koren, W., and Magnes, W.: Ground/satellite signatures of field line resonance: A test of theoretical predictions, J. Geophys. Res., 109, A06210, doi:10.1029/2004JA010392, 2004.
Ver˜o, J., L¨uhr, H., Vellante, M., Best, I., Stˇreˇstik, J., Cz. Miletits, J., Holl´o, L., Szendr˜oi, J., and Zieger, B.: Upstream waves and field line resonances: simultaneous presence and alternation in Pc3 pulsation events, Ann. Geophys., 16, 34–48, 1998,
http://www.ann-geophys.net/16/34/1998/.
Waters, C. L., Menk, F. W., and Fraser, B. J.: The resonance struc-ture of low latitude field line resonances, Geophys. Res. Lett., 18, 2293–2296, 1991.