PREDICTION OF THE IMPACTS OF CLIMATE CHANGES ON THE STREAM
FLOW OF AJALI RIVER WATERSHED USING SWAT MODEL
A. A. Obasi
1,*, K. N. Ogbu
2, E. L.
Ndulue
3, V. N. Ogwo
4and C. C. Mbajiorgu
51,2,
D
EPT.
OFA
GRIC.
ANDB
IORESOURCESE
NGR.
N
NAMDIA
ZIKIWEU
NIVERSITY,
A
WKA,
A
NAMBRAS
TATE,
NIGERIA
3,4,5,
D
EPT.
OFA
GRIC.
ANDB
IORESOURCESE
NGINEERING,
U
NIVERSITY OFN
IGERIA,
N
SUKKA,
E
NUGUS
TATE,
NIGERIA
Email addresses:
1[email protected]
,
2[email protected]
,
3[email protected],
4[email protected]
,
5[email protected]
ABSTRACT
Soil and Water Assessment Tool, (SWAT) model was used to predict the impacts of Climate Change on Ajali River watershed, Aguobu-Umumba, Ezeagu, Enugu State, Nigeria. The model was first used to simulate stream flow using observed data. After model run, parameterization, sensitivity analysis, the monthly coefficients of determination (R2)
were 0.5739 and 0.6776 for calibration and validation respectively. Having performed fairly well, the model was thereafter run to simulate climate change impacts on streamflow. Two GCMs - CCCMA and GFDL, were used to generate future climate data and run in SWAT. Total observed streamflow for the baseline (1981-2000) was compared with that predicted (2046 – 2064) from the GCMs. The results of the CCCMA models showed an increase of 383.72m3/s and 2.1% in the streamflow of the Ajali river watershed when projected to 2046 – 2064 as against the
historical baseline while GFDL showed 3358.58 m3/s and 18.9% respectively. The study, when applied, will help
watershed managers and planners in the management of the watershed for effectiveness and efficiency. It will also increase our awareness of the effect of climate change on other water bodies in the hinterlands.
Key Words: Climate change, watershed, SWAT, streamflow; Global Climate Model (GCM), CCCMA (Canadian Centre for Climate Modelling and Analysis), GFDL (Geophysical Fluids Dynamics Laboratory) model.
1. INTRODUCTION
Climate is the synthesis of atmospheric conditions characteristic of a particular place in the long-term [1]. It is expressed by means of averages of the various elements of weather, and also the probabilities of other conditions, including extreme values [2]. The United Nations Intergovernmental Panel on Climate Change (IPCC) is one of the international bodies that assess scientific, technical and socio-economic information concerning climate change, its potential effects and options for adaptation and mitigation. According to [3] climate change is seen as a statistically significant variation in the mean state of the climate or in its variability persisting over an extended period, typically decades or longer. Therefore, climate change refers to a significant change in the average weather conditions experienced in a particular region or location. The changes could be seen with respect to a significant change in perceived temperature of the region, the amount of rainfall experienced in the region, duration of exposure of the ground to sunlight etc. Climate
change may be due to natural internal processes, natural external fossils, or persistent anthropogenic-induced changes in atmospheric composition or land use. The change may occur over periods ranging from decades to millennia [4]. Many studies have suggested that future climate change will involve greater extremes of weather [3], including more high-intensity rainfall events. This is likely to lead to an increase in flooding, particularly while a channel adjusts to the differing flow regime.
Impacts of climate change are broadly classified into environmental, agricultural, economic, health and other socio-economic according to United Nations Framework Convention on Climate Change [5]. Other key socio-economic sectors that are most likely to be impacted by climate change are well-being, land-use change and forestry and energy. According to the 4th
assessment report of the intergovernmental panel on climate change, Africa is likely to become warmer than the rest of the earth with an increase in average surface temperature of about 3.40c by the end of the 21st
Vol. 36, No. 4, October 2017, pp.
1286 – 1295
Copyright© Faculty of Engineering, University of Nigeria, Nsukka,As a result of the above, it is therefore imperative to study, analyze and understand the futuristic effect of this climate change on our hydrological cycle. To conduct the study, a semi-distributed hydrological model as described by [6] known as SWAT (The Soil and Water Assessment Tool) was applied, in line with other tools, to determine the extent and impact of climate change on a chosen hydrological feature in Nigeria - Ajali watershed.
The Soil and Water Assessment Tool (SWAT) model is a river basin or watershed scale model that predicts the impact of land management practices such as land-use and land cover changes, reservoir management, ground water withdrawals and water transfers, in complex watershed over long periods of time [7]. The vital tool for this study, being Arc SWAT, isa merger of Arc GIS (Geographical Information System) and the SWAT model to examine a direct relationship between spatially distributed watershed properties and watershed processes [8].
[6] studied the impact of climate change on streamflow in selected river basins in Ghana, and the results showed a decrease of 22 and 50% for estimated streamflow of White Volta basin for 2020s and 2050s respectively, as well as a decrease of 22 and 46% of
2050s respectively. The results underscore the need to put in place appropriate adaptive measures to foster resilience to climate change in order to enhance water security within the two basins. [9] assessed the potential impacts of climate change on the flow of the main headwaters of the Nile River: Equatorial Lakes Region and Blue Nile Basins using the SWAT model. Result from the study demonstrates that the hydrology of the basin is very sensitive to climate change with 104%, 33% and 77% of the baseline increase to the surface runoff, lateral flow and water yield.[10] assessed the future of climate change impacts on water quantity and quality for a mountainous dam watershed in South Korea using SWAT. The impacts of projected future climate change scenarios on the evapotranspiration, groundwater recharge, and streamflow were increases of +23.1%, +28.1%, and +39.8%, respectively.
The objective of this study was to predict the impacts of climate changes on streamflow in the Ajali River Watershed – using the SWAT model. The objective involves calibrating the SWAT model for the watershed, validating the SWAT model for application to the watershed and Comparing runoff or streamflow results from two climate data models.
Fig: 2. Map showingAjali Watershed, Aguobu-Umumba, Ezeagu, Enugu State (Source:Author’s investigation, 2016)
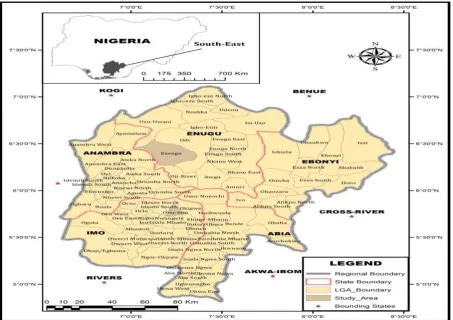
2 DESCRIPTION OF THE STUDY AREA
The study area is Ajali River Watershed, Aguobu Umumba in Ezeagu North, Ezeagu Local Government of Enugu State, Nigeria. It is located at Latitude 6028”0’N
to 6016”0’N and Longitude 706”0’E to 7024”0”E and an
elevation of 52m.The general topography and geology of the zone made the state highly prone to gully erosion phenomenon and with mean annual rainfall of 2000mm [11].
The Ajali River Aguobu Umumba watershed is predominantly underlain by Ajali and Nsukka Formations at upland and Mamu Formations in the lowlands. The poorly sorted Ajali Sandstones are easily washed away by concentrated runoff from prolonged and torrential rainfall. The soil of the study area is sandy with small percentage of silt/clay [11].
3. SWAT MODEL: THEORY
SWAT is most versatile model, and has been widely used in various regions and climatic conditions on daily, monthly and annual basis and for the watershed of various sizes and scales [12]. The Hydrologic Response Units (HRUs) are used to describe spatial heterogeneity in terms of land cover, soil type and slope class within a watershed. The model estimates relevant hydrologic components such as evapotranspiration, surface runoff and peak runoff, groundwater flows and sediment yields for each HRUs unit. The SWAT is embedded in a GIS-interface. The hydrologic cycle simulated by SWAT is based on the water balance equation:
( ) (1)
In (1), SWt is the final soil water content (mm), SWo is
the initial soil water content on day i (mm), t is time (days), Rday is the amount of precipitation on day i
(mm), Qsurf is the amount of surface runoff on day i
(mm), Ea is the amount of evapotranspiration on day i
(mm), Wseep is the amount of water seepage entering
the vadose zone from the soil profile on day i (mm), and Qgw is the amount of return flow on day i (mm).
Water enters the SWAT model’s watershed system boundary predominantly in the form of precipitation. Precipitation inputs for hydrologic calculations can either be measured data or simulated with the weather generator available in the SWAT model. Precipitation is partitioned into different water pathways depending on system characteristics [13]. The water balance of each HRU in the watershed contains four storage volumes: snow, the soil profile (0-2 m), the shallow aquifer (2-20 m), and the deep aquifer (>20 m). The soil profile can contain several layers. The soil-water processes include infiltration, percolation, evaporation, plant uptake, and lateral flow [13].
underneath the ground. Once all voids are filled and application rate is higher than infiltration rate, runoff begins.
Surface runoff is estimated in SWAT using two methods: the SCS curve number [14] and the Green & Ampt infiltration method [13].
The SCS curve number is a function of the soil’s permeability, land-use and antecedent soil water conditions. The SCS runoff equation is an empirical model that came into use in the 1950s. It was a product of more than 20 years of studies involving rainfall-runoff relationship from small rural watershed across the U.S. [7]. According to [7], the SCS curve number equation is given as
( 0.2 )
( 0.8 )
(2)
In (2), Qsurf = Accumulated runoff or rainfall excess
(mm), Rday = Rainfall depth for the day (mm), S =
retention parameter (mm) given as
2 .41000
10 ( ) In (3) CN= curve number for the day. The Green & Ampt equation was developed to predict infiltration assuming excess water at the surface at all times [13]. The equation assumes that the soil profile is homogenous and antecedent moisture is uniformly distributed in the profile. As water infiltrates into the soil, the model assumes the soil above the wetting front is completely saturated and there is a sharp break in moisture content at the wetting front. [15] developed a methodology for determining ponding time with infiltration using the Green & Ampt equation. The Green & Ampt excess rainfall equation was incorporated into SWAT to provide an alternative option for determining surface runoff. This method
user [12].
The Green & Ampt infiltration rate is given as:
, (1
,
) (4)
In (4), finf is the Infiltration rate at time t (mm/hr), Ke is
the Hydraulic conductivity (mm/hr), Ψwf is the Wetting
front matric potential (mm), Δθv is the Change in
volumetric moisture content across the wetting from (mm/mm), Finf is the Cumulative infiltration at time t
(mm). The objective of this study is therefore to calibrate and validate SWAT model in order to predict the impacts of land use changes on the streamflow of Ajali river watershed [13].
4. METHODOLOGY
ArcSWAT, an ArcGIS extension is a graphical user interface for the SWAT model. Inputs required by SWAT includes Digital elevation model (DEM), soil map, land-use data and climate data. The model used the DEM to divide the watershed into multiple sub-basins that were further subdivided into hydrological response units (HRUs). The HRUs consist of homogenous land-use, management and soil characteristics [16].DEM was collected and simulated using Surfer and Google Earth; Land sat images were procured from USGS (United States Geological Services) websites, and soil data for the experiment was collected from Dominant soil map of Nigeria from FAO (Food and Agricultural Organization)while coordinates were obtained from GPS (Global Positioning System) during ground trothing. More so, the weather data used was obtained from Metrological office at Enugu. More so, two climate change models (CCCMA and GFDL) were used and the results analyzed to predict the impact of climate change on the study area.
4.1 Model Inputs
Ideally, the SWAT model required the following input parameters in order to set up and run:
1. Digital Elevation Model (DEM) of the watershed. 2. Land Use data
3. Soil data
4. Weather or meteorological data.
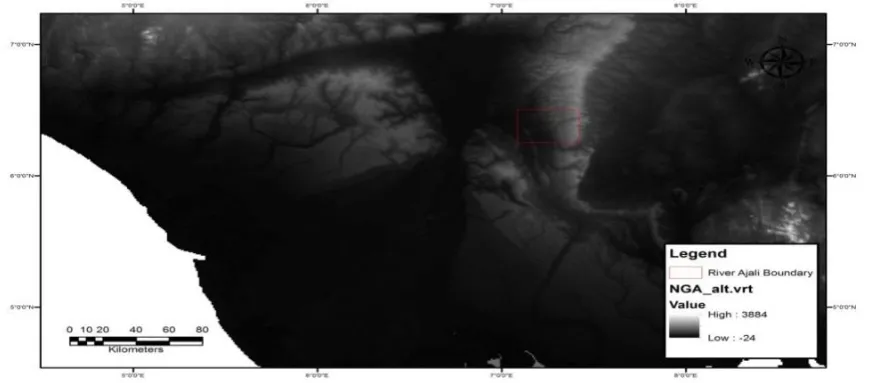
Digital Elevation Model (DEM): A digital elevation model (DEM) is a digital model or 3D representation of a terrain's surface — commonly for a planet (including Earth), moon, or asteroid — created from terrain elevation data. The DEM was derived from the raster DEM using USGS database, diva-gis archive and ground control points; these were combined using the raster calculator to make a single composite detailed DEM for the study. The DEM has a spatial resolution of 30m for global coverage. The DEM was masked and the areas was utilized for delineating the watershed and also to derive the drainage patterns and stream networks for the study watershed.
Land use Map: Landuse data of the study location were
procured from the USGS Data Archieve
(earthexplorer.usgs.gov).The land sat images were processed and vectorized using the Geographic coordinate systems of World Geodetic System 1984, to create their vector shapefiles, which were also masked using the shapefile of the study watersheds and analyzed using the ArcGis tool; The following procedures were undertaken in the image processing of the land use data:
Layer stacking: Bands 4, 3, 2 of the 1985, 1995, 2005 and 2015 land-sat TM images were in turn, layer – stacked together using ArcGIS 9.3 to form a single layer each, for the analyses. These bands were chosen because of their capacity to reflect vegetation component, and land use variables. Radiometric and Geometric Correction: It was
discovered that most open source imageries were often distorted by excessive cover. As such, IDRISI Selva was used to correct the haze distortion where necessary.
Image sharpening: This was meant to enhance the appearance of the images using IDRISI Selva so as to increase their spatial resolution and visualization of the multiband images.
Image extraction through the process of Masking and extraction: Shape file for the area of interest was purchased and created in ArcGIS 9.3 and used to clip out the area of interest.
4.2 Soil Data
The SWAT model requires soil property data such as the texture, chemical composition, physical properties, available moisture content, hydraulic conductivity, bulk density and organic carbon content for the different layers of each soil type [17]. Some of these properties were determined in the laboratory while others were extracted from the Harmonized World Soil Database (HWSD). The soil maps were obtained from Dominant soil map of Nigeria from FAO at a scale of 1:1,300,000 and associated characteristics for those soils were organized using the Input Editor. According to HWSD classification, the soil types found in Ajali watershed include a combination of Fluvisols (FL), Acrisol (AC) and Plinthosols (AC)[17].
Climate Data: In this study, the daily, monthly and annual rainfall records of January 1980 to December 1992 was obtained for Ajali Watershed, Enugu State, from the Federal Department of Meteorological Services, Airport, Enugu. The missing weather parameters including temperature, precipitation, elevations, relative humidity, solar radiation and wind speed were simulated on 16th July, 2016 from the
Weather Generator File using the Global Weather Data of the Climate Forecast System Reanalysis (CFSR) global meteorological dataset from 1979 to 2014 from forty-eight (48) weather stations available from 6.00am daily within the South Latitude 5o.0909’, West
Longitude 6o.6357’, North Latitude 7o.4060’ and East
Longitude 8o.4595’.
4.3 Model Performance
Hydrological Models are usually evaluated using statistical analysis. They show relationship between simulated or predicted values and measured or observed value. In this study, SWAT model was evaluated using Coefficient of determination (R2).
Generally, model simulation can be judged as satisfactory if R2> 0.50 for streamflow [18]. Coefficient
of determination, usually represented by R2, describes
the proportion of the variance in measured data explained by the model. R2 ranges from 0 to 1, with
higher values indicating less error variance, and typically values greater than 0.5 are considered acceptable. According to [18], the Coefficient of determination (R2) is given as:
(
∑ ( ̅)( ̅)
√∑ ( ̅) √∑ ( ̅)
)
The model setup involves creating a new SWAT project in a designated file, followed by a sequence of Watershed Delineation, hydrologic Response Unit (HRU) analysis (which includes Land use/soils/slope definition, HRU definition), writing the input tables (from the weather stations and then writing all), then SWAT simulation (SWAT run, sensitivity analysis and calibration).
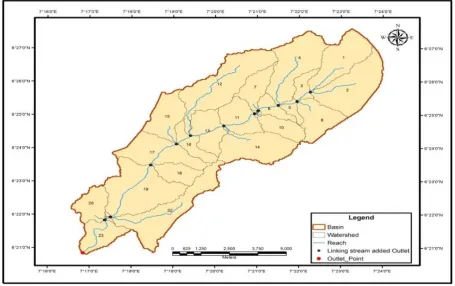
The DEM dataset [19] of each of the study watershed was projected into the Arc-SWAT Project. After proper projection, the DEM Projection setup button became enabled for delineation. An outlet where the observed
delineation was taken. After each delineation, Ajali watershed produced 23 sub-basins having a total land area of 7282.1291ha.
6. MANUAL CALIBRATION
Manual calibration consists of changing values of model input parameters in an attempt to match field conditions within some acceptable criteria.The calibration was done manually with observed data of 1981 of the Ajali river watershed.
Fig: 4: Delineated Ajali River Watershed, Aguobu Umumba (Source: Researcher, 2016)
(a) Using CCMA model (b) Using GFDL model
Fig 5: Baseline Climate Change Impact for Ajali (1981 – 2000)
0 10 20 30 40 50 60
Dis
ch
ja
rge
ra
te
(c
m
s)
time (years)
Discharge observed (Climate 1981-2000) CCCMA
Discharge simulated(Climate 1981-2000) CCCMA
0 10 20 30 40 50 60
1/1/1981 1/1/1983 1/1/1985 1/1/1987 1/1/1989 1/1/1991 1/1/1993 1/1/1995 1/1/1997 1/1/1999
Dis
ch
ja
rge
ra
te
(c
m
s)
time (years)
Discharge observed (Climate 1981-2000)GFDL
Fig 5c: Expected Future Climate Change for Ajali (2046 – 2064)
7. SENSITIVITY ANALYSIS
The ability of a watershed model to sufficiently predict stream-flow for a specific application is evaluated through sensitivity analysis, calibration, validation and uncertainty analysis [21]. Sensitivity analysis determines the model input parameters that are key drivers of the model output.
8. MANUAL VALIDATION
After achieving the objective function for calibration, validation of the model ensues. Validation procedures are similar to calibration procedures in that predicted and measured values werecompared to determine if the objective function is met. This validation was also done manually with observed data of 1982.
9. RESULTS AND DISCUSSION 9.1 Climate Change Analysis
The results of the two climate change models - CCCMA (Canadian Centre for Climate Modelling and Analysis) and GFDL (Geophysical Fluids Dynamics Laboratory) models are represented in the charts of figures 5 (a-b) show 1981 – 2000 charts, each of which has 19 years of interval as baseline, whilefig.5c shows chart 2046 – 2064 which also has 19 years of interval as future prediction:
9.2 Calibration Results
The results of the calibration plot as shown in Figure 6.
Fig. 6: Calibration of Ajali river watershed using 1981 observed discharge data
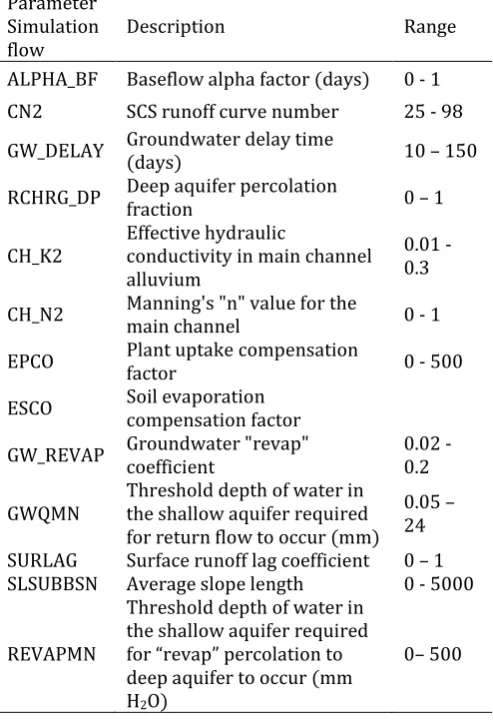
Table 1: SWAT parameters sensitive to streamflow at the study watershed
Parameter Simulation flow
Description Range
ALPHA_BF Baseflow alpha factor (days) 0 - 1
CN2 SCS runoff curve number 25 - 98
GW_DELAY Groundwater delay time
(days) 10 – 150
RCHRG_DP Deep aquifer percolation
fraction 0 – 1
CH_K2
Effective hydraulic
conductivity in main channel alluvium
0.01 - 0.3
CH_N2 Manning's "n" value for the
main channel 0 - 1
EPCO Plant uptake compensation factor 0 - 500
ESCO Soil evaporation
compensation factor
GW_REVAP Groundwater "revap" coefficient
0.02 - 0.2
GWQMN
Threshold depth of water in the shallow aquifer required for return flow to occur (mm)
0.05 – 24
SURLAG Surface runoff lag coefficient 0 – 1 SLSUBBSN Average slope length 0 - 5000
REVAPMN
Threshold depth of water in the shallow aquifer required for “revap” percolation to deep aquifer to occur (mm H2O)
0– 500
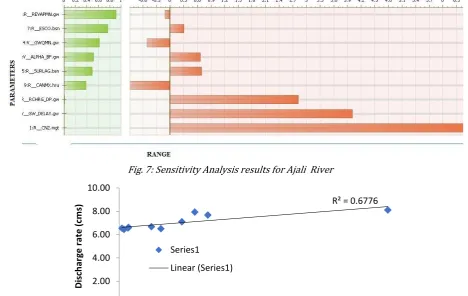
9.3 Results of Sensitivity Analysis
The sensitivity of SWAT – stimulated streamflow to SWAT input parameters was assessed using the automatic sensitivity analysis tool provided in the SWAT model.
The first step in the calibration and validation process in SWAT was the determination of the most sensitive parameters for a given watershed. This is called 0
20 40 60 80 100
1/1
/20
46
1/1
/20
47
1/1
/20
48
1/1/2049 1/1/2050 1/1/2051 1/1/2052 1/1/2053 1/1/2054 1/1/2055 1/1/2056 1/1/2057 1/1/2058 1/1/2059 1/1/2060 1/1
/20
61
1/1/2062 1/1/2063 1/1/2064
Dis
ch
ar
ge
ra
te
(c
m
s)
Time (years)
analysis is a ranking of model parameters according to how sensitive model outputs are to changes in the model input parameters. A sensitivity analysis was performed without observed data at the catchment outlet.
Only 9 parameters sensitive to streamflow were subjected to sensitivity analysis in the watershed. They include CN2, GW_DELAY, RCHRG_DP, R-CANMX, SURLAG, ALPHA_BF, GWQMN, ESCO, REVAPMN. The default parameters are based on the range suggested in SWAT user manual [7].
9.4 Validation results:
The results of the validation plot are shown in Figure 8. Table 2 gives detailed information on the two models used for the watershed. The calibration processes focused on adjusting the model-sensitive input parameters determined from the sensitivity analysis to
streamflow. Hydrological Models are usually evaluated using statistical analysis. The evaluation of hydrologic model behavior and performance is commonly made and reported through comparisons of simulated and observed variables [18]. In this study, SWAT model was evaluated using only Coefficient of determination (R2).
Generally, model simulation can be judged as satisfactory if R2> 0.50 for streamflow [19].
A comparison of observed and simulated streamflow hydrographs at Ajali River Watershed at monthly time steps showed good correlation for most parts of the calibration and the validation periods for the basin (figs. 6 and 8). Statistical analysis of the model results indicate that the monthly streamflow was well simulated for most of the calibration period, with R2 >0.5 for calibration and validation within the acceptable range of values.
Fig. 7: Sensitivity Analysis results for Ajali River
Fig 8: Validation of Ajali watershed using 1982 observed discharge data
Table 2: Climate change impact on streamflow of Ajali Watershed for the two GCM models
Year CCCCMA (m3/s) % Change GFDL(m3/s) % Change
1981 – 2000 18162.30 15231.39 - -
2046 – 2064 18546.02 383.72
(2.1) Increase
18789.97 3358.58
(18.9%) Increase R² = 0.6776
0.00 2.00 4.00 6.00 8.00 10.00
0 4 8 12
D
isch
ar
ge
r
ate
(c
m
s)
Time (Months) Series1
10. CONCLUSION
The SWAT model was successfully set-up, calibrated and validated for Ajali River Watershed using measured discharge data of 1981 – 2000. However, the observed discharge data for Ajali River watershed was not enough but the model was calibrated and validated using the available data. Statistics computed at calibration and validation showed that the monthly streamflow was well simulated in the SWAT for the Watershed during most of the calibration and validation periods.
The results of the two climate change models (CCCMA and GFDL) used for the climate change scenario analysis had been presented in figures 5a, b and c. While the CCCMA models showed an increase of 383.72m3/s and 2.1% in the streamflow of the Ajali
river watershed when projected to 2046 – 2064 as against the historical baseline, the GFDL model showed a highly significant increase of 3358.58 m3/s and 18.9%
in the streamflow of the Ajali river watershed. This is evident from the high climatic influences which has drastically aided flooding and has eroded the Watershed boundary.
More so, from Table 1, all sensitive parameters used in the modelling was enumerated showing their relative contribution to the performance of the watershed. Factors such as deep aquifer percolation fraction, high Plant uptake compensation factor, Soil evaporation compensation factor, Average slope length and Groundwater "revamp" coefficient were seen on the decrease leading to high soil surface removal in the water shed. It is therefore evident from this analysis that changes in the climatic variables of the area affect the nature, structure as well as the performance of the watershed stream to the Ajali River. Therefore, necessary remedies should be imbibed in reducing the effect and impact of climate change in our area. These remedies are beyond the scope of this paper but should be consulted to help ameliorate the highly negative effects of climate change on our natural resources.
11. REFERENCES
[1] Sead A., Bauwens W., Marwa A. “Impact of Land-use change and Climate Change on the Flows in
the Blue Nile River using SWAT”,
http://www.academia.edu/8453276/M.Sc._Thesi s; Accessed on June 12, 2016.
[2] Edward Linacre. “Climate data and resources: A reference and guide”. Taylor & Francis e-Library, 2005, pp3
[3] IPCC (Intergovernmental panel on climate change, 2007): climate change impacts, adaptation and vulnerability. Working Group II contribution to the Intergovernmental Panel on Climate Change Fourth Assessment Report. Summary for policymakers, 23.
[4] Abiodun, B. J., Salami, A. T. & Tadross, M. “Climate Change Scenarios for Nigeria: Understanding Biophysical Impacts”, Climate Systems Analysis Group, Cape Town, for Building Nigeria's Response to Climate Change Project, Nigerian Environmental Study/Action Team (NEST), Ibadan, Nigeria, 2011.
[5] UNCCC (United Nations framework convention on climate change), Nigeria’s first national communication. Ministry of Environment, Federal Republic of Nigeria; 2003.
[6] Kwabena, K. et al. ‘Impact of climate change on streamflow in selected river basins in Ghana’,
Hydrological Sciences Journal, 58:4, 2013, pp773-788.
[7] Neitsch, S. L., Arnold, J. G., Kiniry, J. R., Williams, J. R. “Soil and Water Assessment Tool,
(SWAT)-Theoretical Documentation: version
2009”,Agricultural Research Service and Texas A&M Blackland Research Centre, Temple, TX. USDA, 2011.
[8] Meyer, W. B. and B. L. Turner, II. Changes in Land Use and Land Cover: A Global Perspective, Cambridge University Press, Cambridge, 1994.
[9] Berhane, Fisseha G. “Model based assessment of potential impacts of climate change on the flow of the main headwaters of the Nile River: Equatorial Lakes Region and Blue Nile Basins”, University of Connecticut Graduate School, Master's Theses Paper 167,http://digitalcommons.uconn. edu/gs_theses/167 Accessed June 12, 2011.
[10] Park, J. Y., Park M. J., Ahn S. R., Park G. A., Yi,v., Kim G. S., R. Srinivasan, and Kim S. J. “Climate change impacts on water quantity and quality for a mountainous dam watershed in South Korea using SWAT”, Transactions of the ASABE Vol. 54(5): 1725-1737; 2011.
[11] Nweke, E. “Design and supervision of hydraulic structures for Enugu State NEWMAP”. Consultancy assignment between Nest Engineering and NEWMAP Enugu, June 30, 2015.
[12] Singh, V. P. and D. A Woolhiser. “Mathematical modelling of watershed hydrology”. Journal of Hydrol. Eng., 7(4):270-292., 2009.
Engineering Handbook, section 4, Hydrology. U. S. Dept. of Agriculture, available from U. S. Government Printing Office, Washington, D.C., 1972.
[15] Mein, R. G and Larson, C. L. “Modelling infiltration during a steady rain”, Water resources research 9(2):384-394; 1973.
[16] Gassman, P. W., Reyes, M. R., Green, C. H., Arnold, J. G. “The Soil and Water Assessment Tool: Historical Development, Applications, and Future Research Directions”. Transactions of ASABE
50(4): 1211-1250, 2007.
[17] Setegn, S. G, Srinivasan, R., and Dargahi, B. “Hydrological Modelling in the Lake Tana Basin, Ethiopia Using SWAT Model”, The Open Hydrology Journal, Vol.2, pp 49-62, 2008.
[18] Moriasi, D. N., Arnold J. G., Van Liew, M.W., Binger, R. L., Harmel, R. D., and Veith, T. L. ”Model evaluation guidelines for systematic quantification of accuracy in watershed
Agricultural and Biological Engineers (ASABE): 50 (3), 885–900, 2007.
[19] Ogwo, V., K. N. Ogbu, C. J. Okoye, G. I. Ezenne and C. C. Mbajiorgu. “Predicting Runoff and sediment yield from Agricultural watershed using Ann AGNPS: A case study of upper Ebonyi river basin, Enugu state”, In Mbajiorgu, C. C., Obeta, M. C., & Anyanwu, C. N., (eds), Water resources and National Development. Proceedings of the 5th
Nigerian Association of Hydrological science (NAHS) conference, 267-277, 2013.
[20] Zbigniew W. K. “New Uncertainty Concepts in Hydrology and Water Resources”, International Hydrology Series, Cambridge University Press, 2006.