11
Egypt. J. Soil. Sci. Vol. 55, No. 2, pp. 171-184 (2015)C
Evaluation of the Productivity of Two Soils Using
Productivity Index
Manal A. El-Nady
Soil Sciences Department, Faculty of Agriculture, Cairo University, Giza, Egypt.
ORN productivity data is needed to sustain the farm production.
…… This research was conducted to evaluate soil productivity of two different soil texture, clay loam (soil1)and loam (soil2) using three productivity index models (PI1, PI2 and PIM). Five soil properties were chosen to calculate the productivity index for the model PI1 namely, soil available water, soil bulk density, pH, EC, and root depth. Two more parameters, clay content and organic matter, were included in the original PI1 model to calculate PI2. The calculation of PIM index was depending on different irrigation treatments; i.e. 50%, 70%, 80% and 100% of available soil moisture and on crop evapotranspiration besides the soil properties used in the original PI1 model. Obtained results showed that the estimated values of PI1 were 0.57 and 0.52, whereas, for PI2 were 0.28 and 0.22 for soil1 and soil2, respectively. On the other hand, values of PIM increased as soil moisture increased. The highest PIM (0.46 and 0.45) were obtained with 80% irrigation treatment, whereas, the lowest PIM (0.34 and 0.33) were obtained with 50% irrigation treatment of soil1 and soil2, respectively. The results revealed that soil1 has higher productivity potential than soil2, where the calculated values of PI1, PI2 and PIM were higher for soil1 than for soil2. When comparing the calculated values of PI1, PI2 and PIM with the relative values of soil productivity, the PI1 values showed that both soils are very high productive soils. Whereas, PI2 showed that both soils have moderate productivity. In contrast, the PIM values under all irrigation treatments indicated that both soils have high soil productivity. The higher and lower corn yields corresponded to higher and lower productivity indices values, respectively in both soils. A highly significant correlation between seed yield and PIM (R2 = 0.97) was obtained. Whereas, the relationship between seed yield and actual evapotranspiration explained about 84% of the variation in corn yield (R2 =0.84). These results concluded that PI1 andPIM models were effective in quantifying soil productivity and seem to be good prediction models of corn yield.
Keywords: Productivity index, Models, Corn yield, Irrigation regimes, Soil properties.
Egypt. J. Soil. Sci. 55, No. 2 (2015)
predicting soil productivity have been a topic of much heated discussion since the early 1990s. Accurate estimates of future soil productivity are essential in making agricultural decisions. Brady and Weil (1999) reported that productivity emphasizes the capacity of soil to produce crops and should be expressed in terms of yield. Milner et al. (1996) also indicated that to assess soil productivity, soil information must be used. Nwite and Nandobi (2008) stated that using productivity index model in assessing the relative productive potential of soils enables periodic evaluation of the productivity of these soils.
The productivity can be quantified as a mathematical function of a soils ability to sufficiently sustain plant. Neill (1979) introduced the productivity index (PI) model, which is a derived measure of soil productivity. Its basic assumption according to Pierce et al. (1983) is that crop yield is a function of root development, which in turn is controlled by the soil environment. De wit and Van Kuelen (1987) indicated that simulation models enabled quantitative estimates of the growth and production of the main agricultural crops in many soils. Productivity indices (PI) provide a single scale on which soils may be rated according to their suitability for crop production (Imoro et al.,2012).
The PI model used an integrated approach to describe the relationship between plant productivity and soil properties on optimum vertical root distribution (Kiniry et al., 1983). The properties of soil within the rooting zone are major factors constraining crop growth and yield, (Gantzer & McCarty, 1987 and Lindstrom et al., 1992). In the PI model sufficiencies are assigned to soil properties. The original PI contained sufficiencies for potential available water capacity, bulk density, PH and electrical conductivity (Neill, 1979 and Delgado & Lopez, 1998).
Mc Cormack et al. (1982) indicated that the production capacity of a soil depends on available water capacity, soil tilth, plant nutrient storage, soil organic carbon and rooting depth. The PI was also modified adding clay content and organic matter content in parameters (Xingwu et al., 2009).
Garcia-Paredes et al. (2000) indicated that the sufficiency of PI model is effective in predicting productivity of agronomic crops. The sufficiency of a particular soil factor was based on a response curve relating the measured value for the factor to a dimensionless sufficiency between 0.0 and 1.0 (Pierce et al., 1983).
Egypt. J. Soil. Sci. 55, No. 2 (2015) wet years. Thus, soil water dynamics must be incorporated into the PI models to improve their predictive ability.
Kiniry et al. (1983) reported that the modified soil productivity index model is a hybrid of the productivity index (PI) and the models simulating soil moisture availability to plants and yield relationships. Modification should be made based on the soil properties and the relationships between different physicochemical properties of the study area (Gale et al., 1991 and Uadawatta & Henderson, 2003). Establishing an appropriate and accurate soil productivity assessment model is very important. The objectives of this study was to evaluate and compare the productivity of two soils using three productivity index models, introduced by Pierce et al. (1983) and Stocking & Pain (1983) and to demonstrate the relationship between productivity index models and yield of corn.
Material and Method
A study was carried out at the Agriculture Experiment Station, Faculty of Agriculture, Cairo University during the 2013 season using corn (zea mays L.) as an indicator crop . The experiment was laid out in a randomized complete block design with three replications. Plot area was 3.5 × 20.0 m. Soil samples were collected from three depths (0-20, 20-40 and 40-60cm) of the experimental soil to analyze the physical and chemical soil properties required for evaluating productivity models. Particle size distribution, bulk density and available water capacity were determined according to Klute (1986). The EC and the pH were measured according to Page et al. (1982). Mineral fertilizers (NPK) and the agricultural practices to all plots were applied according to recommendation of the Ministry of Agriculture. For the determination of PIM model, four irrigation treatments were applied 100%, 80%, 70% and 50% of soil available water. The irrigation application was calculated based on the average initial soil moisture content of the experimental area. Treatments were isolated by ditches of 2.0 m in width to avoid lateral movement of water. Soil samples were taken before and 48hr after each irrigation with auger to determine soil moisture content and calculating irrigation amounts to a depth of 60cm. Actual evapotranspiration was calculated accordingly (Hansen et al., 1979) using the following equation:
ETa = ((θ2- θ1) /100) × D
where, ETa is the actual evapotranspiration, mm/day. The θ2 and θ1 are the volumetric soil moisture content after and before irrigation and D is soil depth, mm. Corn single cross 101 was planted on June 5th using a spacing of 25 cm and 75 cm within and between rows, respectively.
Egypt. J. Soil. Sci. 55, No. 2 (2015)
Relationships between productivity index and seed yield of corn were determined using multiple regression analysis according to Steel and Torrie (1980).
The productivity index models Productivity index model (PI1)
The productivity index (PI1) introduced by Pierce et al. (1983) was expressed as follows:
PI1 =
where:
PI1 is productivity index.
is sufficiency of soil available water in the i th layer,
is sufficiency of soil bulk density in the i th layer,
is sufficiency of soil pH of the i th layer,
is sufficiency of soil electrical conductivity in th i the layer,
is root weighting factor of the i th soil layer n is the number of soil layers of the root zone depth.
Productivity index (PI2)
The productivity index (PI2) was a modification of PI1 by adding clay content ( ) and organic matter (OM ). Therefore, the parameters of the model included AWC, Bd, PH, EC, OM, CL and RI. The modified PI model (PI2) was as follows:
PI2 =
where:
Oi the sufficiency of OM in the ith layer;
CLi the sufficiency of clay content in the ith layer and other terms have the same meaning as in PI1
Modified productivity index (PIM)
The modified productivity index (PIM) introduced by Stocking and Pain,
(1983) was applied using Bd, pH , EC , root weighting factor and actual and potential evapotranspiration values of the different irrigation treatments, by removing parameter Ai from the PI1 model and combining these parameters with the equation developed by Doorenbos and Kassam (1979). The PIM equation is
expressed as follows:
PIM =
where:
Egypt. J. Soil. Sci. 55, No. 2 (2015) is actual crop evapotranspiration.
is potential evapotranspiration.
and other terms have the same meaning as in PI1
Sufficiency for studied soil properties
The sufficiencies for available water capacity ( , bulk density ( , pH ( and root weighting factor ( were determined according to Pierce et al. (1983). The sufficiency was determined using Fig. (1b). The determination of bulk density sufficiency, one has to obtain no limiting, critical and root limiting bulk densities which depend on soil texture classes given in Table 1 and then determine bulk density sufficiency value on the X-axis of Fig. (1a), the sufficiency value is then adjusted to take into account permeability rates by equation:
=1- (1- suffg) * ,
where: suffg is sufficiency of bulk density obtained from Fig. (1a) and is adjustment factor obtained from Table 2.
TABLE 1. Non limiting, critical and root-limiting bulk densities (Bd) for different texture classes (Pierce et al., 1983).
Family texture class Non limiting Bd (g.cm-3)
Critical Bd (g.cm-3)
Root limiting Bd (g. cm-3)
Sandy 1.60 1.69 1.85
Coarse loamy 1.50 1.63 1.80
Fine loamy 1.46 1.67 1.78
Coarse silt 1.43 1.67 1.79
Fine Silt 1.34 1.54 1.65
Clayey
35-45% 1.40 1.49 1.58
45% 1.30 1.39 1.47
(a) (b)
Fig. 1. Sufficiency of bulk density (a) and available water capacity (B) (Pierce et al.,
Egypt. J. Soil. Sci. 55, No. 2 (2015)
TABLE 2. Adjustment factors () for sufficiency of bulk density (Pierce et al., 1983). Family texture
class
Permeability (mm/h)
< 1.5 1.5-5.1 5.1-15.2 15.2-50.8 >50.8
Fine loamy 1.0 1.0 0.9 0.7 0.5
Coarse silt 1.0 1.0 1.0 0.9 0.7
Fine silt 1.0 1.0 0.9 0.7 0.5
Clay 35-60% 1.0 0.9 0.7 0.6 0.5
The pH sufficiency is determined using the following equations.
0.75 for pH >8.0
2.086 – 0.167 pH " 6.5 <pH 8.0
Di = 1.0 " 5.0 pH 6.5
0.12 + 0.16 pH " pH = 5.0 to 5.5 0.44 pH – 1.31 " pH = 2.9 to 5.0
The sufficiency of electrical conductivity, , is determined using the following equation (Kiniry et al., 1983): = 1.14 – 0.07 EC. where, EC is electrical conductivity (dS/m).
The sufficiency of weighting factor is equal to 1.0 because weighting factor expresses an ideal corn root distribution to 100 cm depth therefore; it is normalized to 1.0 (Pierce et al., 1983).
The sufficiency of clay content CLi (%) at the ith soil layer is according to Wan et al. (2001), as follows:
1……… 20≤ clayi≤40
clayi /20……… 0 < clayi <20
CLi = 100- clayi ………….
60
40< clayi < 100
0………... clayi = 0
The sufficiency of OMi (%) at the ith soil layer is according to Wan et al. (2001) as follows:
OMi/4……… 0% ≤ OMi <4%
OMi =
1……… 4% ≤ OMi
Result and Discussions
Soil properties of the studied soils
Egypt. J. Soil. Sci. 55, No. 2 (2015) given in Tables 4 & 5. The sufficiency for each depth was multiplied and summed to the number of depth increments (n) to estimate the PI1, PI2 and PIM, where, a value of zero indicates an absolutely limiting level of a soil property and a value of 1.0 indicates the optimum level (Kiniry et al., 1983). Sufficiency values of available water capacity were generally high at all depths of the two soils. These values ranged between 0.98 – 1.0 for soil1 and between 0.94 – 1.0 for soil2. Gantzer & McCarty (1987) and Pierce et al. (1983) stated that values of AWC less than 0.2 m3/m3, were defined as the critical level for crop production in the PI. Consequently, AWC is considered a stress factor in the (0-20 and 40-60 cm layers) of the first soil and in (20-40 and 40-60 cm layers) of the second soil. Sufficiency values of bulk density consistently remained the same (0.7) in all depths of the two soils. This may be due to the non limiting Bd values and the moderate permeability of the two soils. The sufficiency values of clay content and EC indicated that these properties were not limiting factors in the studied PI models.
TABLE 3. Soil physicochemical properties of the studied soils.
Soil properties
Soil depth
Soil (1) Soil (2)
0-20 20-40 40-60 0-20 20-40 40-60
Sand % 41.56 42.31 48.85 42.40 58.24 62.50
Silt % 31.10 29.42 29.76 35.39 22.60 21.19
Clay % 27.34 28.27 21.39 22.21 19.16 16.31
Texture C.L. C.L. L. L S.L S.L
AWC vol % 19.64 21.45 19.48 20.45 19.47 18.81
Bd g.cm-3 1.16 1.26 1.30 1.29 1.31 1.42
OM% 2.14 1.87 1.81 1.94 1.89 1.69
pH 7.37 7.62 7.90 7.80 7.94 8.20
EC dS/m 1.54 1.71 1.45 2.35 1.84 1.72
RI (cm) 100 100 100 100 100 100
The sufficiency values of OM are obviously low and decreased with increasing soil depth. Therefore, OM is a stress factor in both soils. Also, the sufficiency values of pH did not indicate the optimum level as they ranged between 0.77 and 0.86 for soil1 and between 0.75 and 0.78 for soil2.
The productivity indices (PI1&PI2)
Egypt. J. Soil. Sci. 55, No. 2 (2015)
productivity is increasing with its content. The sufficiency of OM is Low therefore, restricted the soil productivity.
TABLE 4. Ascribed sufficiencies and calculated productivity indices of the studied soils.
Soil properties
Soil depth
Soil (1) Soil (2)
0-20 20-40 40-60 0-20 20-40 40-60
AWC 0.89 0011 0.97 0011 0.87 0.84
Bd 1071 1071 1071 1071 1071 1071
CL 1.01 1.01 1.01 1.01 0.96 0.82
OM 0.54 0.47 0.45 0.49 0.47 0.42
PH 0.86 0.80 0.77 0.78 0.76 0.75
EC 1.01 1.01 1.01 0.98 1.01 1.01
RI 1.01 1.01 1.01 1.01 1.01 1.01
Calculated PI1 0.98 0.97 0.95 0.95 0.95 0.58
Mean PI1 0.97 0.55
Calculated PI2 0.32 0.57 0.55 0.56 0.23 0.17
Mean PI2 0.58 0.25
The results also showed that the mean PI2 for soil1 were higher than soil2. High productivity index indicated soil with improved soil properties, therefore, soil1 is more productive than soil2.
The modified productivity index (PIM)
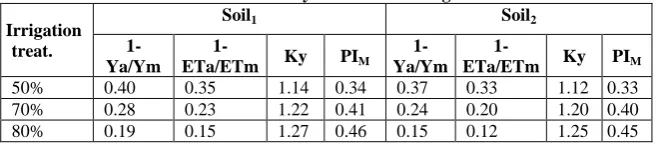
The modified productivity index PIM values are given in Table 5. The results showed that the variation in soil moisture content reflected on PIM values. The PIM increased as soil moisture increased. The PIM values followed the order of irrigation treatments of 80% > 70%> 50%. Irrigation with 80% of available water corresponds to PIM value of 0.46 and 0.45 whereas, irrigation with 50% of available water corresponding to, 0.34 and 0.33 for soil1 and soil2, respectively. These results concluded that PIM increased as soil water depletion decreased.
TABLE 5. The reduction in relative yield, relative evapotranspiration and PIM values
of the two soils as affected by the different irrigation treatments.
Irrigation treat.
Soil1 Soil2
1- Ya/Ym
1-ETa/ETm Ky PIM
1-Ya/Ym
1-ETa/ETm Ky PIM
50% 0.40 0.35 1.14 0.34 0.37 0.33 1.12 0.33
70% 0.28 0.23 1.22 0.41 0.24 0.20 1.20 0.40
80% 0.19 0.15 1.27 0.46 0.15 0.12 1.25 0.45
Seed yield of corn and productivity indices
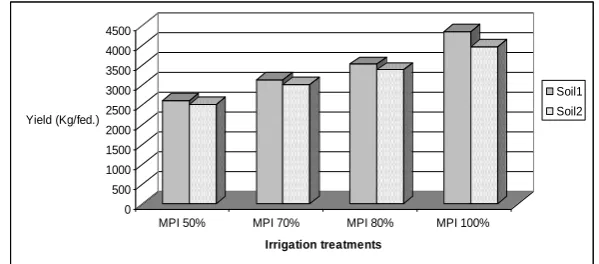
Egypt. J. Soil. Sci. 55, No. 2 (2015) suggest that differences in crop yield can be represented by productivity indices values. This finding agreed with Nwite (2002) and Anikwe (1999) who found that corn yield increased with the increase of PI and decreased with the decrease of it. The results concluded that as PI1, PI2 and PIM values decreased a general decline in seed yield of corn is recorded. Corn yield recorded with soil1 was higher than that recorded with soil2.Concerning the effect of different irrigation treatments on yield of corn and on productivity indices values, the results revealed that, the highest corn yield was obtained with 80% irrigation treatments, corresponding to PIM values of 0.46 and 0.45 with soil1 and soil2, respectively. Whereas, the lowest corn yield was obtained when irrigate with 50% of available water, corresponding to PIM values of 0.34 and 0.33 for soil1 and soil2, respectively. Seed yield declined when irrigation water decreased from 80% to 50% of available water in both soils. Galbiatti et al. (2004) concluded that yield of corn and its attributes were gradually increased as a result of increasing in the availability of soil moisture content. The data also showed that the mean seed yield of corn was higher with soil1, which recorded the highest PI values, as compared with soil2. Crop yields are usually used as a measure of soil productivity, therefore, the relationship between corn yield and productivity index was obtained. A significant relationship (R2 = 0.97) was found between seed yield of corn and PIM values as follows:
Yield= 49.74+7483.0 PIM
From the regression results, PIM model could explain about 97% of seed yield variation. This result proves that PIM model is a good yield prediction model.
0 500 1000 1500 2000 2500 3000 3500 4000 4500
Yield (Kg/fed.)
MPI 50% MPI 70% MPI 80% MPI 100% Irrigation treatments
Soil1 Soil2
Fig. 2. Seed yield of corn under different irrigation treatments of the two soils.
Actual evapotranspiration and seed yield
Egypt. J. Soil. Sci. 55, No. 2 (2015)
When using ETa as an indicator of PIM, a significant correlation (R 2
= 0.78) was found between ETa and PIM .The regression equation is as follows:
ETa= 27.72+961.70 PIM
The relationship between ETa and seed yield of corn was also obtained and the regression equation was as follows:
Yield = 435.5 + 6.32 ETa
The result showed that ETa could explain about 84% of the variations in corn yield (R2 = 0.84). The relationship between seed yield of corn and ETa could be used to predict seed yield of corn. However, the relationship between PIM and corn yield indicated a better relationship (R2 = 0.97). Mulengera and Payton, (1999) reported that PI model incorporating ETa explained about 87% of the variability.
0 100 200 300 400 500 600
ETa (mm)
MPI 50% MPI 70% MPI 80% MPI 100%
Irrigation treatments
Soil1 Soil2
Fig. 3. Evapotranspiration under different irrigation treatments of the two studied soils.
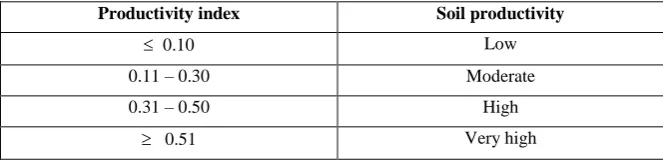
Evaluation of soil productivity
Evaluation of soil productivity was done according to Fernando (2002), (Table 6). Comparing the calculated PI1 , PI2 and PIM values with the relative data of productivity index in Table 6, the productivity of both soils obtained with PI1 is very high (> 0.51) whereas, with PI2 both soils have moderate productivity (0.11-0.30). The productivity of the two soils according to PIM values was depending on the irrigation treatments. Values of PIM represented high productive soils under the studied irrigation treatments.
TABLE 6. Evaluation of soil productivity in terms of the values of productivity index (Fernando, 2002).
Productivity index Soil productivity
0.10 Low
0.11 – 0.30 Moderate
0.31 – 0.50 High
Egypt. J. Soil. Sci. 55, No. 2 (2015) The results showed that PI1 and PIM values were higher than PI2 values; therefore, the PI2 model didn’t reflect the actual productivity level. Productivity index (PI) provides a single scale on which soils may be rated according to their suitability for crop production. The results indicated that soil physical and chemical properties could be limiting or non- limiting factors on the productivity of soils. The changes in soil moisture content influenced PIM values. The PIM model was able to demonstrate 97% of the variations in seed yield (R2=0.97). The PIM permits direct comparison between different soil moisture regimes on crop yield and can reflect the productivity level with different irrigation treatments.
References
Anikwe, M.A.N. (1999) Use of numerical index methods for quantifying the productivity of some soils in southeastern Nigeria, p. 180.
Brady, N.C. and Weil, R.R. (1999) The Nature and Properties of Soil. 12th ed. Prentice Hall, New Jersey, USA. P. 852.
Delgado, F. and Lopez, R. (1998) Evaluation of soil degradation impact on the productivity of Venezuelan soils. Adv. GeoEcol., 31و133-142.
De wit, C. T. and Van Kuelen, H. (1987) Modeling production of field crops and its requirements. Geoderma, 40, 253-265.
Doorenbos, J. and Kassam, A.H. (1979)Yield response to water. FAO Irrigation and Drainage Paper 33. FAO. Rome.
Fernando, D. (2002) A framework to make decisions in soil conservation for tropical mountains. 17th World Congress of Soil Sci. (WCSS), 14-21 August 2002, Thailand Symp. No.38.
Galbiatti, J. A., Borges, M. J., Bueno, L. F., Garcia, A. and Vieira, R. D. (2004) Effect of different irrigation periods in the development, yield and seedling quality in the maize (Zea mays L.) crop. Engenharia Agr´ıcola 24, 301–308 (In Portuguese, with English abstract).
Gale, M.R., Grigal, D.F., Harding, R.B. (1991) Soil productivity index: predictions of site quality for white spruce plantations. Soil Sci. Soc. Am. J. 55, 1701-1708.
Gantzer, C. J. and McCarty, T.R. (1987) Predicting corn yields on a clay using a soil productivity index. Trans. ASAE, 30,1347-1352.
Garcia-Paredes, J.D., Olson, K.R. and Lang, J.M. (2000) Predicting corn and soybean productivity for Illinois soils. Agricultural Systems, 64,151-170.
Egypt. J. Soil. Sci. 55, No. 2 (2015)
Imoro, A.Z., Daniel, O.A. and Augustine, E.A. (2012) Productivity index rating of some soils in the Tolon/ kumbungu district of the Northern region of Ghana. J.Soil Sci.and Envi. Manag. Vol.3(6),154-163.
Kiniry, L.M., Scrivener, C.L. and Keener, M.E. (1983). A soil productivity index based on water depletion and root growth. Res. Bull. 105 Colombia University of Missouri. p. 89.
Klute, A. (1986) Methods of Soil Analysis. Part1. 2nd
ed. ASA and SSSA. Madison, Wisconsin, USA.
Lindstrom, M.J., Schumacher, T.F., Jones, A.J. and Gantzer, C.J. (1992) Productivity index model comparison for selected soils in North Central United States. J. Soil and Water Conserv. 47 (6), 491-494.
McCormack, D.E., Young, K.K. and Kimberlin, L.W. (1982) Current criteria for determining soil loss tolerance. In: Determinants of soil loss tolerance. American Society Agronomy. p. 95-111.
Milner, K.S., Running, S.W. and Coble, D.W. (1996) Biopsical soil – site model for estimating potential productivity of forested land scape. Can. J. 55, 228-234.
Mulengera, M.K. and Payton, R.W. (1999) Modification of the productivity indix model. Soil Tillage Res. 52, 11-19.
Neill, L.L. (1979) An evaluation of soil productivity based on root growth and water depletion. M.Sc. Thesis, Univ. Missouri, USA. P. 78.
Nwite, J.N. (2002) Quantifying the productivity of selected soils in Nsukka and Abakaliki, Southeastern Nigeria using the productivity index. M.Sc. Thesis, University of Nigeria, Nsukka, p. 82.
Nwite, J. and Nandobi, M.E. (2008). Quantifyingthe productivity of selected soils in Nsukka and Abakaliki, Southeastern Nigeria using productivity index. J. Tropical Agric., Food, Enviro. and Extension. 7(3),170-178.
Page, A. L. (1982) Methods of Soil Analysis. Part 2. 2nd ed. ASA and SSSA, Madison, Wiscansin, USA.
Pierce, F.J., Larson, W.E., Dowdy, R.H. and Graham, W.A.P. (1983) Productivity of soils. Assessing long termchanges due to erosion. Soil and Water Cons. 38, 39-44.
Rhoads, F.M. and Bennett, J.M. (1990) Corn. In: Stewart, B.A. and Nielsen, D.R. (Ed.), Irrigation of Agricultural Crops. Agron., 30. American Society of Agronomy, Crop Science Society of America, and Soil Science Society of America, Madison, WI, pp. 569–637.
Riquier, J., Cornet, J.P. and Braniao, D.L. (1970) A new system of soil appraisal in terms of actual and potential productivity. 1st Approx. World Soil Res. FAO. p. 44. Steel, R.G.D. and Torrie, J.H. (1980) Principles and Procedures of Statistics, Second
Egypt. J. Soil. Sci. 55, No. 2 (2015) Stocking, M.A.(2003) Tropical soils and food security: the next 50 years. Sci. 302 (5649),
1356-1359.
Stocking, M.A. and Pain, A. (1983) Soil life and minimum soil depth for the productive yields: developing a new concept. Discussion paper no. 150. School of Development studies, University of East Anglia, Norwich, UK, P.24.
Timlin, D. J., Bryant, R. B., Snyder, V.A. and Wagenet, R.I. (1986) Modeling corn yield in relation to soil erosion using a water budget approach. Soil Sci. Soc. Am. J. 50, 718-723.
Uadawatta, R. P. and Henderson, G.S. (2003) Root distribution relationships to soil properties in Missouri oak stand: A productivity index approach. Amer. Soc. of Agri. Eng., 67, 1869-1878.
Wan, J. G., Yang, L. Z. and Shan, Y. H. (2001) Application of fuzzy mathematics to soil quality assessment. Acta Pedologica Sinica, 38, 176-183.
Xingwu, D., Yun, X., Yan-jie, F. and Shui-qing, Y. (2009) Study on the method of soil productivity assessment in black soil region of Northeast China. Agri. Sci. In China, 8 (4), 472-481.
Yang, J., Hammer, R.D. and Thompson, AL, et al. (2003) Predicting soybean yield in a dry and wet year using a soil productivity index. Plant Soil, 250,175-182.
Egypt. J. Soil. Sci. 55, No. 2 (2015)
ةيجاتنلأا ليلد مادختسإب ىضارلأا ضعب ةيجاتنإ مييقت
ىدانلا ىطاعملا وبأ لانم ضارلأا مسق ي – ةعارزلا ةيلك – ةرهاقلا ةعماج – ةزيجلا – رصم 0
وه ةساردلا هذه نم فدهلا مادختسإب ةرذلا لوصحمل ىضارلأا ضعب ةيجاتنإ مييقت
ةيضايرلا جذامنلا هذه نيب ةنراقم ءارجإو ةيضايرلا جذامنلا 0
ةثلاث تمدختسإ دقو
يه ةبرتلا ةيجاتنإ ريدقتل جذامن :
ةبرتلا ةيجاتنإ ليلد PI1
ةبرتلا ةيجاتنإ ليلدو PI2
لدعملا ليلدلاو ليلدلا اذهل ةيوضعلا ةداملا ةيمكو نيطلا ةبسن ةفاضإ مت ثيح ةبرتلا ةيجاتنلإ PIM
تلاماعم ىلع ءانب ةبرتلا ةيجاتنأ ةميق باسح ىلع دمتعي وهو
ىه ةفلتخم ىر ( 91 % ، 71 % ، 91 % ، 011 % رسيملا ءاملا نم 0)
تيرجأ
لأا نم نيعون ىلع ةساردلا ماوقلا ةفلتخم ىضار
( ةييمطو ، ةييمط ةينيط 0)
ةسوردملا ةبرتلا صاوخ فلاتخإب ةبرتلا ةيجاتنإ ميق رثأت جئاتنلا ترهظأو 0
دقو
ليلدلا ميق تداز PI1
ليلدلا ميقب ةنراقملاب PI2
0 ميق ترثأتو PIM
تلاماعم فلاتخإب
ىرلا ةلماعمل ىه ةميق ىلعأ تناك ثيح ىرلا 91
% او رسيملا ءاملا نم ةميق لق
ىرلا ةلماعمل ىه 91
% نيضرلأا نم لكل رسيملا ءاملا نم 0
ميقل عافترإ دجو PI1
و PI2 ةيناثلا ةبرتلاب ةنراقملاب ىلولأا ةبرتلل 0
ةردقملا ةيجاتنلأا ميق ةنراقمبو
ميقلا كلتب اهركذ قباسلا ةلدلأا مادختسإب ضرلأا ةيجاتنإ ليلدل ةيبسنلا
، ميق نأ دجو
PI1 ميق امنيب ،نيضرلأا نم لكل ًادج ىلاع ةبرتلا ةيجاتنإ لدعم نأ ىلع لدت PI2
ةيناثلا و ىلولأا ةبرتلل ةطسوتم ةيجاتنأ رهظت 0
ميقل ̋اعبت ةيلاع ةبرتلا ةيجاتنإ تناكو
ـل PIM ةفلتخملا ىرلا تلاماعم تحت كلذو 0
لوصحم لقأو ىلعأ نأ اضيأ دجو
̋ابحاصم ناك هيلع لوصحلا مت ةرذ جذامنلا مادختساب ةبوسحم ةميق لقأو ىلعلأ
ىلاوتلا ىلع ةيضايرلا 0
ةرذلا لوصحم نيب يونعم طابترا ةقلاع اضيأ تدجوو
نم لك ميقو نيضرلأا نم لكل PIM
و ETa ةرذلا لوصحم نيب طابترلأا تناكو
ميقو PIM ةلاح ىف اهنم ىلعأ .ETa
ةيضايرلا جذامنلا نإف كلذ ىلع ءانبو PI1
و PIM ه ةبرتلا ةيجاتنلإ ديج فصو ىطعتو ةبرتلا ةيجاتنإ ىلع ةديج ةلدأ ى
ةرذلا لوصحمل 0
جذومنلا حمسيو PIM
ىرلا تلاماعم نيب ةرشابملا ةنراقملاب
ةفلتخملا 0