ISSN(Online): 2320-9801
ISSN (Print): 2320-9798
I
nternational
J
ournal of
I
nnovative
R
esearch in
C
omputer
and
C
ommunication
E
ngineering
(An ISO 3297: 2007 Certified Organization)
Vol. 3, Issue 8, August 2015
Image Enhancement GUI using MATLAB
Poonam Kumari
1, Sanjeev Kumar Gupta
2M.Tech Scholar, Dept. of C.S., Banasthali Vidyapith Jaipur Campus, Jaipur, India1
Director, Devansh Softech Consultancy Services Pvt. Ltd., Agra, India2
ABSTRACT: In this paper, we present an overview of image enhancement processing techniques in spatial domain and developed its Graphical User Interface (GUI) in MATLAB. This paper describes the basic technological aspects of Digital Image Processing with reference to Enhancement in image processing. Image enhancement techniques help in improving the visibility of any portion or feature of the image, suppressing the information in other portions or features [1]. The enhancement procedures are applied to image data in order to effectively display the data for subsequent visual interpretation [2]. It involves techniques for increasing the visual distinction between features in a scene. There exists a wide variety of techniques for improving image quality. The contrast stretching, image negative, density slicing, edge enhancement, and spatial filtering are the more commonly used techniques. The existing techniques of image enhancement can be classified into two categories: Spatial Domain and Frequency domain.
KEYWORDS: Graphical User Interface, Histogram Processing, Image Enhancement, MATLAB, Point Processing, Spatial Domain Operations.
I. INTRODUCTION
A digital image is a representation of two-dimensional images as a finite set of digital values, called picture elements or pixels [1]. Digital Image Processing (DIP) involves the modification of digital data for improving the image qualities with the aid of computer. The processing helps in maximising clarity, sharpness and details of features of interest towards Information enhancement and further analysis [2].
Digital image processing is a broad subject and often involves procedures which can be mathematically complex, but central idea behind digital image processing is quite simple. These results form a new digital image that may be displayed or recorded in pictorial format or may it be further manipulated by additional computer programs [2].The Stages of Digital Image Processing in Image Enhancement is described in the fig. 1.
Fig1 Stages of Digital ImageProcessing: Image Enhancement
II. MATERIAL AND METHODS
A. GUI Tool Box
ISSN(Online): 2320-9801
ISSN (Print): 2320-9798
I
nternational
J
ournal of
I
nnovative
R
esearch in
C
omputer
and
C
ommunication
E
ngineering
(An ISO 3297: 2007 Certified Organization)
Vol. 3, Issue 8, August 2015
corresponding UIs, for other users [5]. The principles of good GUI design are, for the most part, timeless and universal. The Guide Tools include the already-mentioned Property Editor, the Call-back Editor, the Alignment Tool, and the Menu Editoretc. The fig. 2 shows the sample GUI using GUIDE in MATLAB.
1. Design Process Steps:- Define the task Draw the GUI Test the Design
Write the Code (use Guide) Test the Code
2. It falls naturally into two parts:
GUI design, or how to make something that‟s useful GUI implementation, or how to make something that works
Fig2 GUI Editor
B. Spatial Domain Techniques
The term spatial domain refers to the aggregate of pixels composing an image. Spatial domain methods are procedures that operate directly on these pixels [2]. Spatial Domain processes will be denoted by theexpression𝒈 𝒙, 𝒚 = 𝑻[𝒇 𝒙, 𝒚 ]Where 𝑔(𝑥, 𝑦) is an output image, 𝑓(𝑥, 𝑦) is an input image and T is an operator on f (or a set of input images), defined over neighbourhood of (𝑥, 𝑦)[4].The image enhancement in spatial domain described in the fig. 3.
Fig3 Image Enhancement in spatial Domain
1. Point Processing
Point operations, or image processing operations are applied to individual pixels only. The point operation is represented by
𝒈 𝒎, 𝒏 = 𝑻[𝒇(𝒎, 𝒏)]
Where 𝑓(𝑚, 𝑛)is the input image, 𝑔(𝑚, 𝑛) is the processed image, and T is the operator defining the modification process which operates on one pixel.Some examples or techniques of point processing are as follows:
Digital Image Negative
ISSN(Online): 2320-9801
ISSN (Print): 2320-9798
I
nternational
J
ournal of
I
nnovative
R
esearch in
C
omputer
and
C
ommunication
E
ngineering
(An ISO 3297: 2007 Certified Organization)
Vol. 3, Issue 8, August 2015
𝒔 = 𝑳 − 𝟏 − 𝒓Where, L – total number of grey levels[7].
Fig4 Image Negative
Piecewise Linear Transformation
The principal advantage of piecewise linear functions over the types of functions we have discussed thus far is that the form of piecewise functions can be arbitrarily complex. The principal disadvantage of piecewise functions is that their specification requires considerably more user input [8].
Contrast Stretching:This is done when the captured image has poor Illumination or lens aperture has been placed wrong. Idea behind contrast stretching is to make dark portion darker and bright portion brighter [8] as shown in fig. 5.
Fig5 Piecewise Linear Transformation
𝒔 =
𝑳 ∗ 𝒓; 𝒇𝒐𝒓 𝟎 ≤ 𝒓 ≤ 𝒂 𝒎 𝒓 − 𝒂 + 𝒗; 𝒇𝒐𝒓 𝒂 ≤ 𝒓 ≤ 𝒃 𝒏 𝒓 − 𝒃 + 𝒘; 𝒇𝒐𝒓 𝒃 ≤ 𝒓 ≤ 𝑳 − 𝟏
Thresholding: Extreme Contrast Stretching yields Thresholding. If r1 = r2, s1 = 0 & s2= L-1 Then we get Thresholding function. Expression becomes:
𝒔 = 𝟎; 𝒊𝒇 𝒓 ≤ 𝒂
𝑳 − 𝟏; 𝒊𝒇 𝒓 > 𝑎
Where, L is number of Grey levels[7]. Threshold images have maximum contrast as there are only BLACK & WHITE grey values as show in fig. 5.
Grey Level Slicing: Thresholding splits the image in 2 parts [7]. But at the time we need to highlight a specific
ISSN(Online): 2320-9801
ISSN (Print): 2320-9798
I
nternational
J
ournal of
I
nnovative
R
esearch in
C
omputer
and
C
ommunication
E
ngineering
(An ISO 3297: 2007 Certified Organization)
Vol. 3, Issue 8, August 2015
Fig6GrayLevel Slicing
Bit Plane Slicing: In bit plane slicing, each bit contributes to the formation of final image. Example of bit plane slicing is steganography.
Fig7 Bit Plane Slicing
Let us consider a 256x256 image with 256 grey levels. For eg- Black is represented as 00000000 and White as 11111111. Consider LSB value of each pixel & plot image. Continue till MSB is reached. All 8 images will be binary. The higher order bits contain majority of the visually significant data, while the lower order bits contain less details of image [7] as shown in fig. 7.
Power Law Transformation
Power-law transformations have the basic form𝒔 = 𝒄. 𝒓𝜸where c and 𝛾 are positive constants. Sometimes is written as𝒔 = 𝒄(𝒓 + 𝒆)𝜸high to account for an offset(that is, a measurable output when theinput is zero)[2][4]. However, offsets typically are an issue of display calibration andas a result they are normally ignored. Power LawTransform can be used to increase dynamic range of image.
Log Transformations
ISSN(Online): 2320-9801
ISSN (Print): 2320-9798
I
nternational
J
ournal of
I
nnovative
R
esearch in
C
omputer
and
C
ommunication
E
ngineering
(An ISO 3297: 2007 Certified Organization)
Vol. 3, Issue 8, August 2015
level values in the input image to a wider range of output levels as shown in fig. 8. The general form of the log transformation can be mathematically represented as[6]
𝒔 = 𝒄𝒍𝒐𝒈(𝟏 + 𝒓)
Where, 𝑠 is the output grey level, r is the input grey level and c is a constant. It is assumed that r ≥ 0.
Fig8 Log Transformation
2. Histogram Processing
The histogram of a digital image with grey levels in the range [0, L-1] is a discrete function
𝒉𝒓𝒌= 𝒏𝒌
Where rk is the kthgrey level and nk is the number of pixels in the image having gray level rk[2]. It is common practice to
normalize a histogram by dividing each of its values by the total number of pixels in the image, denoted by n. Thus, a normalized histogram is given by
𝒑 𝒓𝒌 =
𝒏𝒌
𝒏 𝒇𝒐𝒓 𝒌 = 𝒐, 𝟏, 𝒑, 𝑳 − 𝟏
Histogram Modelling
It is a technique used to increase the dynamic range of an image. In this method, we do not change the basic shape of the original histogram, but we spread it to the entire dynamic range. We achieve this by using a straight line equation asshown[8].
𝒔 = 𝑻 𝒓 = 𝒎 ∗ 𝒓 − 𝒓𝒎𝒊𝒏 + 𝒔𝒎𝒊𝒏
Where grey level of input image is
𝒎 = 𝒔𝒎𝒂𝒙− 𝒔𝒎𝒊𝒏
𝒓𝒎𝒂𝒙– 𝒓𝒎𝒊𝒏 𝒘𝒉𝒆𝒓𝒆
𝒓𝒎𝒂𝒙= 𝒎𝒂𝒙𝒊𝒎𝒖𝒎 𝒈𝒓𝒆𝒚 𝒍𝒆𝒗𝒆𝒍 𝒐𝒇 𝒊𝒏𝒑𝒖𝒕 𝒊𝒎𝒂𝒈𝒆
𝒓𝒎𝒊𝒏= 𝒎𝒊𝒏𝒊𝒎𝒖𝒎 𝒈𝒓𝒆𝒚 𝒍𝒆𝒗𝒆𝒍 𝒐𝒇 𝒊𝒏𝒑𝒖𝒕 𝒊𝒎𝒂𝒈𝒆
𝒔𝒎𝒂𝒙 = 𝒎𝒂𝒙𝒊𝒎𝒖𝒎 𝒈𝒓𝒆𝒚 𝒍𝒆𝒗𝒆𝒍 𝒐𝒇 𝒐𝒖𝒕𝒑𝒖𝒕 𝒊𝒎𝒂𝒈𝒆
𝒔𝒎𝒊𝒏= 𝒎𝒊𝒏𝒊𝒎𝒖𝒎 𝒈𝒓𝒆𝒚 𝒍𝒆𝒗𝒆𝒍 𝒐𝒇 𝒐𝒖𝒕𝒑𝒖𝒕 𝒊𝒎𝒂𝒈𝒆
This transformation function shifts and stretches the grey level range of the input image to occupy the entire dynamic
ISSN(Online): 2320-9801
ISSN (Print): 2320-9798
I
nternational
J
ournal of
I
nnovative
R
esearch in
C
omputer
and
C
ommunication
E
ngineering
(An ISO 3297: 2007 Certified Organization)
Vol. 3, Issue 8, August 2015
Fig9 Histogram Modelling
Histogram Equalization
Histogram equalization is the technique by which the dynamic range of the histogram of an image is increased[2]. It assigns the intensity values of pixels in the input image such that the output image as shown in fig. 10 contains a uniform distribution of intensities. It improves contrast and the goal of histogram equalization is to obtain a uniform histogram. This technique can be used on a whole image or just on a part of an image.
𝒐𝒊= 𝑵𝒋
𝒊
𝒋=𝟎
∗𝑴𝒂𝒙. 𝑰𝒏𝒕𝒆𝒏𝒔𝒊𝒕𝒚 𝑳𝒆𝒗𝒆𝒍
ISSN(Online): 2320-9801
ISSN (Print): 2320-9798
I
nternational
J
ournal of
I
nnovative
R
esearch in
C
omputer
and
C
ommunication
E
ngineering
(An ISO 3297: 2007 Certified Organization)
Vol. 3, Issue 8, August 2015
III. PROPOSED WORK
Many image enhancement techniques have been proposed. The principal objective of image enhancement is to modify attributes of an image to make it more suitable for a given task and a specific observer. During this process, one or more attributes of the image are modified. "It is important to keep in mind that enhancement is a very subjective area of image processing [3]. Improvement in quality of these degraded images can be achieved by using application of enhancement techniques [2]. Image enhancement approaches fall into two broad categories: spatial domain methods and frequency domain methods. The term spatial domain refers to the image plane itself, and approaches in this category are based on direct manipulation of pixels in an image. Frequency domain processing techniques are based on modifying the Fourier transform of an image [1]. In this paper I discussed about one of the techniques of Image Enhancement-Spatial domain in which I covered Point Processing, Histogram Processing Operations etc.
IV. CONCLUSION
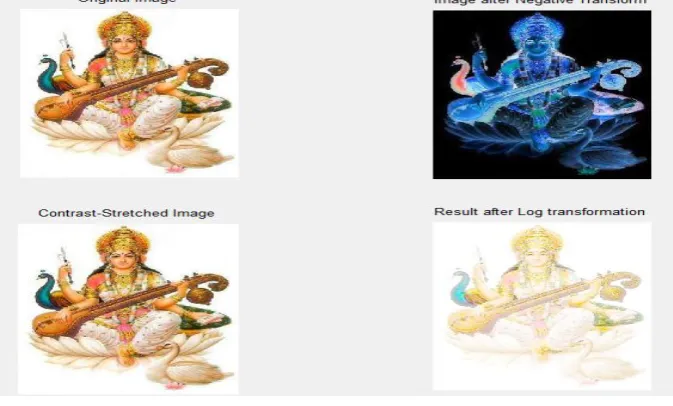
The study of various Image enhancement techniques in spatial domain has been successfully accomplished using Graphical user interface (GUI) on one image of goddess „SarswatiMaa‟ in this paper.In this paper, we focus on the existing techniques of image enhancement, which is spatial domain enhancement. The review of Image enhancement techniques in spatial domain is one of the most important and difficult component of digital image processing and the results for each method are also discussed here which describes the results of various techniques as shown in fig.11.We have also described recent development methods of image enhancement and point out promising directions on research for image enhancement in spatial domain and development of building GUI of the same for future research work.
Fig 11 Sample Output of developed GUI
REFERENCES
1. Anil K Jain, “Fundamentals of Digital Image Processing”, Ed X, Prentice-Hall of India Pvt. Ltd. New Delhi, 2003. 2. Gonzalez, Rafael C., and Richard E. Woods., “Digital Image Processing”,EdIII, Pearson Education Asia, New Delhi, 2007.
3. S.S. Bedi, and Rati Khandelwal, “Various Image Enhancement Techniques- A Critical Review”, International Journal of Advanced Research in Computer and Communication Engineering, Vol. 2, Issue 3, March 2013, ISSN (Online):2278-1021.
4. Snehal.O.Mundhada, and V.K.Shandilya,“Image Enhancement using a Combined Approach of Spatial and Transformation Domain Techniques”, International Journal of Emerging Research in Management &Technology, ISSN: 2278-9359, December 2012.
5. Building GUIs with MATLAB, Version 5.
6. Snehal.O.Mundhada, and V.K.Shandilya, “Spatial and Transformation Domain Techniques for Image Enhancement”, International Journal of Engineering Science and Innovative Technology (IJESIT), Vol. 1, Issue 2, November 2012, ISSN: 2319-5967, ISO 9001:2008 Certified. 7. Vimal Bibhu, Bhanu P.Lohani, Megha Vaid, Anjana Swanny, and Komal Verma, “Review of Image Enhancement in Spatial Domain”,
ISSN(Online): 2320-9801
ISSN (Print): 2320-9798
I
nternational
J
ournal of
I
nnovative
R
esearch in
C
omputer
and
C
ommunication
E
ngineering
(An ISO 3297: 2007 Certified Organization)
Vol. 3, Issue 8, August 2015
8. Shailendra Singh Negi, and BhumikGupta, “Survey Of Various Image Enhancement Techniques In Spatial Domain Using MATLAB”, International Journal of Computer Applications® (IJCA) (0975-8887), International Conference on Advances in Computer Engineering & Applications (ICACEA-2014) at IMSEC, GZB.
BIOGRAPHY
Poonam Kumariis M.Tech Scholar in the Computer Science Department, Banasthali Vidyapith, Jaipur Campus, Jaipur, India.