Vol.8 (2018) No. 1
ISSN: 2088-5334
Extraction of Morphological Features of Malaysian Rice Seed
Varieties Using Flatbed Scanner
R. Ruslan
#, A.A Aznan
#, F.A Azizan
#, N. Roslan
#, N. Zulkifli
# #School of Bioprocess Engineering, Universiti Malaysia Perlis, 02600 Arau, Perlis, Malaysia E-mail: [email protected]
Abstract— A high quality cultivated rice seeds are very important for Malaysian paddy industry to ensure a high yield of paddy production. Certified seeds that are mixed with other varieties and unwanted seeds such as weedy rice are considered as poor quality and faced rejection during a quality inspection by the Department of Agriculture. To ensure the seeds are cleaned from any foreign seeds, it is very important to develop a low cost and simple mechanism to classify the seeds according to its varieties. The use of a flatbed scanner is one of the alternative techniques for image acquisition of the seeds varieties. This study was carried out to evaluate morphological features of local rice seed varieties developed for Malaysian rice industry using image processing techniques. Image of four seed varieties, mainly are MR219, MR220, MR263, and MR269 were acquired and extracted using a normal desktop flatbed scanner. A LabVIEW program was developed to extract four main morphology features which are length, width, aspect ratio and rectangular aspect ratio. The extracted data were analysed in terms of its spread and variability. One-way ANOVA was done to compare the means of the morphological features. Further t-test analyses were done to distinguish between two seed varieties based on the variation in the morphological features of the seed kernel. The results indicated that seed length parameter extracted from the image acquired by the flatbed scanner is significant to differentiate the cultivated rice seed except for MR269 and MR220. Seed width can be used as a parameter to distinguish MR269 and MR220 pair. Thus, a combination of morphological parameters is necessary to classify the cultivated rice seed.
Keywords
—
rice seed; image acquisition; machine vision; classificationI. INTRODUCTION
The importance of Malaysian paddy seed production is reflected in the long-term plan of the seed industry development policies. The 4th National Agro Food Policy (NAP4) and Economic Transformation Programme (ETP) is expected to contribute about RM467 million GNI [1] to Malaysia.
The use of cultivated rice seeds that are contaminated by the weedy rice is the main source of weedy rice infestation in the paddy field, besides the availability of weedy rice seed bank in the soil [2], [3]. Weedy rice infestation has resulted in high yield losses to the farmers. Because of the taxonomic and physiological similarities existence between weedy rice and cultivated rice seeds, the physical separation of weedy rice seeds during processing to meet the minimum Standard Jabatan Pertanian Malaysia (SJPM-2009) specifications of 10 weedy rice seeds/kg of certified seeds has its limitation [4].
The introduction of the indented cylinder in the seed processing line before packaging of the cultivated rice seeds still could not guarantee the compliance to the standards.
According to the industry feedback, a strict adherent to the above standards with respect to maintaining the minimum level of weedy rice in a given seed lot could amount for the disqualification of the seed produced by the commercial producers.
The Department of Agriculture (DOA) Malaysia is the agency that is entrusted to regulate and legalized the production of registered and certified paddy seeds in Malaysia through the Paddy Seedling Verification Scheme. A sample of seeds lot produced from private seed producers is sent to the Seed Testing Laboratory for verification before each of the seeds are released to the farmers.
improve the process of identification and verification of weedy rice seed beyond the current tedious physical approach.
The usage of camera vision and image processing technique has been proven by other research works in identifying different varieties of rice seeds by having correct classification up to 99.99% [5]-[7]. Among the ASEAN countries, use of image processing in rice seed classification and identification research has increased. Reference [7] managed to classify six different rice seed varieties from Northern Vietnam by using simple features extracted from the image at an average accuracy of 90.54 %. Thailand has developed a computer system called Plant Seed Image Recognition System which can recognize a plant seed image by employing the Euclidean distance technique with a precision rate 95.1% for matching in training dataset [8]. Reference [9] has also developed an application using machine vision technique to assess paddy seed germination using images from a digital camera. For Malaysian seed industry, evaluation of the morphological features of five main weedy rice seed variants known as C1 (close panicle), C2 (partly short-awned, open panicle), C3 (close panicle), C4 (partly short-awned, close panicle) and C5 (partly long awned, close panicle) has been done [10]. The images were captured using a CCD camera system setup, and analyses have been done to distinguish between the weedy rice seed variants due to its similar morphology features.
With the advancement of digital image and processing technique, it is necessary to find a low cost and affordable alternative in acquiring an image. The current technique requires a setup on the CCD camera or digital camera as carried out by previous studies [7]-[10].
Thus, the objective of this research is to develop a low cost and reliable methodology to extract morphology features of Malaysian cultivated rice seeds. Thus, in this research project, a flatbed scanner was used to replace an expensive CCD camera setup for image acquisition.
II. MATERIAL AND METHOD
A. Rice Seed Samples
Four different varieties of local rice seeds namely MR219, MR220, MR263, and MR269 were used in the study. The rice seed varieties were purchased from local seed suppliers around Perlis, Malaysia. 100 seeds per variety were manually selected and cleaned from foreign matter such as dust, dirt, and stones. The seed samples were kept in an airtight container and maintained its moisture content at 11% for image acquisition.
B. Experimental Setup and Image Acquisition
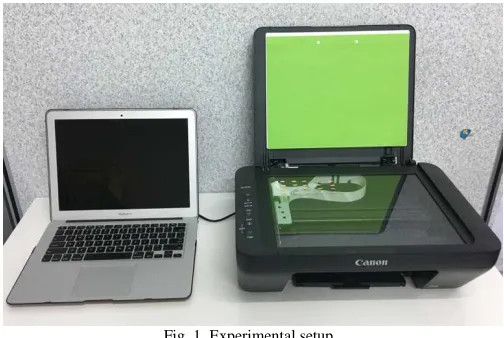
A low cost and affordable technique by using a common multifunction printer-scanner were used in this study to acquire images of rice seed varieties as in Fig. 1. Rice seeds on a matrix of 4 by 5 were arranged on the scanner plate to capture 20 seeds per image as in Fig. 3. Fluorescent green color was used as a background of the image which provides the highest contrast between seed and the background. The image resolution was set to 600 dpi and saved in Joint Photographic Expert Group (JPEG) format. The acquired
images were loaded to LabVIEW environment for further image processing and morphology extraction.
Fig. 1 Experimental setup
C. Image Processing
LabVIEW (2012) software application was used for image processing and morphological features extraction [11]. Image processing used to enhance and convert rice seeds images into digital form before useful information can be extracted.
LabVIEW programme for image processing was developed to extract morphology characteristics of the rice seed varieties. The programme was designed to meet specific requirements involving steps of the image processing and extraction of the parameters of the seed kernel.
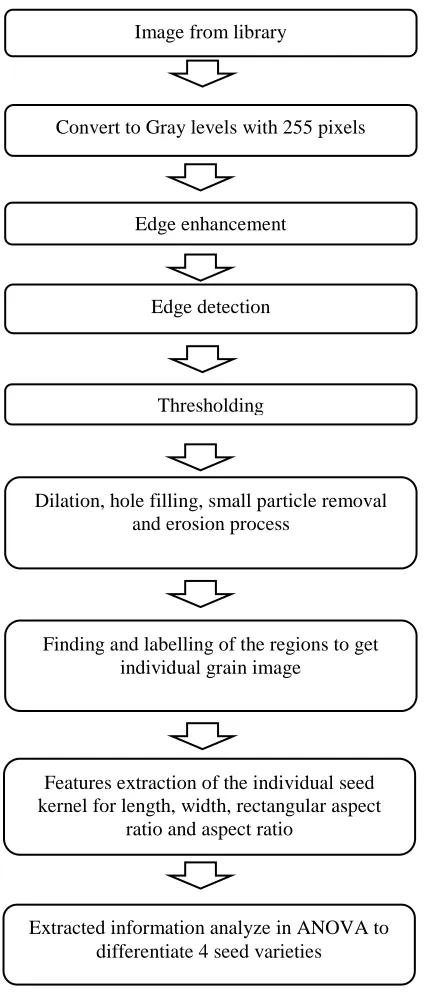
Fig. 2 shows the flow diagram of the image analysis starting from image acquisition from the library of the computer and ends with statistical analysis using ANOVA to differentiate the four seed varieties. The process flow for image processing in Fig. 1 is widely used in computer vision involving other applications such as textiles [12] and biomedical [13].
The rice seed image acquired from the scanner was loaded in LabVIEW programme developed for this study. The image was extracted by the red colour plane. Then the image was converted to grey scale image for further processing. Laplacian filters were used as edge enhancement. Then the image was the threshold to separate the seed kernel from the background as in Fig. 4. Dilation was performed to close contours of every seeds image [14]. Then the images were cleaned from noisy particles formed on the background image before filling the seed kernel pixels with binary number 1. After filling operation, the corresponding non-zero pixel values were copied in the masking process to display the processed image (Fig. 5). The edge of the binary image was detected to acquire the values needed to compute each of the morphological features.
D. Features Extraction
seed kernel are as in Fig. 6. The aspect ratio features were derived from the extracted parameters for major axis length and minor axis length. Major axis length was the distance between the endpoints of the longest line that could be drawn through the seed. The minor axis length was the distance between the endpoints of the longest line that could be drawn through the seed while maintaining perpendicularity with the major axis. The definition for each parameter chosen for this study is as presented in Table 1 [15].
Fig. 2 Flowchart of the image analysis
Fig. 3 Example of rice seed image (MR219) acquired from the multifunction printer-scanner
Fig. 4 Example of rice seeds image (MR219) after grayscale and threshold to separate from the background of the image
Fig. 5 Example of rice seeds image (MR219) after masking operation TABLEI
MORPHOLOGICAL FEATURES DESCRIPTION
No Morphological
Features Description
1 Length (mm) The length of the rectangle
bounding seed
2 Width (mm) The width of the rectangle
bounding seed
3 Rectangular aspect
ratio Length/Width
4 Aspect ratio Major Axis Length/Minor
Axis Length Dilation, hole filling, small particle removal
and erosion process
Finding and labelling of the regions to get individual grain image
Features extraction of the individual seed kernel for length, width, rectangular aspect
ratio and aspect ratio
Extracted information analyze in ANOVA to differentiate 4 seed varieties
Image from library
Thresholding Edge detection
Convert to Gray levels with 255 pixels
Fig. 6 Morphological features for a (length) and b (width) of a single seed kernel
E. Data Analysis
The morphology features were analysed on the distribution of the data through descriptive analysis and one-way analysis of variance (ANOVA) to compare the means of each morphological characteristic between varieties of MR219, MR220, MR263, and MR269. To further analyse the significant difference of each variety, t-test analysis was conducted between the varieties. The significant levels of the analyses were established at 95%.
III.RESULTS AND DISCUSSION
Data from image processing was collected for the morphology parameter such as length, width, rectangular aspect ratio and aspect ratio.
A. Descriptive Analysis of the Extracted Features from
Image Processing
Morphology features extracted from the image processing technique were analysed in terms of its mean, median, range and interquartile range as tabulated in Table 2 to Table 5 for each of the morphological features. Box plot analysis was constructed to look at the variability of the data distribution pattern on each of the features.
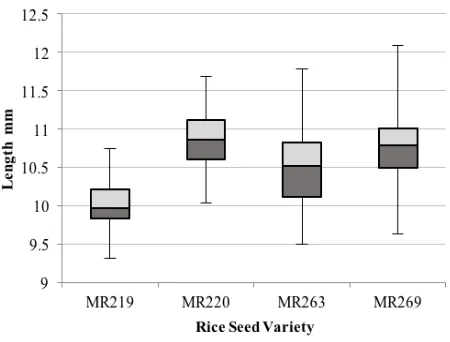
Fig. 7 shows normal distribution of the seed length acquired from the image processing technique. The median length of MR220 is greater than the median of other seed varieties. MR219 shows the lowest median length as compared to MR220, MR263, and MR269. MR263 has wider spread as compared to other seed varieties with the highest interquartile range of 0.70 mm. MR269 length data has high variability with overall range (2.45 mm) greater than other seed varieties. The small interquartile range was observed and thus showing that 50% of the data is more similar in the center of the data sets with the lowest 0.38 mm (MR219).
MR220 average seed’s length is 10.82 ± 0.35 mm while the average of MR219 seed’s length is 9.99 ± 0.32 mm similar to the average seed length acquired from [16]. Reference [16] reported the average seed length for MR219 and MR220 were 10.36 ± 0.32 mm and 10.39 ± 0.19 mm, respectively when acquired manually.
It is known that MR220 is a sister line to MR 219 with advantage to MR220 in terms of higher seed’s length and width, and higher seed’s weight. MR220 seeds are slenderer and categorized as a long grain kernel as compared to MR219.
TABLEII
DESCRIPTIVE STATISTICS FOR LENGTH
Parameter MR219 MR220 MR263 MR269
Mean (mm) 9.99 10.82 10.50 10.78
Median (mm)
9.97 10.86 10.52 10.79
Interquartile Range (mm)
0.38 0.52 0.70 0.52
Range (mm) 1.43 1.64 2.28 2.45
Fig. 7 Box plot analysis for length
Fig. 8 displays the normally distributed data of the seed’s width. The highest median width is MR269 (2.99 mm), and the lowest median is MR219 (2.88 mm). All the four varieties show almost similar width with the highest variability range was 1.8 mm for MR263 (Table 3). The lowest interquartile range is 0.20 mm for MR220, thus showing 50% of the data is more similar in the center of the dataset.
TABLEIII
DESCRIPTIVE STATISTICS FOR WIDTH
Parameter MR219 MR220 MR263 MR269
Mean (mm) 2.97 2.86 3.02 3.03
Median (mm) 2.93 2.88 2.93 2.99
Interquartile Range (mm)
0.25 0.20 0.29 0.25
Range (mm) 1.42 1.44 1.80 1.29
Fig. 8 Box plot analysis for width
The average width acquired from the image was slightly higher from the actual values from [16] for MR219 (2.97 ± 0.25 mm) and MR220 (2.86 ± 0.18 mm). Reference [16] found that the average width for MR219 and MR220 when manually sampled were 2.46 ± 0.12 mm and 2.50 ± 0.08 mm, respectively.
with the highest 3.51 mm (MR220) and the lowest 3.34 mm (MR263). The small interquartile range can be observed showing 50% of the datasets are consistent to the center with the lowest 0.25 mm (MR219).
Fig. 9 Box plot analysis for rectangular aspect ratio TABLEIV
DESCRIPTIVE STATISTICS FOR RECTANGULAR ASPECT RATIO
Parameter MR219 MR220 MR263 MR269
Mean (mm) 3.40 3.52 3.34 3.46
Median (mm) 3.43 3.51 3.34 3.44
Interquartile Range (mm)
0.25 0.26 0.33 0.33
Range (mm) 1.59 1.55 1.59 1.71
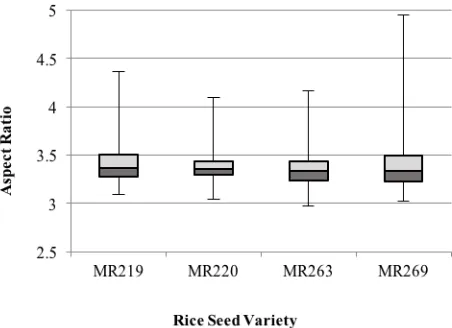
Fig. 10 shows the distribution of datasets for aspect ratio. Aspect ratio is a measurement of the major axis length divided to minor axis length acquired from the image of the seeds. The major and minor axis length was extracted from the image pixel according to [17]. Similar median aspect ratio was observed in the datasets which fall between 3.34 to 3.36 mm as in Table 5. MR269 indicates higher variability with a range of 1.93 mm in comparison to MR220 which less varied with a range of 1.05 mm. The data was consistent at the center of 50% with small interquartile range was observed between 0.25 to 0.33 mm.
Fig. 10 Box plot analysis for aspect ratio
Table 6 shows the results of one-way ANOVA to compare the means of morphological features of the rice seed varieties of MR219, MR220, MR263, and MR269. The one-way ANOVA revealed that there was a significant difference among the varieties in terms of its length, width
and rectangular aspect ratio. Aspect ratio found to be not significant to differentiate the varieties of the rice seeds.
TABLEV
DESCRIPTIVE STATISTICS FOR ASPECT RATIO
Parameter MR219 MR220 MR263 MR269
Mean (mm) 3.40 3.39 3.35 3.40
Median (mm) 3.36 3.36 3.34 3.34
Interquartile Range (mm)
0.25 0.26 0.33 0.33
Range (mm) 1.28 1.05 1.19 1.93
TABLEVI
ONE-WAY ANOVA TO COMPARE THE MEANS OF MORPHOLOGICAL CHARACTERISTICS OF RICE SEED VARIETIES
Morphological
Characteristics SS df MS F P value
Length 43.09 3 14.37 83.98 4.57E-42
Width 1.68 3 0.56 10.38 1.38E-6
Rectangular Aspect Ratio
1.64 3 0.55 7.99 3.5E-5
Aspect Ratio 0.20 3 0.07 1.39 0.25
Table 7 shows the comparison of the actual mean values between two rice seed varieties in relation to its variation in the morphological features using Students' t-test analysis. P-value higher than 0.05 at 95% confidence level, indicates that there are no significant differences between the two rice seed varieties.
Comparison of MR220-MR269 seed varieties revealed to be the most insignificant pair to be differentiated according to seed length, rectangular aspect ratio, and aspect ratio. Only width parameter has a significant difference in terms of the morphology of the two varieties. Meanwhile, MR219-MR263 pair has similar mean values for width and aspect ratio of the seed kernel. MR263-MR269 pair indicates that width and rectangular aspect ratio is insignificant to differentiate the two seed varieties while MR219-MR269 pair is insignificant differences in the mean values of seed rectangular aspect ratio and aspect ratio.
Table 7 revealed that rectangular aspect ratio and aspect ratio parameters to be insignificant to differentiate the rice seeds varieties. Seed length can be used as a simple parameter to distinguish seeds variety except for MR269 and MR220. These varieties can be distinguished by means of the seed width.
The insignificant differences in the mean values of the morphological parameters indicate that one morphological parameter is insufficient to distinguish between seed varieties, as found in similar studies [10]. Combination of many other morphological parameters such as major axis length, minor axis length, area and thinness ratio can be considered for further classification of the seed varieties to achieve higher accuracy in classification.
IV.CONCLUSION
could be used for image processing in the extraction of four simple morphology features of the rice seed varieties.
Data distribution for the extracted features such as length and width using image acquired from the flatbed scanner were in agreement to the manual acquisition of the data from the previous study. Comparison of the overall means of the parameters concluded that the aspect ratio parameter is insignificant to differentiate the seed kernel varieties. Further analyses for each pair of the seed varieties found that single parameter is not adequate to classify the seed varieties. Seed length is the most significant parameter in this report to
distinguish the seed varieties except for pair MR220-MR269 since it has similar means value. It is highly recommended to extract more information other than morphology in order to achieve higher seed classification in future.
ACKNOWLEDGMENT
We would like to thank Ministry of Higher Education Malaysia for funding this research under the Fundamental Research Grant Scheme (FRGS) 9003-00388 and Universiti Malaysia Perlis for the facilities provided.
TABLEVII
T-TEST OF MORPHOLOGICAL CHARACTERISTICS FOR EACH RICE SEED VARIETIES
Morphological Characteristics
R
ic
e
S
ee
d
V
a
ri
et
ie
s
Groups
Rice Seed Varieties P-Value
MR219 MR220 MR263 MR269
Length (mm) MR219 1 0.000
0.000 0.000
MR220 1 0.000 0.391
MR263 1 0.000
MR269 1
Width (mm) MR219 1 0.001 0.198 0.046
MR220 1 0.000 0.000
MR263 1 0.778 MR269 1
Rectangular Aspect Ratio MR219 1 0.711 0.040 0.960
MR220 1 0.082 0.796 MR263
1 0.134 MR269 1
Aspect Ratio MR219 1 0.001 0.126 0.172
MR220 1 0.000 0.104 MR263 1 0.005
MR269 1 REFERENCES
[1] Management and Delivery Unit (PEMANDU), “Economic Transformation Programme. Chapter 15 NKEA Agriculture Performance”, Prime Minister’s Department of Malaysia, 2010 [2] R. Labrada,“The need for improved weed management in rice,” in:
Proceedings of the 20th Session of the International Rice Commision. Bangkok, Thailand, 2002
[3] M. Azmi,S. Azlan, K. M. Yim, T.V. George, and S.E Chew, “Control of Weedy Rice in Direct-Seeded Rice Using Clearfield Production System in Malaysia.” Pak. K. Weed Sci. Res., vol 18, pp. 49-53, 2012 [4] Department of Agriculture Standard (SJPM-2009) Specification for
Rice Seed Production, Department of Agriculture Malaysia, 2011 [5] A. Ou Yang, R. Gao, Y. Liu, X. Sun, Y. Pan and X. Dong, “An
Automatic Method for Identifying Different Variety of Rice Seeds Using Machine Vision Technology”. ICNC, pp 84-88, 2010
[6] S.G Harish and M. Siddappa, “A method for Identification of Basmati Rice Grain of India and Its Quality Using Pattern Classification.” International Journal of Engineering Research and Application (IJERA) Vol 3(1), pp 268-273, 2013
[7] P.T.T. Hong, T.T Than-Hai, L. Thi-Lan, V.T. Hoang, V. Hai,and T.T. Nguyen, “Comparative Study on Vision Based Rice Seed Varieties Identification,” 7th Int. Conf. on Knowledge and Systems Eng., IEEE, pp 377-382, 2015
[8] B. Lurstwut, & C. Pornpanomchai, “Plant seed image recognition system.”Int. J. of Eng. and Tech., vol 3(6), pp. 600-605, 2011 [9] B. Lurstwut, & C. Pornpanomchai, “Application of Image Processing
and Computer Vision on Rice Seed Germination Analysis,” Int. J. of App. Eng. Research, vol 11 (9), pp. 6800-6807, 2016.
[10] A.A. Aznan, I.H. Rukunudin, A.Y.M. Shakaff, R. Ruslan, A. Zakaria and F.S.A. Saad. “Application of Image Processing Technique to
Extract Morphological Characteristics of Weedy Rice Seeds Variants for Malaysian Seed Industry”. Adv. Environ. Biol., vol 8(22), pp. 112-115, 2014
[11] “IMAQ Vision for LabVIEW User Manual,”National Instruments Corp, Austin, Texas, 2000
[12] Yuhandri, M. Sarifuddin, W. Eri Prasetyo and Karmilasari,"Object Feature Extraction of Songket Image Using Chain Code Algorithm, "International Journal on Advanced Science, Engineering and Information Technology, vol. 7, no. 1, pp. 235-241, 2017.
[13] Jufriadif Na`am, Johan Harlan, Sarifuddin Madenda and Eri Prasetio Wibowo, “The Algorithm of Image Edge Detection on Panoramic Dental X-Ray using Multiple Morphological Gradient (mMG) Method”, International Journal on Advanced Science, Engineering and Information Technology, vol. 6, no. 6, pp. 1012-1018, 2016.
[14] F.G. Hernandez and J.G. Gil, “A machine vision system for classification of wheat and barley grain kernels”. Spanish Journal of Agricultural Research, vol 9(3), pp. 672-680, 2011
[15] Y. Liu,C. Fang,Y. B. Yi, and R.Q. Xin, “Identification of rice seed varieties using neural network.”Journal of Zhejiang Uni. Science, Vol 6b(11), pp.1095-1100, 2005
[16] I. Alias, O. Othman, H. Mohamad, A. Saad, H. Habibuddin, A.B Abd Rahman, and S. Azlan. “New Rice Variety MR220”. Buletin Teknologi Tanaman, vol 2, pp 7-13, 2005