Vol.9 (2019) No. 1
ISSN: 2088-5334
A Modified Event Grouping Based Algorithm for the University
Course Timetabling Problem
Velin Kralev
#1, Radoslava Kraleva
#2, Sachin Kumar
* #Department of Informatics, South-West University "Neofit Rilski," 66 Ivan Michailov Str., Blagoevgrad, 2700, Bulgaria E-mail: [email protected]; [email protected]
* College of Information Business Systems, NUST MISIS, Leninsky Prosp. 4, 119049 Moscow, Russia E-mail: [email protected]
Abstract— This paper presents a study of a modified event grouping based algorithm (MEGB) for university course timetabling problem (UCTP). Multiple models to describe the problem and multiple approaches to solving it are pointed out. The main idea of the modification is that through reduction on the generated solutions the execution time of the standard event grouping based algorithm (EGB) will be reduced, too. Also, an implementation of the modified algorithm based on the described approach is presented. The methodology, conditions and the aims of the experiment are described. The experimental results are analyzed and conclusions are made. When increasing the number of the groups, the execution time of the MEGB algorithm increases and equates with the execution time of the EGB algorithm. The best results are obtained with the first 30% of the groups formed. In these groupings, the execution time of the MEGB algorithm is much less than the execution time of the EGB algorithm. This is because, in the EGB algorithm, every change in the event ordinance creates a new timetable, and all events are repositioned on it. This process is optimized by creating a partial timetable, whereby the ordinance of events in groups before the current does not change. In addition, a comparative analysis between the MEGB algorithm and two other algorithms for UCTP, respectively a genetic algorithm with the local search method (GALS) and a local search algorithm based on chromatic classes (CCLS) is made as well. The obtained results show that the MEGB algorithm and the CCLS algorithm generate better solutions for smaller input data sets, while the GALS algorithm generates better solutions for larger input data sets. However, in terms of the execution time, it was ascertained that the GALS algorithm runs slowest among the others.
Keywords— university course timetabling problem; local search; genetic algorithm; modified event grouping based algorithm.
I. INTRODUCTION
The University Course Timetabling Problem (UCTP) is a combinatorial optimization problem [1]. It is NP-hard [2], but it has been intensively studied [3], [4]. The heuristic approaches (meta-heuristic, hyper-heuristic, and population-based approaches) give better results than the other approaches (based on constructive heuristics) [5], [6]. With this problem, if e events and t time slots are defined, (e– 1)!.e2.t checks for positioning the events on the timetable must be made [7].
Many algorithms solve approximately the UCTP and other problems [8] and [9]. The constraint-based algorithms are these algorithms where additional techniques are used, such as trees and graphs, "depth-first search," population-based approaches combined with "backtracking," and others [10]. The knowledge-based and case-based reasoning algorithms are the ones where the techniques used are sets of rules and graphs with edges associated with events [11]. The
group of hyper heuristic and metaheuristic based algorithms includes approaches such as: local search [12], [13], great deluge [14], variable neighborhood search [15], ant colony optimization [16], [17], simulated annealing [18], [19] and other [20]. The aim is to find the most appropriate approach for a specific problem. The group of population-based algorithms includes genetic and mimetic approaches [21]. The results obtained with these methods are good [22]. In the graph-based and graph coloring based algorithms, the described problem is transformed into a graph coloring problem (GCP) [23].
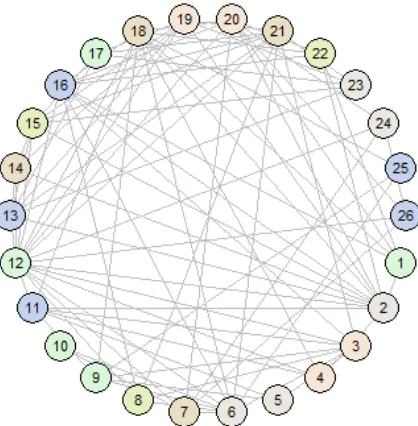
The relationship between the UCTP and the GCP can be presented by an undirected graph G (Fig. 1).
Fig. 1 The graph G with 26 vertices and 90 edges
Edges represent the conflicts between the different events in graph G. Each edge connects two vertices (events) and shows that there is a conflict between them. This conflict can be caused by the use of one or more common resources – students, lecturer, and room.
Fig. 2 The colored graph G with 6 chromatic classes
The vertices (events) without conflicts between them form independent sets. These independent sets are groups of vertices in graph G. There are no connecting edges between the vertices from an independent set. In the graph theory, these independent sets are called chromatic classes, but in [24] the term "groups" is used. The vertices of the same chromatic class (corresponding to one group of events) are colored in the same color Fig. 2.
Thus, the individual events in a given group (forming a chromatic class) can be positioned into every time slot on the timetable independently of each other. This is because these
events do not use common (shared) resources, so they are not in conflict with each other. For clarity, each chromatic class of vertices is presented in a separate column (Fig. 3).
Fig. 3 The chromatic classes arrangedincolumns
The presented approach has been successfully used to solve UCTP and the results obtained were good [23]. A variable neighborhood search based algorithm – VNS is presented [15]. The results show that the neighborhood structures (of events) influence on the precision of the solution. An event grouping based algorithm [24] – EGB using the model is described [7]. In this algorithm, the events were combined into sets called groups. The precision of the solution depends on the location of the events into the input sequence. All groupings of the events are generated. The algorithm searched for a solution with the best precision for each sequence of events in each group. This algorithm has a cubic complexity that depends on the number of events. Therefore, searching for ways for reducing the computational complexity (respectively the execution time) of the algorithm is further needed.
II. MATERIAL AND METHOD
A modified event grouping based algorithm (MEGB) for UCTP will be presented. As with the original EGB algorithm, the MEGB algorithm will search for the best solution for each order of events in each group. For large input data sets (for instance thousands of events), the performance of the EGB algorithm will take more execution time (because many solutions should be generated and evaluated) [24].
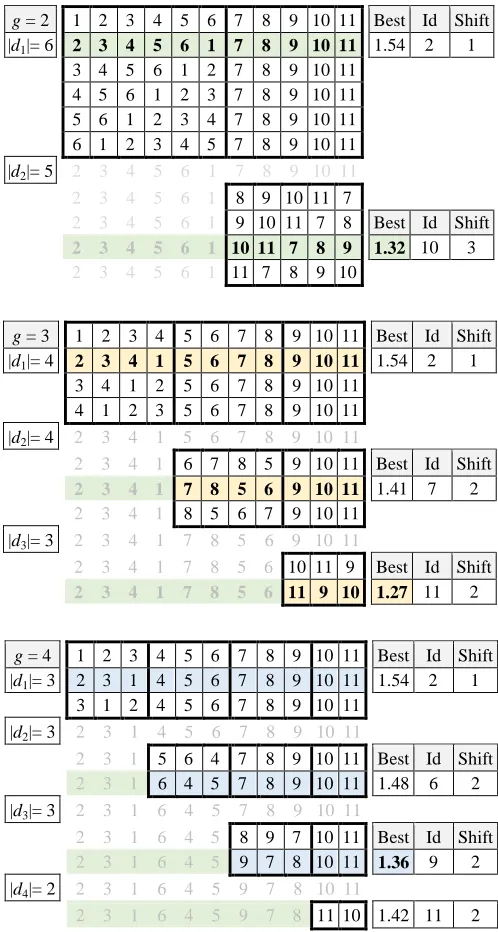
An example for the distribution of 11 events into 2, 3, 4 and 5 groups is presented [24].
TABLEI
DISTRIBUTION OF 11EVENTS INTO GROUPS
g k/g k mod g k/g+1 Groups Cardinality
2 5 1 6 |d1| = 6; |d2| = 5
3 3 2 4 |d1| = 4; |d2| = 4; |d3| = 3
4 2 3 3 |d1|, |d2|, |d3| = 3; |d4| = 2
5 2 1 3 |d1| = 3; |d2|, |d3|, |d4|, |d5| = 2 The main idea of the MEGB algorithm will be presented by an input data set with 11 events, respectively divided into 2, 3 and 4 groups. The grouping of events into 5 groups will not be presented, but the result will be given. The algorithm trace table is shown in Fig. 4.
g = 2 1 2 3 4 5 6 7 8 9 10 11 Best Id Shift |d1|= 6 2 3 4 5 6 1 7 8 9 10 11 1.54 2 1
3 4 5 6 1 2 7 8 9 10 11 4 5 6 1 2 3 7 8 9 10 11 5 6 1 2 3 4 7 8 9 10 11 6 1 2 3 4 5 7 8 9 10 11 |d2|= 5 2 3 4 5 6 1 7 8 9 10 11
2 3 4 5 6 1 8 9 10 11 7
2 3 4 5 6 1 9 10 11 7 8 Best Id Shift
2 3 4 5 6 1 10 11 7 8 9 1.32 10 3
2 3 4 5 6 1 11 7 8 9 10
g = 3 1 2 3 4 5 6 7 8 9 10 11 Best Id Shift |d1|= 4 2 3 4 1 5 6 7 8 9 10 11 1.54 2 1
3 4 1 2 5 6 7 8 9 10 11 4 1 2 3 5 6 7 8 9 10 11 |d2|= 4 2 3 4 1 5 6 7 8 9 10 11
2 3 4 1 6 7 8 5 9 10 11 Best Id Shift 2 3 4 1 7 8 5 6 9 10 11 1.41 7 2 2 3 4 1 8 5 6 7 9 10 11
|d3|= 3 2 3 4 1 7 8 5 6 9 10 11
2 3 4 1 7 8 5 6 10 11 9 Best Id Shift 2 3 4 1 7 8 5 6 11 9 10 1.27 11 2
g = 4 1 2 3 4 5 6 7 8 9 10 11 Best Id Shift |d1|= 3 2 3 1 4 5 6 7 8 9 10 11 1.54 2 1
3 1 2 4 5 6 7 8 9 10 11 |d2|= 3 2 3 1 4 5 6 7 8 9 10 11
2 3 1 5 6 4 7 8 9 10 11 Best Id Shift 2 3 1 6 4 5 7 8 9 10 11 1.48 6 2 |d3|= 3 2 3 1 6 4 5 7 8 9 10 11
2 3 1 6 4 5 8 9 7 10 11 Best Id Shift 2 3 1 6 4 5 9 7 8 10 11 1.36 9 2 |d4|= 2 2 3 1 6 4 5 9 7 8 10 11
2 3 1 6 4 5 9 7 8 11 10 1.42 11 2
Fig. 4 The MEGB algorithm trace table with an input data set containing 11 events, respectively divided into 2, 3 and 4 groups
The range of the possible distributions can be reduced only to the first 33% of all distributions [24]. In addition, the initial order of events is also important. For example, the events may be sorted by duration or weight (in descending order). In this way, the events that have more impact on the evaluation of a timetable will be positioned earlier. Once the initial order of the events has been determined (and the specific distributions are selected), the process of grouping events, positioning them, and evaluating the generated solution (timetable) may start.
The eleven events from the input data set can be grouped into 2, 3, 4 and 5 groups (because 11 div 2 = 5, i.e. 11 events can be up to 5 groups so that in each group so that there are at least two events in each group). Once the best solution is found by rearranging the events in the first group, the algorithm begins searching for a better solution by rearranging the events in the second group. After the cyclical rearrangement of the events in the first group, it can be seen that the best solution found (which has a value of 1.54) is when an event with index 2 (Id = 2) is placed in the first position in the group. This is achieved when all events in the group are moved one position to the left (Shift = 1). Now the algorithm begins searching for a better solution by rearranging the events in the second group. The events already ordered in the first group are no longer considered, their positions in the group (respectively in the timetable) remain unchanged until the end of the algorithm execution (for the current distribution: g = 2).
events are grouped into five groups (i.e., g = 5). Of 121 possible orders, the algorithm checks only 53 of them, but the quality of the generated solutions is getting worse.
It should be noted that the generated solutions from the MEGB algorithm are identical to those generated by the standard EGB algorithm. However, the MEGB algorithm finds the best solutions much faster than the EGB algorithm. For input data sets that contain a small number of events, the number of possible groupings is relatively small. Therefore, the range of distributions can be expanded to groups with less cardinality.
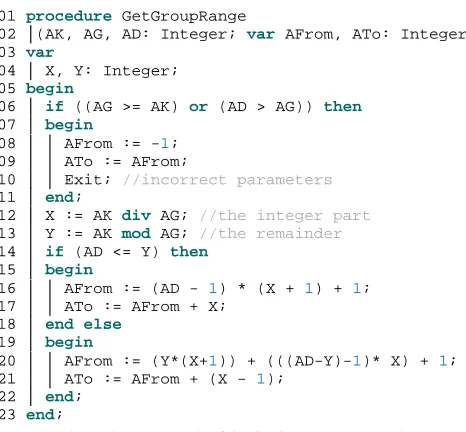
The code of the GetGroupRange procedure is presented in Fig. 5 (in Delphi language).
01 procedure GetGroupRange
02 │(AK, AG, AD: Integer; var AFrom, ATo: Integer); 03 var
04 │ X, Y: Integer; 05 begin
06 │ if ((AG >= AK) or (AD > AG)) then
07 │ begin
08 │ │ AFrom := -1; 09 │ │ ATo := AFrom;
10 │ │ Exit; //incorrect parameters 11 │ end;
12 │ X := AK div AG; //the integer part 13 │ Y := AK mod AG; //the remainder 14 │ if (AD <= Y) then
15 │ begin
16 │ │ AFrom := (AD - 1) * (X + 1) + 1; 17 │ │ ATo := AFrom + X;
18 │ end else
19 │ begin
20 │ │ AFrom := (Y*(X+1)) + (((AD-Y)-1)* X) + 1; 21 │ │ ATo := AFrom + (X - 1);
22 │ end; 23 end;
Fig. 5 The source code of the GetGroupRange procedure The GetGroupRange procedure has constant complexity. This procedure requires 3 input parameters, respectively: AK (the number of the events), AG (the number of the groups), and AD (an index of the group from the current distribution). As a result, the procedure will send back AFrom and ATo positions of the events that form this group (lines 20 and 21) to the output parameters.
The code of the MEGB procedure is presented in Fig. 6 (again in Delphi language).
For the algorithm's execution, it is necessary to declare and initialize some variables and data structures (dynamic arrays) as shown in Fig. 6, lines 3÷12. The variables K (the input parameter of the MEGB procedure), G and D correspond to those of the definition. The variables I, Col and Row (lines 5 and 6) are local variables for managing the computation process. The variables “From” and “&To” will be passed as input-output parameters of the GetGroupRange procedure. The Cost and BestCost variables will store the evaluation of the current solution and the best solution found so far. The ArrR, ArrB, and ArrF dynamic arrays (which are declared on lines 10÷12) will store respectively: the new order of events in the current group (ArrR), the order in which the best solution for the current group is generated (ArrB), and the pre-positioned events on the timetable (ArrF).
Initially (lines 14÷16), the MEGB procedure allocates the necessary memory for the three dynamic arrays - ArrR, ArrB
and ArrF. This is done by calling the standard SetLength procedure. The second parameter of this procedure specifies the size of the corresponding dynamic array. In this case, this is the value of the variable K (corresponding to the number of events).
01 procedure MEGB(K, Min, Max: Integer); 02 var
03 │ G: Integer; //as defined 04 │ D: Integer; //as defined 05 │ I: Integer;
06 │ Col, Row: Integer; 07 │ From, &To: Integer; 08 │ Index: Integer;
09 │ Cost, BestCost: Single;
10 │ ArrR: array of Integer; //new distributions 11 │ ArrB: array of Integer; //best distributions 12 │ ArrF: array of Boolean; //the fixed events 13 begin
14 │ SetLength(ArrR, K); 15 │ SetLength(ArrB, K); 16 │ SetLength(ArrF, K);
17 │ for G := Min to Max do //from minG to maxG 18 │ begin
19 │ │ for Col := 1 to K do //for each event 20 │ │ begin
21 │ │ │ ArrR[Col] := Col; 22 │ │ │ ArrB[Col] := Col; 23 │ │ │ ArrF[Col] := False; 24 │ │ end;
25 │ │ BestCost := MaxInt;
26 │ │ for D := 1 to G do //for each D in G 27 │ │ begin
28 │ │ │ GetGroupRange(K, G, D, From, &To);
29 │ │ │ for Row := From to &To do //for each event 30 │ │ │ begin
31 │ │ │ │ Index := Row - 1;
32 │ │ │ │ //every first row is omitted
33 │ │ │ │ if (From>1)and(From=Row) then Continue; 34 │ │ │ │ for Col := From to &To do
35 │ │ │ │ begin
36 │ │ │ │ │ if (Col <= &To) then
37 │ │ │ │ │ begin
38 │ │ │ │ │ │ Index := Index + 1;
39 │ │ │ │ │ │ if (Index > &To) then Index := From; 40 │ │ │ │ │ │ ArrR[Col] := Index;
41 │ │ │ │ │ end else
42 │ │ │ │ │ begin
43 │ │ │ │ │ │ ArrR[Col] := Col; 44 │ │ │ │ │ end;
45 │ │ │ │ end;
46 │ │ │ │ for I:=From to &To do ArrF[I] := False; 47 │ │ │ │ if (From > 1) then
48 │ │ │ │ │ for I := 1 to (From - 1) do
49 │ │ │ │ │ │ ArrR[I] := ArrB[I]; 50 │ │ │ │ Cost := LocalSearch(ArrR); 51 │ │ │ │ if (Cost < BestCost) then
52 │ │ │ │ begin
53 │ │ │ │ │ BestCost := Cost; 54 │ │ │ │ │ for Col := From to &To do
55 │ │ │ │ │ │ ArrB[Col] := ArrR[Col]; 56 │ │ │ │ end;
57 │ │ │ │ for I := From to &To do ArrF[I] := True; 58 │ │ │ end; //for Row := From to &To do
59 │ │ end; //for D := 1 to G do
60 │ end; //for G := Min to Max do
61 end;
Fig. 6 The source code of the MEGB procedure
group of the current distribution. For each group of this distribution, the GetGroupRange procedure is called (line 28). As mentioned, this procedure calculates the range of events to be analyzed. After the events move one position to the left, the LocalSearch method searches for a new solution (line 50). If an acceptable solution with this order of events cannot be generated, the LocalSearch method will return the MaxInt value. Then, the process will continue with a new rearrangement of events in the current group. If the last generated solution is the best found so far, it is stored (lines 51÷56). These steps are repeated until all events in the current group are positioned in the first position.
III.RESULTS AND DISCUSSION
Two experiments will be made in this study. First, the performance between the MEGB and the EGB algorithms in terms of the execution time will be checked. Second, a comparative analysis between three algorithms for UCTP, respectively: the GALS [22], the CCLS [23], and the MEGB (i.e. the modified EGB [24]) will be made. An analysis of the quality of the found solutions and the time to find them will be made as well.
A. The Methodology of the Experiments
In the current study, nine input data sets, respectively with 18, 42, 66, 90, 104, 130, 171, 211 and 242 events were used. These data sets are shown in Table II.
TABLEII
INPUT DATA SETS INFORMATION
DS Events Students Groups Lecturers Rooms
DS 1 18 52 4 10 10
DS 2 42 100 8 18 12
DS 3 66 142 11 25 16
DS 4 90 175 14 29 18
DS 5 104 225 18 30 21
DS 6 130 274 21 37 22
DS 7 171 369 29 46 30
DS 8 211 445 35 53 34
DS 9 242 499 39 60 37
Each event is characterized by the resources involved - students, lecturers, and rooms. When two events use one common resource (or more than one), there is a conflict between them. These dependencies are shown in Table III.
TABLEIII
THE NUMBER OF CONFLICTS BETWEEN THE EVENTS DS S L A S+L S+A L+A S+L+A
DS 1 102 10 10 107 106 12 107
DS 2 289 50 77 325 342 91 352
DS 3 468 91 176 540 606 194 622 DS 4 635 159 301 770 892 324 910 DS 5 730 224 384 928 1062 418 1089 DS 6 857 278 557 1100 1344 618 1398 DS 7 1185 385 664 1528 1772 743 1840 DS 8 1485 553 849 1960 2224 936 2292 DS 9 1709 628 1024 2255 2611 1125 2697
The conflicts between the different events can be triggered by a shared lecturer and a shared student and a shared room, or all of them together.
B. Experimental Conditions
The experimental conditions are 64–bit OS Windows 10 and hardware configuration: Processor: Intel (R) Core (TM) i7–7700HQ at 2.80 – 3.80 GHz; RAM: 8GB DDR4.
C. Experimental results
In Table IV, the results of the EGB and MEGB algorithms execution for input data set DS1 (with 18 events; 52 students; 10 lecturers and 10 rooms) are shown. The events are ordered by weight and duration. The results of all possible groupings are presented.
TABLEIV
RESULTS FOR DS1(E=18;S=52;L=10;R=10)
m Groups Sort by Weight
Sort by Duration
EGB time
MEGB time
1 1x18 0.722 0.806 375 47
2 2x9 0.694 0.750 297 78
3 3x6 0.611 0.639 313 94
4 2x5; 2x4 0.639 0.611 313 141 5 3x4; 2x3 0.694 0.694 312 172
6 6x3 0.722 0.722 297 203
7 4x3; 3x2 0.722 0.722 313 234 8 2x3; 6x2 0.722 0.750 312 266
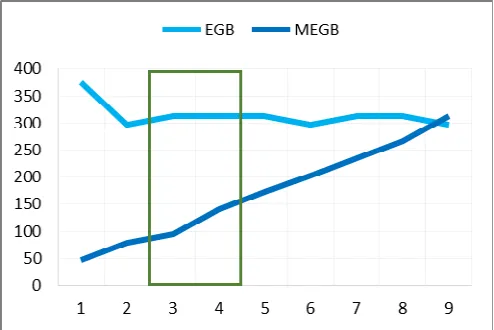
9 9x2 0.750 0.750 297 313
The diagram of Fig. 6 shows the execution times of the algorithms (in milliseconds) for input data set DS1. When increasing the distributions, the execution time of the MEGB algorithm becomes commensurate with that of the EGB algorithm. However, the best results are found in the first 40% of the distributions. In this range, the execution time of the MEGB algorithm is less than that of the EGB algorithm (3 times when the events are sorted by weight and 2 times when the events are sorted by duration – Table IV).
Fig. 7 Influence of the group number (the x-axis) on the execution time (the y-axis (in milliseconds)) for EGB and MEGB algorithms
100 students; 18 lecturers and 12 rooms) are shown. The events are ordered by weight and duration. Again, the events are sorted in order by weight and duration. The results for the first 40% of all possible groupings are presented. For 42 events, the possible groupings are: 42/2 = 21; 40% * 21 ≈ 8.
TABLEV
RESULTS FOR DS2(E=42;S=100;L=18;R=12)
m Distribution by groups
Sort by weight
Sort by duration
EGB time
MEGB time
1 1x42 1.452 1.417 2313 78
2 2x21 1.298 1.250 2187 172 3 3x14 1.262 1.286 2016 250 4 2x11; 2x10 1.250 1.298 1875 329 5 2x9; 3x8 1.452 1.310 2063 406
6 6x7 1.536 1.357 2032 562
7 7x6 1.560 1.369 1797 578
8 2x6; 6x5 1.571 1.405 1719 718 The results in Table V show that the best solution has a value of 1.250. When the events are sorted by weight, this result is obtained by grouping the events into 4 groups, and when the events are sorted by duration, this result is obtained by grouping the events into 2 groups. In terms of the execution time, it is better for the MEGB algorithm than for the EGB algorithm. For example, when the events are sorted by weight, the execution time of the MEGB algorithm is 5.69 times less than that of the EGB algorithm, and when the events are sorted by duration, this time is 12.7 times less. Therefore, in the next experiments, only the results of the MEGB algorithm will be presented.
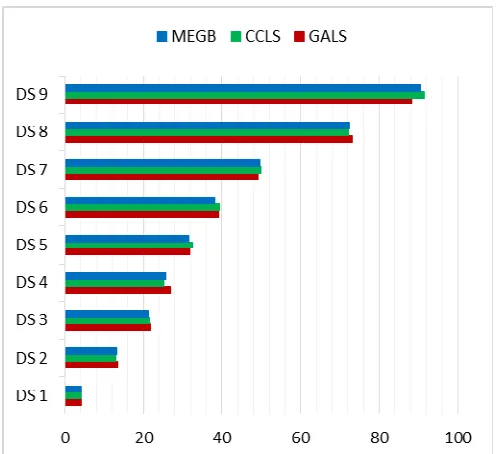
A comparative analysis in terms of the performance and quality of the generated solutions from the GALS, CCLS and MEGB algorithms will be made. The best results of the three algorithms are shown in Table VI.
TABLEVI
THE BEST RESULTS OF THE GALS,CCLS AND MEGBALGORITHMS
DS GALS Time CCLS Time MEGB Time
DS 1 4.28 872 4.25 279 4.22 312
DS 2 13.58 2869 12.87 840 13.21 683 DS 3 21.83 8865 21.64 2444 21.41 1449
DS 4 26.85 25619 25.29 6867 25.74 3013 DS 5 31.92 67635 32.43 18678 31.63 6207
DS 6 39.18 165030 39.42 49311 38.26 12662
DS 7 49.16 374618 49.92 118839 49.64 25450 DS 8 73.21 775459 72.11 272142 72.38 50391 DS 9 88.26 1465617 91.54 568777 90.62 95744 From the results in Table VI, it can be seen that the three algorithms generated commensurate solutions (in terms of quality). For smaller input data sets (those with a small number of events, for instance up to 100), the better solutions are generated by the CCLS and MEGB algorithms. However, for large input data sets, the GALS algorithm generates better solutions (Fig. 8).
The influence of the size of the input data on the quality of the generated solutions is presented in Fig. 8.
Fig. 8 Influence of the size of the input data (the y-axis) on the quality of the generated solutions (the x-axis) for GALS, CCLS and MEGB algorithms
In terms of the execution time, it can be seen that it is acceptable except for the GALS algorithm. The Influence of the size of the input data on the execution time for GALS, CCLS, and MEGB algorithms is presented in Fig. 9.
Fig. 9 Influence of the size of the input data (the x-axis) on the execution time (the y-axis (in seconds)) for GALS, CCLS, and MEGB algorithms
If the parameters of the GALS algorithm – the population size and the number of reproductions are set more precisely, the algorithm execution time can be reduced. However, it will still be longer than the other two algorithms.
IV.CONCLUSION
execution time of the EGB algorithm; the best results are obtained with the first 30% of the groups formed. In these groupings, the execution time of the MEGB algorithm is much less than the execution time of the EGB algorithm. The process is optimized by creating a partial timetable and the ordinance of the events in groups before the current event does not change. In addition, a comparative analysis between the MEGB algorithm and two other algorithms for UCTP, respectively GALS and CCLS, is made as well. The obtained results show that the MEGB algorithm and the CCLS algorithm generate better solutions for smaller input data sets, while the GALS algorithm generates better solutions for larger input data sets. However, in terms of execution time, it has been found that the GALS algorithm is running slowest.
The complexity of the MEGB algorithm is cubic, i.e.
Θ(k3), where k is the number of events in the timetable. This is because for each distribution g and each group d (total g*d) all events k are analyzed. For each event, the LocalSearch method is called. This method has quadratic complexity. Therefore, the algorithm has a cubic complexity, depending on the number of events k.
ACKNOWLEDGMENTS
We would like to express our sincere gratitude to Assoc. Prof. Dafina Kostadinova, Ph.D. from the South-West University in Bulgaria, for her suggestions regarding this paper.
REFERENCES
[1] H. Babaei, J. Karimpour, and A. Hadidi, "A survey of approaches for university course timetabling problem," Computers and Industrial Engineering, vol. 86, pp. 43-59, 2015.
[2] S. Even, A. Itai, and A. Shamir, "On the complexity of timetable and multicommodity flow problems," SLAM Journal of computing, vol. 5(4), pp. 691-703, 1976.
[3] K. Y. Junn, J. H. Obit, and R. Alfred, "The Study of Genetic Algorithm Approach to Solving University Course Timetabling Problem," Lecture Notes in Electrical Engineering, vol. 488, pp. 454-463, 2018.
[4] A. R. Komijan, and M. N. Koupaei, "A mathematical model for university course scheduling: a case study," International Journal of Technical Research and Applications, vol. 19, pp. 20-25, 2015. [5] R. Chen, and H. Shih, "Solving university course timetabling
problems using constriction particle swarm optimization with local search," Algorithms, vol. 6, pp. 227-244, 2013.
[6] M. S. Kohshori, and M. S. Abadeh, "Hybrid genetic algorithms for university course timetabling," International Journal of Computer Science Issues, vol. 9(2), pp. 446-455, 2012.
[7] V. Kralev, "A model for the university course timetabling problem," International Journal "Information technologies & knowledge," vol. 3(3), pp. 276-289, 2009.
[8] M. Traykov, S. Angelov, and N. Yanev, "A New Heuristic Algorithm for Protein Folding in the HP Model," Journal of Computational Biology, vol. 23(8), pp. 662-668, Aug. 2016.
[9] F. I. Sapundzhi and M. S. Popstoilov, "Optimization algorithms for finding the shortest paths," Bulgarian Chemical Communications, vol. 50, special issue B, pp. 115-120, 2018.
[10] K. Y. Junn, J. H. Obit, and R. Alfred, "A constraint programming approach to solving university course timetabling problem (UCTP)," Advanced Science Letters, vol. 23(11), pp. 11023-11026, 2017. [11] H. S. Theng, A. B. Bin Md Sultan, and N. Mohd Ali,
"Multiple-hybrid case-based reasoning approach for university course timetabling problem," Journal of Theoretical and Applied Information Technology, vol. 72(2), pp. 164-178, 2015.
[12] T. Song, S. Liu, X. Tang, X. Peng, and M. Chen, "An iterated local search algorithm for the University Course Timetabling Problem," Applied Soft Computing Journal, vol. 68, pp. 597-608, 2018. [13] J. A. Soria-Alcaraz, E. Özcan, J. Swan, G. Kendall, and M. Carpio,
"Iterated local search using an add and delete hyper-heuristic for university course timetabling," Applied Soft Computing Journal, vol. 40, pp. 581-593, 2016.
[14] J. H. Obit, K. Y. Junn, and R. Alfred, "Performance comparison of linear and non-linear great deluge algorithms in solving university course timetabling problems," Advanced Science Letters, vol. 23(11), pp. 11027-11030, 2017.
[15] V. Kralev, and R. Kraleva, "Variable neighborhood search based algorithm for university course timetabling problem," Proceedings of the Fifth international scientific conference, FMNS-2013, pp. 202-214, 2013.
[16] K. Patrick, and Z. Godswill, "Greedy ants colony optimization strategy for solving the curriculum based university course timetabling problem," British Journal of Mathematics & Computer Science, vol. 14(2), pp. 1-10, 2016.
[17] M. Mazlan, M. Makhtar, A. F. K. A. Khairi, M. A. Mohamed, and M. N. A. Rahman, "Ant colony optimization for solving university course timetabling problems," International Journal of Engineering and Technology (UAE), vol. 7(2), pp. 139-141, 2018.
[18] K. Y. Junn, J. H. Obit, and R. Alfred, "Comparison of simulated annealing and great deluge algorithms for university course timetabling problems (UCTP)," Advanced Science Letters, vol. 23(11), pp. 11413-11417, 2017.
[19] S. Zheng, L. Wang, Y. Liu, and R. Zhang, "A simulated annealing algorithm for university course timetabling considering traveling distances," International Journal of Computing Science and Mathematics, vol. 6(2), pp. 139-151, 2015.
[20] M. X. Zhang, B. Zhang, and N. Qian, "University course timetabling using a new ecogeography-based optimization algorithm," Natural Computing, vol. 16(1), pp. 61-74, 2017.
[21] S. E. Soliman and A. E. Keshk, "Memetic algorithm for solving university course timetabling problem," International Journal of Mechanical Engineering and Information Technology, vol. 3(8), pp. 1476-86, 2015.
[22] V. Kralev, "A genetic and memetic algorithm for solving the university course timetabling problem," International Journal "Information theories & applications," vol. 16(3), pp. 291-299, 2009. [23] V. Kralev, and R. Kraleva, "A local search algorithm based on
chromatic classes for university course timetabling problem," International Journal of Advanced Computer Research, vol. 7(28), pp. 1-7, 2017.
[24] V. Kralev, R. Kraleva, and B. Yurukov, "An event grouping based algorithm for university course timetabling problem," International Journal of Computer Science and Information Security, vol. 14(6), pp. 222-229, 2016.
[25] R. P. Badoni, D. K. Gupta, and P. Mishra, "A new hybrid algorithm for university course timetabling problem using events based on groupings of students," Computers & industrial engineering, vol.78, pp. 12–25, 2014.