ISSN 0975-928X
Research Article
Genetic variability studies for yield and its component traits in RIL
population of blackgram (
Vigna mungo
(L.) Hepper)
Sowmini.K and Jayamani. P*
Department of Pulses, Centre for Plant Breeding and Genetics. Tamil Nadu Agricultural University, Coimbatore – 641 003. *Email: [email protected]
(Received: 27 Oct 2012; Accepted:06 Feb 2013)
Abstract
Blackgram or Urdbean, being a fourth important pulse crop in India has low genetic variability, low harvest index and no significant improvement in its productivity till date. An inter sub specific mapping population was developed by crossing VBN(Bg) 5 x Vigna mungo var. silvestris 22/10 by single seed decent method. The genetic variability parameters were studied in a RIL (Recombinant Inbred Line) population consisting of 193 lines and their parents. The higher estimates of PCV were observed for all the traits when compared with GCV. However, GCV was found to be high for the traits single plant yield, number of clusters per plant and number of pods per plant. High heritability per cent was observed for days to maturity, number of seeds per pod and hundred seed weight. High genetic advance as per cent of mean was observed for plant height, number of clusters per plant, number of pods per plant, single plant yield and hundred seed weight. High heritability coupled with high genetic advance as per cent of mean was observed for hundred seed weight. Transgressive segregants were observed for all the traits. These could be used further for yield testing apart from utilizing it as pre breeding material. The mapping population could be used for mapping of genes for important traits.
Keywords
Blackgram, Genetic variability, Transgressive recombinants. Introduction
Pulse crops, in general give low yield due to the fact that pulses have been mostly grown in poor soils under rainfed condition, lack of genetic diversity, indeterminate growth habit, photoperiod sensitivity, pod shattering and susceptibility to pest and diseases (Fernandez and Shanmugasundaram, 1988). Among pulses, blackgram (Vigna mungo L. Hepper) occupies a prominent place in India, covering an area of about 3.26 million hectares with a production of 1.76 million tonnes (AICRP report, 2011). Being the largest producer of blackgram does not take India to a comfortable situation, as it is also the largest consumer of blackgram in the world and its total production is not able to fulfill its domestic consumption demand of 1.6 million tonnes. Therefore, it is necessary to undertake an in-depth analysis of the genetic architecture of the plant that gives an idea on current status of variability parameters that contributes towards yield and its attributing traits. Hence, the present study was undertaken to study the variability parameters in a inter sub specific mapping population.
Material and methods
The experimental material consisted of a Recombinant Inbred Lines (RIL) derived from a cross viz., VBN(Bg) 5 (P1) x Vigna mungo var.
silvestris 22/10 (P2), a wild progenitor of blackgram. The RIL population which consisted of 193 individuals was developed through single seed descent method. The experiment was laid out in homogeneous block following randomized block design replicated twice with 193 RILs and parents during kharif, 2011 at the Department of Pulses, Tamil Nadu Agricultural University, Coimbatore.
Observations on 10 biometrical traits (Table 1) were recorded. Statistical methods suggested by Burton (1952) for variability, Lush (1940) for heritability, Johnson et al. (1955) for genetic advance as percent of mean were adopted to find out the respective estimates. Further categorization of estimates was made based on the suggestions of Sivasubramanian and Madhavamenon (1973) for variability, Johnson et al. (1955) for heritability and genetic advance as percent of mean. Subsequently, transgressive recombinants were identified.
Results and discussion
Analysis of variance (ANOVA) for the parents and the 193 lines of RIL population had highly significant differences for all the ten traits (Table 1). The existence of wide variability was observed with respect to different traits in the RIL population. The general mean value for each trait and its range among the RIL population are given in Table 2.
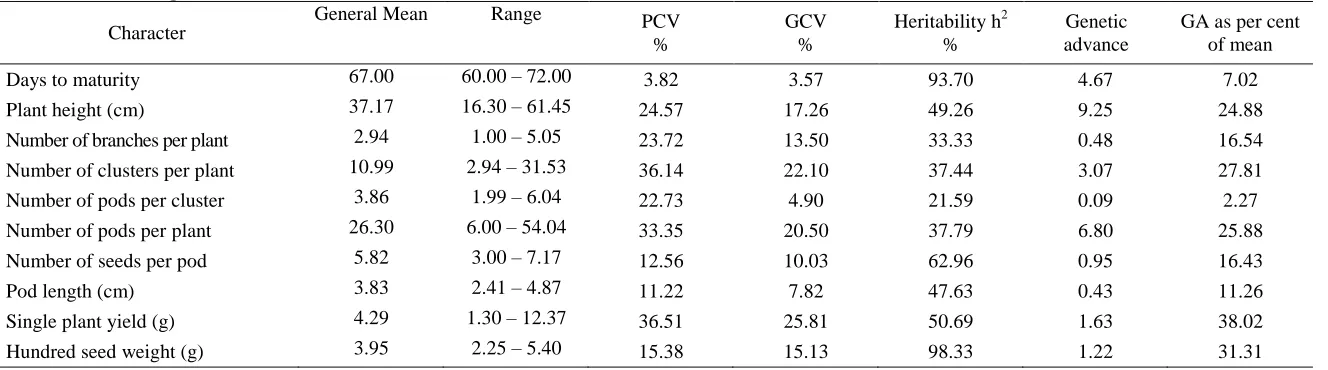
Genetic variability: In general, the estimates of phenotypic coefficient of variation (PCV) were higher than the estimates of genotypic coefficient of variation (GCV) for all the traits under study indicating the environmental influence over the traits. Similar results were observed by Konda et al. (2009) and Reddy et al. (2011) in blackgram.
ISSN 0975-928X
High and moderate estimates of PCV and GCV were observed for plant height (24.57, 17.26) and number of branches per plant (23.72, 13.50, respectively). Moderate PCV and GCV along with narrow difference among them were observed for hundred seed weight (15.38, 15.13) and number of seeds per pod (12.56, 10.03, respectively). Selection will be effective based on the heritable nature of these traits. Low estimates of PCV (3.82) and GCV (3.57) were observed for days to maturity which is highly influenced by the environment and selection would be ineffective (Table 2).
High heritability (98.33) coupled with high genetic advance as percentage of mean (31.33) was found for hundred seed weight in which selection may be effective due to the additive gene effects. It is in accordance with the findings of Malik et al. (2008) and Bhareti et al. (2011) for hundred seed weight, pods per plant and pod length. Moderate heritability coupled with high genetic advance as percentage of mean was recorded for plant height (49.26, 24.88, respectively), number of clusters per plant (37.44, 27.81, respectively), number of pods per plant (37.79, 25.88, respectively) and single plant yield (50.69, 38.02, respectively) which revealed the additive gene effects coupled with high environmental impact. Moderate heritability with moderate genetic advance as percentage of mean was recorded for pod length (47.63, 11.26, respectively) and number of branches per plant (33.33, 16.54, respectively) indicate that these characters are influenced by environment and hence selection would be ineffective. Low heritability (21.59) and low genetic advance as percentage of mean (2.27) were observed for number of pods per cluster in which the selection would be ineffective (Table 2).
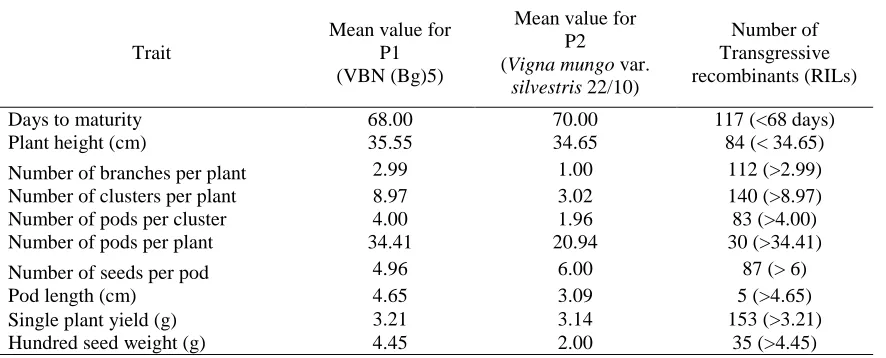
Transgressive segregants: The prime objective of any crop improvement programme is to improve the yield potential of the respective crop. From the inter sub specific cross of present investigation, 153 RILs were isolated for single plant yield which outperformed the parents (>3.21 g) (Figure 1). A total of 35 RILs were identified as bold seeded with hundred seed weight exceeding the parental
per se performance (>4.45 g) (Table 3). Thus, these RILs could be further tested for yield and exploited.
Early maturing lines with short stature are the preferable traits for intercropping situation. A total of 117 lines were found to be earlier (<68 days) and 84 lines with shorter plant height (<34.65 cm)
with more number of branches (>2.99) and more number of clusters (>8.97), respectively could be selected for the improvement of blackgram (Table 3).
Number of pods per plant is the primary yield contributing trait in blackgram and 30 RILs recorded more number of pods per plant (>34.41). These RILs could be yield tested and further exploited for commercial cultivation. Number of pods per cluster contributes indirectly for yield improvement, 83 RILs with more number of pods per cluster (>4.00) could be used as donors in crossing programme. Lengthy pods having more number of seeds will increase the yield correspondingly. Thus, the 87 RILs with more number of seeds per pod (>6) and 5 RILs with increased pod length (>4.65 cm) could be selected as pre breeding material for the improvement of blackgram (Table 3).
Based on the present study, the RILs with better mean values for yield attributing traits will be helpful to develop high yielding varieties. The RILs isolated with specific traits could be used as pre breeding material for further improvement of blackgram. Further the mapping population could be used for mapping of genes /QTLs for yield related traits.
References
AICRP Report. 2011. Indian Institute of Pulses Research, Kanpur. 29 pp.
Bhareti, P., Singh, D.P. and Khulbe, R.K. 2011. Genetic variability and association analysis of advanced lines and cultivars following intervarietal and interspecific crosses in blackgram. Crop Improv., 38 (1): 67-70. Burton, G.W. 1952. Quantitative inheritance in grasses.
Proc. 6th Int. Grassland Cong., 1: 24-84. Fernadez, G.C.J. and Shanmugasundaram, S. 1988. The
AVRD mungbean improvement program: past, present and future. In: Proceedings of the second international mungbean symposium, Asian Vegetables Research Centre, Shanhua, Taiwan. Pp 58-70.
Johnson, H.W., Robinson, H.F. and Comstock, R.E. 1955. Estimation of genetic variability and environmental variability in soybean. Agron. J.,47: 314-318.
Kapur, S.K. 1981. Elements of practical statistics, Oxford and IBH publishing co, New delhi Pp 148-154.
Konda, C. R., Salimath, P. M. and Mishra, M. N. 2009. Genetic diversity in blackgram (Vigna mungo
(L.) Hepper). Legume Res., 30 (3):212-214. Lush, J.L. 1940. Intra sire correlation and regression of
ISSN 0975-928X
inter-relationship analysis in blackgram (Vigna mungo (L.) Hepper), Legume Res., 34 (2): 149-152.
ISSN 0975-928X
ISSN 0975-928X
Table 1. Analysis of variance for yield and yield component traits in blackgram
Source of
variation df
MSS
Days to maturity
Plant height(cm)
Number of branches per plant
Number of clusters per
plant
Number of pods per cluster
Number of pods per
plant
Number of seeds per
pod
Pod length
(cm)
Single plant yield (g)
Hundred seed weight
(g)
Replication 1 0.0923 19.0904 0.0009 0.1242 0.0073 1.5454 0.0001 0.0062 0.0009 0.0021
Treatment 194 12.28** 125.16** 0.65** 21.92** 0.82** 106.15** 0.88** 0.28** 1.29** 0.72**
Error 194 0.700 42.540 0.330 9.980 0.750 47.930 0.200 0.100 1.210 0.003
** Significant at 1% level
Table 2. Coefficient of variation, heritability (broad sense), genetic advance and genetic advance as per cent of mean of yield and yield component traits in blackgram
Character
General Mean Range PCV
%
GCV %
Heritability h2 %
Genetic advance
GA as per cent of mean
Days to maturity 67.00 60.00 – 72.00 3.82 3.57 93.70 4.67 7.02
Plant height (cm) 37.17 16.30 – 61.45 24.57 17.26 49.26 9.25 24.88
Number of branches per plant 2.94 1.00 – 5.05 23.72 13.50 33.33 0.48 16.54
Number of clusters per plant 10.99 2.94 – 31.53 36.14 22.10 37.44 3.07 27.81
Number of pods per cluster 3.86 1.99 – 6.04 22.73 4.90 21.59 0.09 2.27
Number of pods per plant 26.30 6.00 – 54.04 33.35 20.50 37.79 6.80 25.88
Number of seeds per pod 5.82 3.00 – 7.17 12.56 10.03 62.96 0.95 16.43
Pod length (cm) 3.83 2.41 – 4.87 11.22 7.82 47.63 0.43 11.26
Single plant yield (g) 4.29 1.30 – 12.37 36.51 25.81 50.69 1.63 38.02
ISSN 0975-928X
Table 3. Transgressive recombinants (RILs) for various biometrical traits.
Trait
Mean value for P1 (VBN (Bg)5)
Mean value for P2 (Vigna mungo var.
silvestris 22/10)
Number of Transgressive recombinants (RILs)
Days to maturity 68.00 70.00 117 (<68 days)
Plant height (cm) 35.55 34.65 84 (< 34.65)
Number of branches per plant 2.99 1.00 112 (>2.99)
Number of clusters per plant 8.97 3.02 140 (>8.97)
Number of pods per cluster 4.00 1.96 83 (>4.00)
Number of pods per plant 34.41 20.94 30 (>34.41)
Number of seeds per pod 4.96 6.00 87 (> 6)
Pod length (cm) 4.65 3.09 5 (>4.65)
Single plant yield (g) 3.21 3.14 153 (>3.21)