ISSN 0975-928X
Research Note
Sugarcane for Diversified Uses
M. Shanthi Priya1, K.H.P.Reddy1, M. Hemanth Kumar2, V. Rajarajeswari1, G. Mohan Naidu1, B. Rupesh Kumar Reddy1
1
S.V.Agricultural College, Tirupati, Andhra Pradesh
2
Regional Agricultural Research Station, Tirupati, Andhra Pradesh Email: [email protected]
(Received:25 Mar 2015; Accepted:21 May 2016) Abstract
Seventy three genotypes selected from the first clonal stage were evaluated for diversified uses viz., biomass per cane, fibre yield, theoretical yield of alcohol, commercial cane sugar (CCS) yield and cane yield in second clonal stage during 2011-12. Based on the mean performance of the genotypes viz., 2010T-152 and 2010T-53 showing high performance for biomass, fibre yield, CCS yield, theoretical yield of alcohol and cane yield; the genotypes viz., 2010T-146 and 2010T-84 showing higher performance for biomass, fibre yield, CCS yield and cane yield; the genotypes viz., 2010T-4, 2010T-103, 2010T-72 showing higher performance for fibre yield, CCS yield, theoretical yield of alcohol and cane yield; the genotypes viz., 2010T-115, 2010T-387 and 2010T-285 showing higher performance for fibre yield, CCS yield and cane yield could be suggested for promotion as varieties for respective diversified uses. The genotypes 2010T-16, 2010T-18, 2010T-82, 2010T-88, 2010T-103, 2010T-124, 2010T-153, 2010T-229, 2010T-239, 2010T-344, 2010T-347 and 2010T-416 selected by the index method could serve as potential genetic stocks in sugarcane breeding for diversified uses.
Keywords
Diversified uses, fibre, alcohol
Sugarcane is an important cash crop and raw material for sugar industry which is the second largest agro based industry of India. It assumes an important position in the economy of the country. Sugarcane serves as the major source for a variety of products such as sugar, jaggery, molasses, bagasse and filter cake out of which sugar and jaggery are meant for daily use as consumable products while other byproducts have industrial significance. It is realized that sugar production alone will not be able to make the industry profitable and under such circumstances diversification is necessary for successful growth of the industry. Sugarcane, which is also considered as an important bio energy crop belongs to the category of C4 plants which converts the solar energy effectively into high quality and low cost raw materials for sugar and ethanol (Bruce et al. 2005). Molasses and bagasse are the byproducts of sugar industry which form the feedstock for ethanol production and cogeneration respectively. National policy on biofuels proposed to scale up the blending from 5% to 20% by 2017. The target is difficult to achieve due to limited availability of bioethanol that to a greater extent comes from sugarcane molasses apart from a smaller proportion from grains. This necessiates significant increase in domestic ethanol production by developing varieties which yield higher ethanol. More than 500 sugar industries in the country have a potential to generate electricity of 5000 MW. However, the current installed capacity is only 2200 MW which is due to under utilization of
full capacity of the industry to generate required quantity of bagasse and lack of energy canes with high fiber. Sugar factories with co-generation facility demand for high fibre varieties up to 16% as it helps in increasing the baggase availability (Natarajan, 2000).
Generally the main objective of sugarcane breeding is to develop varieties capable of producing high cane yield and CCS yield per unit area. The recent awareness on the advantages of using green fuel for generation of power and use of gasohol to reduce automobile emission have resulted in setting up of a number of cogeneration plants in various sugar mills. To achieve these goals of increased sugar, alcohol and cogeneration, sugar industries needs a special varieties to meet their specific requirement of raw materials. Sugarcane breeders traditionally breed varieties for high sucrose and high stalk yield. As sugar production scenario is changing, varietal needs have started changing. Hence, breeding programmes must integrate new traits such as high fiber, high biomass and high total sugars in addition to yield and juice quality.
ISSN 0975-928X
design with two replications during April, 2011. Each entry was planted in 2 rows of 5 m length spaced at a distance of 80 cm between rows with 4 three budded setts per meter as seed rate.
Observations were recorded on each entry for the traits viz., no. of tillers at 120 DAP, shoot population at 180, 240 DAP, NMC at harvest, no. of green leaves at 90, 120, 240 DAP and at maturity, biomass per cane (kg), internode number, internode length (cm), stalk length (cm), stalk diameter (cm), stalk volume (cm3), single cane weight (kg), fibre content (%), Brix (%), sucrose (%), CCS (%), juice purity (%), pol % cane, juice extraction (%), total sugars (%), fibre yield (tha-1), CCS yield (tha-1), theoretical yield of alcohol (g/100ml) and cane yield (tha-1).
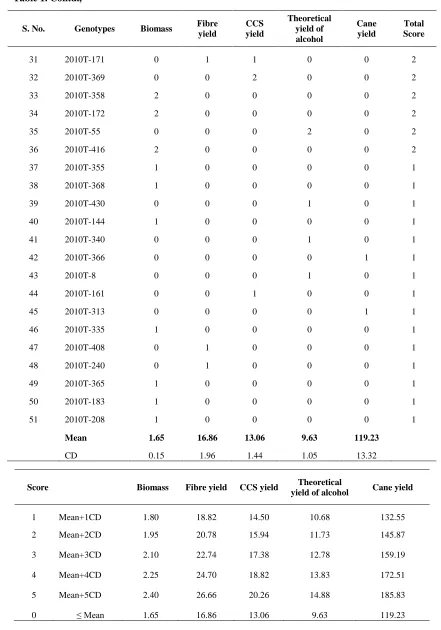
The genotypes were scored based on mean performance for diversified uses viz., biomass, fibre yield, theoretical yield of alcohol, cane yield and commercial cane sugar yield in second clonal stage. The technique of Discriminant function developed by Fisher (1936) was adopted for construction of selection indices which when applied to select plants can bring about effective improvement in a character compared to straight selection.
To achieve the goals of increased sugar, alcohol and cogeneration, sugar industries need special varieties to meet their specific requirement of raw materials. Furthermore a prosperous blend of all these characters would be a reward to all the sugarcane stakeholders. Hence, a comprehensive evaluation of seventy three genotypes for diversified uses was carried out. A total of fifty one genotypes which showed higher per se performance than the general mean for at least one of the diversified uses viz., cane yield, fibre yield, biomass per cane, theoretical yield of alcohol and commercial cane sugar yield were considered and scored relatively based on the per se
performance and the results are presented in the Table 1 and Table 2.
The genotypes viz., 2010T-124, 2010T-344 and 2010T-84 performed significantly superior to general mean for biomass per cane. The genotypes viz., 2010T-146, 2010T-285 and 2010T-115 showed superior performance over general mean for fibre yield. The genotypes viz., 2010T-4, 2010T-53 and 2010T-146 recorded significantly superior performance over general mean for CCS yield. The genotypes viz., 2010T-72, 2010T-16 and 2010T-88 showed significantly higher performance than general mean for theoretical yield of alcohol. For cane yield, the genotypes viz., 2010T-146, 2010T-115 and
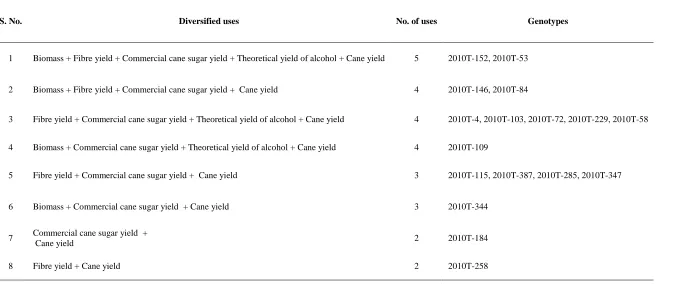
The genotypes 2010T-152 and 2010T-53 showed higher per se performance for all the five diversified uses viz., cane yield, fibre yield, biomass per cane, theoretical yield of alcohol or commercial cane sugar yield.The two genotypes 2010T-146 and 2010T-84 showed higher per se performance for the four characters viz., biomass per cane, fibre yield, commercial cane sugar yield and cane yield. Further, the genotype 2010T-146 showed highest performance for cane yield and fibre yield among all the genotypes evaluated.
The genotypes 2010T-4, 2010T-103, 2010T-72, 2010T-229 and 2010T-58 were identified as the best for four uses viz., fibre yield, commercial cane sugar yield, theoretical yield of alcohol and cane yield. The genotype 2010T-109 showed higher per se
performance for biomass per cane, commercial cane sugar yield, theoretical yield of alcohol and cane yield.
The genotypes 2010T-115, 2010T-387, 2010T-285 and 2010T-347 recorded higher per se performance for fibre yield, commercial cane sugar yield and cane yield. The genotype 2010T-344 showed higher per se
performance with respect to biomass per cane, commercial cane sugar yield and cane yield, while the genotype 2010T-184 recorded higher mean values for commercial cane sugar yield and cane yield. The genotype 2010T-258 was good for fibre yield and cane yield.
The genotypes 2010T-16, 2010T-88 and 2010T-18 were found to be best for ethanol but the cane yield was low, while 2010T-124 recorded the highest biomass per cane but it showed poor performance for other characters. These genotypes may be used in the crossing programmes to produce genotypes with high cane yield and other desirable characters as well.
ISSN 0975-928X
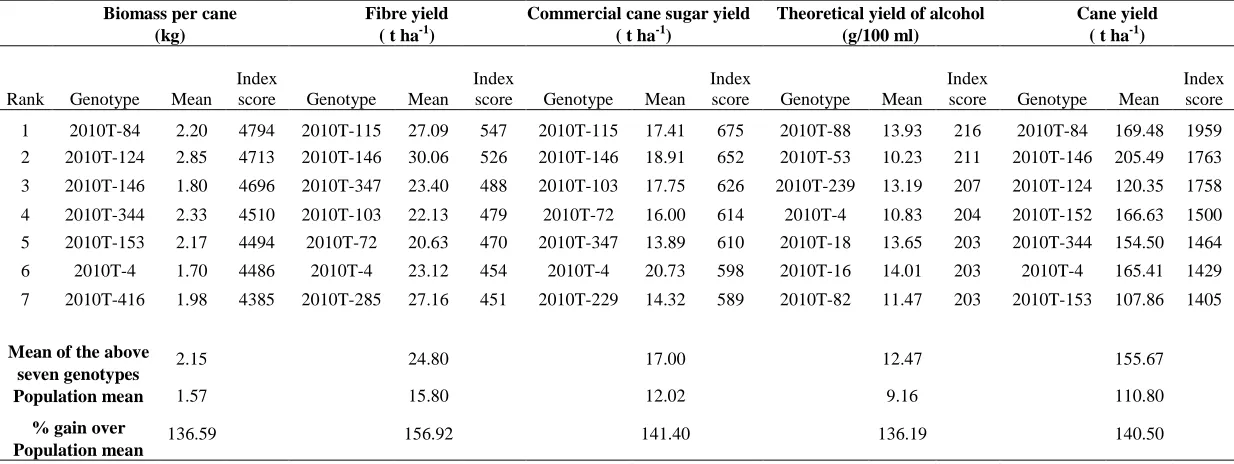
Using the best index, the top 10 per cent of the clones for five diversified uses viz., biomass, fibre yield, CCS yield, theoretical yield of alcohol and cane yield were selected (Table 4). Comparison of the means of selected population with that of the original population revealed that there was sizable improvement in the target characters. In addition to the genotypes viz., 2010T-4, 2010T-53, 2010T-72, 2020T-84, 2010T-115, 2010T-146, 2010T-152 and 2010T-285 suggested for promotion as varieties for diversified uses, the genotypes 2010T-16, 2010T-18, 2010T-82, 2010T-88, 2010T-103, 2010T-124, 2010T-153, 2010T-229, 2010T-239, 2010T-344, 2010T-347 and 2010T-416 selected by the index method could serve as potential genetic stocks in sugarcane breeding for diversified uses.
References
Bruce, S., Dien, Nagle, N., Vijay Singh., Moreau, R.A., Tucker, M.P., Nichols, N.N., Johnston, D.B., Cotla, M.A., Hicks, K.B., Nguyen, Q and Bothast, R.J. 2005. Review of process for producing corn fiber oil and ethanol from “Quick fiber”. International Sugar Journal. 107(1275): 187-190.
Fisher, R.A. 1936. The use of multiple measurements in taxonomic problem. Annals of Eugenics. 7: 179-88.
ISSN 0975-928X
Table 1. Scoring of genotypes based on mean performance for diversified uses in Second clonal stage in sugarcane
S. No. Genotypes Biomass Fibre
yield
CCS yield
Theoretical yield of alcohol
Cane yield
Total Score
1 2010T-146 1 5 4 0 5 15
2 2010T-4 0 3 5 1 4 13
3 2010T-103 0 3 3 3 3 13
4 2010T-152 1 1 3 2 4 12
5 2010T-72 0 2 2 4 3 12
6 2010T-84 3 2 2 0 3 12
7 2010T-115 0 5 3 0 3 12
8 2010T-53 1 2 4 1 2 11
9 2010T-285 0 5 2 0 2 9
10 2010T-344 4 0 1 0 3 9
11 2010T-387 0 3 3 0 2 8
12 2010T-109 3 0 1 2 1 7
13 2010T-229 0 2 1 3 1 7
14 2010T-347 0 3 1 0 3 7
15 2010T-58 0 1 2 2 1 6
16 2010T-16 0 0 1 4 0 5
17 2010T-88 0 0 1 4 0 5
18 2010T-124 5 0 0 0 0 5
19 2010T-20 0 0 2 2 0 4
20 2010T-83 3 1 0 0 0 4
21 2010T-374 2 2 0 0 0 4
22 2010T-184 0 0 3 0 1 4
23 2010T-18 0 0 0 3 0 4
24 2010T-173 1 0 0 3 0 4
25 2010T-15 0 0 0 3 0 3
26 2010T-82 0 0 1 2 0 3
27 2010T-153 3 0 0 0 0 3
28 2010T-239 0 0 0 3 0 3
29 2010T-26 0 0 0 3 0 3
ISSN 0975-928X
Table 1. Contd.,
S. No. Genotypes Biomass Fibre
yield
CCS yield
Theoretical yield of alcohol
Cane yield
Total Score
31 2010T-171 0 1 1 0 0 2
32 2010T-369 0 0 2 0 0 2
33 2010T-358 2 0 0 0 0 2
34 2010T-172 2 0 0 0 0 2
35 2010T-55 0 0 0 2 0 2
36 2010T-416 2 0 0 0 0 2
37 2010T-355 1 0 0 0 0 1
38 2010T-368 1 0 0 0 0 1
39 2010T-430 0 0 0 1 0 1
40 2010T-144 1 0 0 0 0 1
41 2010T-340 0 0 0 1 0 1
42 2010T-366 0 0 0 0 1 1
43 2010T-8 0 0 0 1 0 1
44 2010T-161 0 0 1 0 0 1
45 2010T-313 0 0 0 0 1 1
46 2010T-335 1 0 0 0 0 1
47 2010T-408 0 1 0 0 0 1
48 2010T-240 0 1 0 0 0 1
49 2010T-365 1 0 0 0 0 1
50 2010T-183 1 0 0 0 0 1
51 2010T-208 1 0 0 0 0 1
Mean 1.65 16.86 13.06 9.63 119.23
CD 0.15 1.96 1.44 1.05 13.32
Score Biomass Fibre yield CCS yield Theoretical
yield of alcohol Cane yield
1 Mean+1CD 1.80 18.82 14.50 10.68 132.55
2 Mean+2CD 1.95 20.78 15.94 11.73 145.87
3 Mean+3CD 2.10 22.74 17.38 12.78 159.19
4 Mean+4CD 2.25 24.70 18.82 13.83 172.51
5 Mean+5CD 2.40 26.66 20.26 14.88 185.83
ISSN 0975-928X
Table 2. Genotypes identified for diversified uses
S. No. Diversified uses No. of uses Genotypes
1 Biomass + Fibre yield + Commercial cane sugar yield + Theoretical yield of alcohol + Cane yield 5 2010T-152, 2010T-53
2 Biomass + Fibre yield + Commercial cane sugar yield + Cane yield 4 2010T-146, 2010T-84
3 Fibre yield + Commercial cane sugar yield + Theoretical yield of alcohol + Cane yield 4 2010T-4, 2010T-103, 2010T-72, 2010T-229, 2010T-58
4 Biomass + Commercial cane sugar yield + Theoretical yield of alcohol + Cane yield 4 2010T-109
5 Fibre yield + Commercial cane sugar yield + Cane yield 3 2010T-115, 2010T-387, 2010T-285, 2010T-347
6 Biomass + Commercial cane sugar yield + Cane yield 3 2010T-344
7 Commercial cane sugar yield +
Cane yield 2 2010T-184
ISSN 0975-928X
Table 3. Top ranking sugarcane genotypes based on mean performance for diversified uses
Biomass per cane Fibre yield CCS yield Theoretical yield of Cane yield
(kg) (t ha-1) (t ha-1) alcohol (g/100ml) (t ha-1)
Rank Genotype Mean Genotype Mean Genotype Mean Genotype Mean Genotype Mean
1 2010T-124 2.85 2010T-146 30.06 2010T-4 20.73 2010T-72 14.67 2010T-146 205.49
2 2010T-344 2.33 2010T-285 27.16 2010T-53 19.75 2010T-16 14.01 2010T-115 171.13
3 2010T-84 2.2 2010T-115 27.09 2010T-146 18.91 2010T-88 13.93 2010T-84 169.48
4 2010T-153 2.17 2010T-347 23.4 2010T-152 18.52 2010T-18 13.65 2010T-152 166.63
5 2010T-83 2.13 2010T-4 23.12 2010T-103 17.75 2010T-103 13.37 2010T-4 165.41
6 2010T-109 2.07 2010T-387 22.66 2010T-115 17.41 2010T-239 13.19 2010T-347 160.05
7 2010T-416 1.98 2010T-103 22.13 2010T-387 17.33 2010T-15 13.13 2010T-103 159.82
Table 4. Top ranking genotypes based on the best selection index for diversified uses in sugarcane
Biomass per cane Fibre yield Commercial cane sugar yield Theoretical yield of alcohol Cane yield
(kg) ( t ha-1) ( t ha-1) (g/100 ml) ( t ha-1)
Index score
Index score
Index score
Index score
Index score
Rank Genotype Mean Genotype Mean Genotype Mean Genotype Mean Genotype Mean
1 2010T-84 2.20 4794 2010T-115 27.09 547 2010T-115 17.41 675 2010T-88 13.93 216 2010T-84 169.48 1959 2 2010T-124 2.85 4713 2010T-146 30.06 526 2010T-146 18.91 652 2010T-53 10.23 211 2010T-146 205.49 1763 3 2010T-146 1.80 4696 2010T-347 23.40 488 2010T-103 17.75 626 2010T-239 13.19 207 2010T-124 120.35 1758 4 2010T-344 2.33 4510 2010T-103 22.13 479 2010T-72 16.00 614 2010T-4 10.83 204 2010T-152 166.63 1500 5 2010T-153 2.17 4494 2010T-72 20.63 470 2010T-347 13.89 610 2010T-18 13.65 203 2010T-344 154.50 1464 6 2010T-4 1.70 4486 2010T-4 23.12 454 2010T-4 20.73 598 2010T-16 14.01 203 2010T-4 165.41 1429 7 2010T-416 1.98 4385 2010T-285 27.16 451 2010T-229 14.32 589 2010T-82 11.47 203 2010T-153 107.86 1405
Mean of the above 2.15 24.80 17.00 12.47 155.67
seven genotypes
Population mean 1.57 15.80 12.02 9.16 110.80
% gain over 136.59 156.92 141.40 136.19 140.50