Advanced Ceramics Progress
Research Article
J o u r n a l H o m e p a g e : w w w . a c e r p . i r
Microstructure, mechanical and thermal properties of chalcogenide glasses
and glass-ceramics based on Se-As-Ge system nucleated by Sn
S. Ahmadpour, M. Rezvani*
Department of Materials Science and Engineering, University of Tabriz, Iran
P A P E R I N F O A B S T R A C T
Paper history:
Received 16 June 2019
Accepted in revised form 1 July 2019
In particular, chalcogenide glasses and glass-ceramics are new materials that exhibit good transparency in infrared region (0.8-12µm). We can overcome the main weakness of these glasses by improving the hardness through controlling crystallization. In this paper, we report results of a study on chalcogenide glasses in the ternary system of As-Se-Ge with nominal composition of Snx (Se0.6As0.1Ge0.3)100-x (x= 0, 2, 4 and 6 mol %) which is suitable for use in optical devices. Melt quench technique was used for preparing alloy specimens. Glass-ceramics were made using an appropriate heat-treatment temperature and time from Snx (Se60As10Ge30)100-x glasses in order to improve the mechanical properties. The temperature of the heat treatment started with the peak temperature (Tp) for glasses and different characteristics of prepared glasses such as glass transition temperature, hardness, density, transmittance, and microstructure were determined. Initially, Tg temperature was decreased with the addition of Sn, but with an increase of Sn up to 6 mol%, Tg was increased due to structural cohesion and formation of long chains of selenium. In this study, the highest value of the hardness for the Se60Ge30As10Sn6 glass was obtained after heat treatment and forming a crystalline phase while maintaining the initial transmittance.
Keywords: Chalcogenide glasses Chalcogenide glass-ceramic GeSe,
SeSn nanocrystals, Hardness
1. INTRODUCTION *
Chalcogenide glasses are semiconductor materials that are oxygen-free and have been considered by many researchers because of their high transmittance in the IR region and military and civilian applications. They are also a good candidate as an alternative to the thermal cameras. IR transparency of these glasses is generally reported in the wavelength range of 1-12μm [1-5]. High nonlinear refractive index and low phonon energy are the other characteristics of chalcogenides. Refractive index and transparency range of these glasses are dependent on the composition [5]. Due to their unique optical and physical properties, chalcogenide glasses have been considered as promising materials for mid-infrared (IR) optics such as amplifiers, thermal imaging and chemical sensors [6-10]. However, chalcogenide glasses have poor mechanical properties compared to mono or polycrystals that are regularly utilized in the infrared industry so that limit application areas of chalcogenide glasses [11]. Improving mechanical properties of mid and far IR passing glasses is very
* Corresponding author email: [email protected]
Our main goal was to improve the mechanical properties of these glasses with the controlled heat treatment. We were able to significantly increase the hardness of these glass-ceramics and maintain their infrared transmittance.
2. EXPERIMENTAL
Chalcogenide glasses were prepared from 20g batches of high purity (5N, Sigma Aldrich) Ge, Se, As and Sn with nominal composition of Snx (Se0.6As0.1Ge0.3)100-x
(x=0, 2, 4 and 6) (listed in Table 1) by the conventional melt quenching technique. This glassy system is one of the functional and commercial combinations. In addition to four main components of Se-As-Ge- Sn, very low content of Al (100ppm) is also used to reduce oxide absorption bands. First, quartz capsules with a purity of 99% by 20cm in length, 5.08cm in diameter, and 2mm in thickness were immersed for 5 minutes in hydrofluoric acid. In order to increase the glass transmission, the inner wall of the quartz capsule should have a low hydroxide element. It was then washed with distilled water and acetone. At that time, they were placed in a furnace at 700°C for two hours and then dried in the air.
Required amounts of raw materials were weighed inside a glove box and loaded into a pre-cleaned quartz capsuleFree ends of capsules were located under vacuum using a vacuum pump at a pressure of 1 mbar for 3 minutes and sealed at the same time by an acetylene flame. The capsules were melted for 8 hours at 900 ℃ in an oscillating furnace to achieve homogeneous melting. Melting samples were rapidly quenched in a salt bath (KNO3 + NaNO3) at 250°C. The samples were annealed
at 300°C for 2 hours to reduce the residual stresses in the glass. They then remained at ambient temperature. The quartz capsules were broken and glass ones were obtained. For further investigation and various analyzes, the glass samples were cut using a cutting machine in thicknesses of 3 mm.
In order to investigate the thermal behavior of the prepared glasses, the DSC thermal analysis (NETZSCH-STA 449F3) was served. On the basis of Differential Scanning Calorimetry results (heating rate of 10 ℃/min), crystallization temperatures were determined. Glass-ceramic samples were prepared by heat-treating of glasses at different temperatures starting from crystallization peak temperature in the electrical furnace. The amorphous nature of the glasses and identification of crystalline phases in glass-ceramic samples were confirmed by Philips Xpert-MDD system (radiation of Cu-Kα, λ=1.54 A°). Preparation of Field Emission
Scanning Electron Microscopy (FESEM) specimens involves polishing in a (H2SO4 +H2O2) solution for 1
minute and applying a gold coating. Finally, FESEM observations were performed on the prepared samples by the MIRA3TESCAN-XM-FESEM.
The transmittance of the glasses and glass-ceramics was measured with a Fourier transform infrared (FTIR) spectrophotometer (S8400 SHIMADZU) in the range of 2-14μm. With the intention of measure the microhardness of the samples after mechanical polishing, several hardness tests were carried out by the German Roell Zwieck, Zhv10 machine using examining 5 points of each sample and then averaging. The density of the specimens was calculated using the Archimedes method.
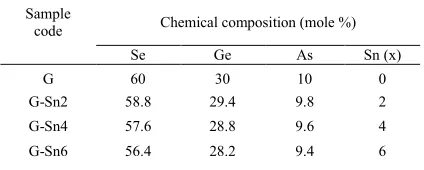
TABLE 1. Compositions of glasses with different amounts of Sn
Sample
code Chemical composition (mole %)
Se Ge As Sn (x)
G 60 30 10 0
G-Sn2 58.8 29.4 9.8 2
G-Sn4 57.6 28.8 9.6 4
G-Sn6 56.4 28.2 9.4 6
3. RESULTS AND DISCUSSION
3.1. Glass formation
According to the results of previous work [16], it became clear that these glasses have the amorphous nature. As illustrated in patterns, there was no sharp peak and crystalline phase which show that no unfavorable crystallization occurred throughout the preparation of the glasses. XRD patterns of glasses display two broad bands as given in Figure1 which represents undeveloped sprouts that are likely to crystallize with the controlled heat treatment.
Differential scanning calorimetry (DSC) was used to obtain the thermograms of Snx (Se60As10Ge30)100-x (x=0,
2, 4 and 6) chalcogenide glasses at a heating rate of 10℃/min that is shown in Fig. 2. From these DSC curves, glass transition temperatures (Tg) and
crystallization ones are observed at endothermic and exothermic peaks, respectively.
Tg demonstrates the strength or rigidity of the glass
structure [17]. As seen in Figure 2, with an increase in the content of Sn from 0 to 6 mol%, the temperature Tg of the glasses were decreased to a lower temperature than the base glass.
atomic mass of Sn. [19]. One distinguishable exothermic peak is observed at the temperature Tp. It is obvious that
an exothermal peak appears with the addition of Sn and becomes more intense and moves to the lower
temperature as the Sn content increases up to 4 mol%. In contrast, the addition of Sn up to 6 mol% increases the temperature of the crystallization due to increasing the connectivity and rigidity of the glass network.
Figure 1. X-ray diffraction patterns of Snx (Se0.6AS0.1Ge0.3)100-x chalcogenide glasses [16].
Figure 2. DSC curves of Snx(Se60As10Ge30)100-x (x=0, 2, 4 and 6) glasses with a heating rate of 10℃/min [16].
3.2. Crystallization of glass samples
The controlled crystallization of the glass samples was performed under the different conditions as mentioned in Table 2. The investigations showed that no crystallization occurred due to the heat treatment of the
glasses at temperatures below the temperature of the crystallization peak. As an essential parameter for the crystallization process, the temperature of the heat treatment was selected in the temperature range of the Tp
peak. This temperature was obtained according to the DSC curves (see Figure 2). The crystallization temperatures started from the peak crystallization temperature of the samples and decreased in the specimen containing 6 mol% Sn with 20℃ temperature intervals up to 416℃.
The samples containing 2 and 4 mol% Sn were not crystallized at their crystallization peak temperature. To achieve the desired glass-ceramic, instead of the temperature, the heat treatment time changed. The heat treatment time for the samples was initially 2.5 hours and the heating rate was 5℃ / min.
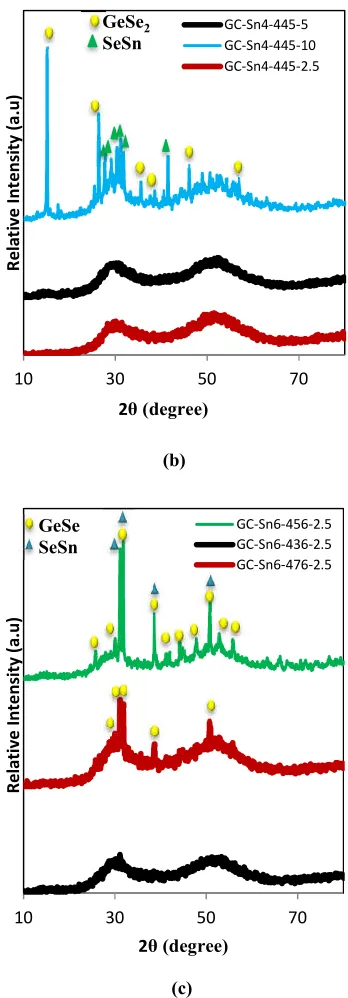
The X-ray diffraction pattern was used to identify crystallized phases in the samples. Figure 3 indicates the XRD patterns of the specimens containing different Sn values that were under the heat treatment at different times and temperatures. The glass containing 2 mol% Sn, which was heat-treated at the peak temperature for 2.5 hours, showed no crystalline phases. The glass was then heat-treated for 10 hours at this temperature, but it still did not show a crystalline phase as shown in Fig. 3(a). Moreover, the glass composing of 4 mol% Sn was not crystallized at the temperature Tp which was heated
for 2.5 hours at that temperature.
This glass was crystallized by increasing the heat treatment time up to 10 hours (Figure 3(b)). GeSe2 and
SnSe with monoclinic and orthorhombic structures in that order [JCPDS file card no. 00-042-104 and JCPDS
10 20 30 40 50 60 70 80
Re
lative
Inte
nsity
2θ(degree)
file card no. 00-032-1382] are phases, which had been deposited from this glass, that were identified using the Xpert software.
Figure 3(c) shows the XRD pattern of the sample containing 6 mol% tin which was heat-treated for 2.5 hours from Tp (476℃) to 436℃. According to these
patterns, two major phases of SnSe and GeSe are precipitated in the glasses during the heat treatment
TABLE 2. Conditions of crystallization heat treatment for samples containing various amounts of Sn
Sample code Sn content
Heat treatment temperature
(℃)
Heat treatment
time (h)
GC-Sn2-467-2.5
2 467
2.5
GC-Sn2-467-5 5
GC-Sn2-467-10 10
GC-Sn4-445-2.5
4 445
2.5
GC-Sn4-445-5 5
GC-Sn4-445-10 10
GC-Sn6-476-2.5
6
476
2.5
GC-Sn6-456-2.5 456
GC-Sn6-436-2.5 436
(a)
(b)
(c)
Figure 3. XRD patterns of glasses after heat treatment: (a) 2 mol% Sn, (b) 4 mol% Sn and (c) 6 mol% Sn.
Moreover, the Schere’s relationship (Eq. (1)) was used to calculate the size of crystals embedded in the glass field [20].
D=0.9λ/B CosθB (1)
10 30 50 70
Relative
Inte
nsity
(a
.u)
2θ (degree)
GCSn2-467-5
GCSn2-467-10
GC-Sn2-467-2.5
10 30 50 70
R
ela
ti
ve
I
nt
ensit
y (a
.u)
2θ (degree)
GC-Sn4-445-5 GC-Sn4-445-10 GC-Sn4-445-2.5
GeSe2 SeSn
10 30 50 70
Relative
Inte
nsity
(a
.u)
2θ (degree)
GC-Sn6-456-2.5 GC-Sn6-436-2.5 GC-Sn6-476-2.5
Where D is the crystal size, λ is the wavelength of X-ray (Cu Kα: 1.54°A), θB is the diffraction angle and B is the
width of a diffraction peak at half maximum. The calculated crystal size of crystalline phases in glass-ceramic samples is presented in Table 2. We can determine from the DSC curves that an increase in Sn content leads to an upsurge in the peak temperature of the glasses. Furthermore, the size and amount of crystalline phases are increased with enhancing the temperature and time of the heat treatment.
According to the X-ray diffraction patterns, the content of the crystalline phase is obtained using the following equation. The X-ray diffraction method was first proposed by Ohlberg-Strickler to determine the percentage of the crystalline phase in the glass-ceramics [21].
Crystalline phase (%) = Ig-Ix/Ig-Ib (2)
Where:
Ib: maximum peak intensity in a mechanical mixture of
components
Ig: maximum peak intensity of the amorphous glass
Ix: maximum peak intensity of the crystallized sample.
The content of the crystalline phase was calculated and shown in Table 2. The content of the crystalline phase as well as the size of the crystals increases due to increasing the temperature and heat treatment time.
TABLE 3. The average size of crystals and volume percentage of the crystalline phase
Sample code Crystal size (nm) Content of crystalline phase
GC-Sn4-445-10 35 25
GC-Sn6-476-2.5 32 28
GCSn6-456-2.5 28 18
The density of the as-prepared glasses and the samples under the heat treatment was measured to determine that the density can be used as the quality control for bulk synthesized material. Five separate determinations of d were made on each sample and their average was determined.
The density (D) has been calculated based on Standard D151163 by using the following formula:
D = (g/cm3) (3)
Where W1, W2 are the mass of samples in the air and in water, respectively. On the other hand, after calculating the density, the molar volume (Vm) of the samples can be
calculated using Eq. (4):
Vm = ∑ / (4)
Where Mi, denotes the molar mass of the glass which is
determined using Eq. (5):
Mi = CiAi (5)
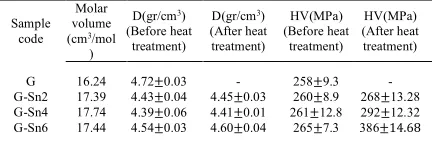
Ci and Ai are the molecular concentration and molecular mass of the samples, respectively [22, 23]. Table 4 shows values of the measured density for a glass containing various amounts of Sn before and after the heat treatment. The density of glasses produced with the Sn up to 4% mol is reduced.However, it is increased with the addition of 6 mol% Sndue to the structural coherence of the glass. Density changes depend on the glass structure, the atomic weight and atomic mass of the elements [24].
After the heat treatment, the density of the samples is increasedby forming more nuclei. With respect to the inverse relationship between the molar volume and density, the volume of the system decreases and the glass density of samples increases
Microhardness testing is a method of determining hardness or resistance of the material to penetration. The measured microhardness values of heat-treated glasses are given in Table 4. According to Table 4, it can be
seen that the hardness of glasses is increased after the heat treatment due to the formation of fine crystals inside the glass field.
TABLE 4. Some physical properties of glasses containing various amounts of Sn before and after heat treatment
Sample code
Molar volume (cm3/mol
)
D(gr/cm3)
(Before heat treatment)
D(gr/cm3)
(After heat treatment) HV(MPa) (Before heat treatment) HV(MPa) (After heat treatment)
G 16.24 4.72±0.03 - 258±9.3
-G-Sn2 17.39 4.43±0.04 4.45±0.03 260±8.9 268±13.28 G-Sn4 17.74 4.39±0.06 4.41±0.01 261±12.8 292±12.32 G-Sn6 17.44 4.54±0.03 4.60±0.04 265±7.3 386±14.68
The FT-IR spectra were investigated for the study of transmission and structure of chalcogenide glasses. Figure 4(a) indicates the FT-IR spectra of Snx(Se0.6As0.1Ge0.3)100-x (x=0, 2, 4 and 6) glasses.
Regardless of the chemical composition, there are several absorption peaks in the FTIR spectra owing to the presence of oxide and hydrate impurities from raw materials and quartz capsules. The absorption peaks at 2.92, 4.57, 5.1, 6.4 and 8.2μm can be assigned to SeO-H, Se-SeO-H, AsO-SeO-H, and Ge-O vibrations, correspondingly [25, 26]. The glass structure of the Se-As-Ge system includes short-range groups such as SeSe2/2, GeGe4/4,
AsSe3/2 ،GeSe4/2 ،As2Se4/2 ،GeSe2/2 [27]. By increasing
Sn from 0 to 6 mol%, the percentage of glass transmission is reduced.
that it helps to make the glass more homogeneous. In the Ge-As-Se glass system, the bonding energy is Ge-Se
(42. 49 Kj/mol), and As-Se (41.69 kJ / mol) which are close to each other [15].
Figure.4. FT-IR spectra of Se-As-Ge chalcogenide glasses containing different amounts of Sn before and after heat treatment.
To compare the transmittance, the FTIR spectra of the glass-ceramic were scrutinized after the formation of fine crystallites. .According to the Fig.4(b), it can be seen that the transmittance of Sn-containing glasses is decreased with the formation of crystals, also, the absorption bands observed in the glass are perceived in Sn-containing glass-ceramics too. Reduction of the IR transmittance is mainly owing to the dispersal dissipation caused by crystals. Therefore, the number and size of crystals in the glass field determine the type of IR transmission spectrum. When the size of the
crystals becomes larger, the dispersal effect extends over the IR spectrum to a longer wavelength region [14]. The FESEM images of the glass-ceramic GC-Sn6-476-2.5 and GC-Sn4-445-10 crystallized at the peak temperature are taken due to the crystallization. Good hardness and transmittance ability of the IR range are shown in Figs. 5 and 6 As a result of the single-step crystallization process, clusters of crystals and the lack of uniformity of their size are quite evident. Based on XRD results, two different crystal phases in these glass-ceramics were observed.
Figure 6. FESEM photographs of the polished and chemically etched surface of sample G-Sn6 heated at 476 ℃ for 2.5 h
4. CONCLUSION
The results showed that the Tg temperature is initially
reduced by adding Sn, however, with an increase in Sn value up to 6 mol%, Tg is increased due to the structural
cohesion and formation of long selenium chains. Sn acts as a germinating agent in excess of 4 mol%, and the glass is crystallized by the controlled heat treatment. The hardness of samples containing 4 and 6 mol% Sn after the heat treatment and forming a crystalline phase was increased from 261 to 292 Mpa and 265 to 386 Mpa, respectively. A slight decrease in the transmittance of the FT-IR spectrum is due to the refraction of light thanks to dispersed crystals and size of these crystals in the glass field. In this study, the highest hardness value (~356 Mpa) was obtained
5. ACKNOWLEDGEMENT
We are holly appreciated those who hand us in the whole procedures of investigation.
RFFERENCES
1. Gleason, B., Richardson, K., Sisken, L., Smith, C., “Refractive index and thermo-optic coefficients of Ge-As-Se chalcogenide glasses”, Journal of Applied Glass Science, Vol. 7, (2016), 374-383.
2. Singh, A. K., Singh, K., “Composition dependence of UV-visible and MID-FTIR properties of Se98-xZn2Inx(x=0, 2, 4, 6 and 10) chalcogenide glasses”, Journal of Modern optics, Vol. 56, (2009), 471-476.
3. Kumari, V., Kaswan, A., Patidar, D., Saxena, S., Sharma, K., “Temperature dependence of thermal transport properties of GeSeSb chalcogenide glasses”, International Journal of Thermophysics, Vol. 36, (2015), 722-732.
4. Marchand, C., “Characterization of chalcogenide glasses”,
Application Scientist: Thin Film Division, horiba group, France, Vol. 10, (2003), 1-10.
5. Liu, Q., Zhao, X., “Non- linear optical properties of chalcogenide and chalcohalide glasses”, Journal of Non- crystalline solids, Vol. 356, (2010), 2375-2377.
6. Shiryaev, V.S., Velmuzhov, A.P., Tang, Z.Q., Churbanov, M.F., Seddon, A.B., “Preparation of high purity glasses in the Ga-Ge-As-Se system”, Journal of Optical Materials, Vol. 37, (2014), 18-23.
7. Cardinal, T., Richardson, K.A., Shim, H., Schulte, A., Beatty, R., Le Foulgoc, K., Meneghini, C., Viens, J.F., Villeneuve, A., “Non-linear optical properties of chalcogenide glasses in the system As-S-Se” , Journal of Non-crystalline solids, Vol. 256 &257, (1999), 353-360.
8. Wang, R. P. C., Zha, J., Luther- Davies, B., “Thermal characterization of Ge-As-Se glasses by differential scanning calorimetry”, Journal of Mater Sci: Mater Electron, Vol. 18, (2007), 419 -422.
9. Zhang, X.H., Calvez, L., Seznec, V., Ma, H.L., Danto, S., Houizot, P., Boussard-Plédel, C., Lucas, J., “Infrared transmitting glasses and glass- ceramics”, Journal of Non- crystalline Solids, Vol. 352, (2006), 2411- 2415.
10. Calvez, L., “Chalcogenide glasses and glass-ceramics: Transparent materials in the infrared for dual applications”,
Comptes Rendus Physique, Vol. 18, (2017), 314- 322. 11. Hubert, M. Ph.D. Thesis, university of Arizona. 2012. 12. Donghui, Z., Fang, X., Guorong, C., Xianghua, Z., Hongli, M.,
Adam, J.L., “Formation and properties of chalcogenide glasses in the GeSe2–As2Se3–CdSe system”, Journal of the American Ceramic Society, Vol. 88, (2005), 3143-3146..
13. Wang, H., Zhang, X., Yang, G., Xu, Y., Ma, H., Adam, J.L., Gu, Z.A., Chen, G., “Micro-crystallization of the infrared transmitting chalcogenide glass in GeSe2–As2Se3–PbSe system”, Ceramics International, Vol. 35, (2009), 83-86. 14. Xia, F. Baccaro, S. Wang, W., Chen, G. “Nanophase separation
and effects on properties of Ge-As-Se chalcogenide glasses”,
Journal of Non-crystalline Solids, Vol. 354, (2008), 1137-1141.
15. Ahmadpour, S., Rezvani, M., “The effect of Sn on the physical and optical properties of (Se0.6As0.1Ge0.3)100-xSnx glasses”,
Spectrochimica Acta Part A: Molecular and Biomolecular Spectroscopy, Vol. 205, (2018), 258-263.
17. Kumar, S., Singh, K., “Glass transition, thermal stability and glass-forming tendency of Se90-xTe5Sn5Inx multi-component chalcogeniide glasses”, Journal of Thermochimica Acta, Vol. 528, (2011), 32-37.
18. Modgil, V., Rangra, V.S., “Effect of Sn addition on thermal and optical properties of Pb9Se71Ge20-xSnx (8 ≤x ≤12) glass”,
Journal of Materials, (2014), 1- 8.
19. Lipson, M., “The study of metals and alloys by X-Ray powder diffraction”, Published for the International Union of Crystallography by University College Cardiff press Cardiff, Wales, (2001).
20. Manafi, S., Soltanmoradi, A., “Investigation of sintered hydroxide apatite nono-powder”, Journal of Modern processes in material, Vol. 3, (2013).
21. Shakeri, M., Rezvani, M., “Optical band gap and spectroscopic study of lithium alumino silicate glass containing Y 3+ ions”,
SpectrochimicaActa Part A: Molecular and Biomolecular Spectroscopy, Vol. 79, (2011), 1920-1925.
22. Chanshetti, U.B., Shelke, V.A., Jadhav, S.M., Shankarwar, S.G., Chondhekar, T.K., Shankarwar, A.G., Sudarsan, V., Jogad, M.S., “Density and molar volume studies of phosphate glasses”, Facta universitatis-series: Physics, Chemistry and Technology, Vol. 9, No. 1, (2011), 29-36.
23. Fadel, M., “The physical properties and chemical bond approach for Se-As-Ge amorphous chalcogenide”, Journal of Elsevier Science Ltd, Vol. 48, (1997), 73-83.
24. Shiryaev, V., Sibirkin, A., “Hetrophase inclusions and dissolved impurities in Ge25Sb10S65 glass”, Journal of Non- Crystalline Solids, Vol. 355, (2009), 2640- 2646.
25. Pamukchieva, V., Gartner, M., “IR studies of impurities in chalcogenide glasses and thin films of the Ge-Sb-S-Te system”,
Journal of Physics, Vol. 356, (2012), 1-6.
26. Adam, J.L. and Zhang, X. “Chalcogenide glasses Preparation, Properties and applications”, Woodhead Publishing, Vol. 44, (2014), 360- 362.
27. Roze, M. L., Zhang, X. H., “Optical and mechanical properties of glasses and glass-ceramics based on the Ge-Ga-Se system”,
![Figure 1. X-ray diffraction patterns of Snx (Se0.6AS0.1Ge0.3)100-x chalcogenide glasses [16]](https://thumb-us.123doks.com/thumbv2/123dok_us/8893678.1826632/3.612.90.280.370.607/figure-ray-diffraction-patterns-snx-se-chalcogenide-glasses.webp)