1
DEVELOPMENT AND PARTIAL VALIDATION OF THE
LAMIVUDINE DRUG IN BULK AND SOLID DOSAGE FORM BY
COLORIMETRY
*CP. Karunasree, PV. Rajesh, G. Dharmamoorthy, K. Padmini, CH. Sudeer
Seven hills College of Pharmacy, Tirupati, Andhra Pradesh, India.
Abstract
A new, simple and sensitive spectrophotometric method in visible region has been developed for the determination of Lamivudine in bulk and in pharmaceutical formulations. Lamivudine exhibits absorption maxima at 425 nm. Developed method obeyed the Beer’s law in the concentration range of 5 - 20 μg/mL. The method is accurate, precise and economical. The proposed method has been applied successfully for the analysis of the drug in pure and in its tablet dosage forms. In this method, there is no interference from any common pharmaceutical additives and diluents. The % recovery is greater than 99 to101%. %, this shows that the method was free from the interference of excepients. The results of the tablet analysis were validated with respect to accuracy (recovery), linearity, limit of detection and limit of quantization were found to be satisfactory.
Keywords: UV Spectrophotometry, Lamivudine, Colorimetric Estimation, Lamivudine Tablet.
INTRODUCTION
Lamivudine is a potent nucleoside analog reverse transcriptase inhibitor (nRTI) used as an antiretroviral agent that inhibits replication of some retroviruses in combination with zidovudine in the management of HIV (human immunodeficiency virus).Lamivudine (2',3'-dideoxy-3'-thiacytidine, commonly called 3TC) is a potent nucleoside analog reverse transcriptase inhibitor (nRTI).It is marketed by GlaxoSmithKline with the brand names Zeffix, Heptovir, Epivir, and Epivir-HBV.Lamivudine has been used for treatment of chronic hepatitis B at a lower dose than for treatment of HIV. It improves the seroconversion of e-antigen positive hepatitis B and also improves histology staging of the liver. Long term use of lamivudine unfortunately leads to emergence of a resistant hepatitis B virus (YMDD) mutant. Despite this, lamivudine is still used widely as it is well tolerated. Literature survey revals only few analytical methods that have been developed for its determination of Lamivudine in human plasma has been mainly determined using liquid or gas chromatography with mass spectrometry, following
a liquid–liquid extraction Hence it was thought worthwhile to develop simple spectrophotometric method for the same [1-3].
MECHANISM OF ACTION
Lamivudine is a synthetic nucleoside analogue and is phosphorylated intracellularly to its active 5'-triphosphate metabolite, Lamivudine 5'-triphosphate (L-TP). This nucleoside analogue is incorporated into viral DNA by HIV reverse transcriptase and HBV polymerase, resulting in DNA chain termination [8].
MATERIALS AND METHODS Experimental
A Systronics UV-Vis double beam spectrophotometer (model 2201) with 1 cm matched quartz cells was used for all spectral measurements. All chemicals used were of A.R. grade from S.D. Fine-chem, Merck, Fischer scientific, and Spectrochem, Mumbai. Authentic drug sample of Lamivudine was given as a gift sample by Hetero drugs limited, Hyderabad. Tablets of Lamivudine are procured from local market.
Corresponding Author:- C.P.Karunasree Email:- [email protected]
International Journal of
Medicinal Chemistry & Analysis
www.ijmca.com
e ISSN 2249 - 7587
2
Working Standard Solution of LamivudineStandard stock solution was prepared by dissolving accurately weighed, 100mg of Lamivudine in distilled water and the volume was made upto 100ml with distilled water (stock solution-I, 1000 mcg/ml).From this, a working standard solution containing 100 mcg/ml was prepared with distilled water and the same was used for UV method using distilled water .
Sample Preparation of Lamivudine
20 tablets of two different brands of Lamivudine were weighed and powdered in glass mortar and the powder equivalent to 25 mg of Lamivudine was weighed accurately and transferred into a 25 ml standard volumetric flask. The contents were dissolved in distilled water and sonicated for five minutes. This solution was filtered through 0.45 µm.Whatmann filter paper. 5 ml of the filtrate was diluted to 50 ml with distilled water to get the solution of 100 mcg/ml and the same was used for Visible method using distilled water.
Colorimetric Estimation of Lamivudine using
Hydroxyl amine
Method is based on condensation of Lamivudine with hydroxyl amine under acidic conditions to form an oxime that is a yellow coloured chromogen which shows maximum absorption at 425 nm (Fig. 2) and obeys Beer’s law in the concentration range of 5-20 mcg/ml (Fig. 3)
Preparation of reagents
Hydroxyl amine hydrochloride solution (0.5% w/v): It was prepared by dissolving 0.5 g of hydroxyl amine hydrochloride in 50 ml of water. Then 50 ml of ethanol (95%) and 1 ml of bromo phenol blue solution was added .Then 0.1M NaOH was added until the solution becomes green.
Bromophenol blue solution: It was prepared by dissolving 0.1 g of bromophenol blue with gentle heating in 1.5 ml of 0.1M NaOH and 20 ml of ethanol (95%).Then sufficient water was added to produce 100 ml.
Development of colour and study of spectra in visible region
Aliquots of standard solution of Lamivudine ranging from 0.5 to 2.0 ml (1 ml = 100 mcg) were transferred into a series of 10 ml volumetric flask. To each flask, 2.0 ml of hydroxyl amine solution (0.5% w/v) and 1 ml of Con.HCl was added and heated on boiling water bath for 30 min at a temperature of 100º C. The flasks were cooled and the volume in each flask was made up to 10 ml with distilled water. The absorbances of yellow colored chromogen were measured at 425 nm against the reagent blank. The colored chromogen was stable for 2 hours. The amount of Lamivudine present in the sample solution was computed from the respective calibration curve.
RESULTS & DISCUSSION
The objectives of the proposed work was to develop some new and sensitive analytical methods for the determination of Lamivudine and to validate the methods according to USP and ICH guidelines and applying the same for its estimation in pharmaceutical formulations. There is no official method for the estimation of Lamivudine.
The absorption spectra were recorded in the wavelength 350-800 nm in visible spectrometry. The UV spectra of Lamivudine are presented in fig-2 and 3. The absorption maxima (λ max) were observed at 425nm for Lamivudine. Obeys the beer’s law was confirmed by the linearity of the calibration curve of Lamivudine, which is represented in fig-3. Lamivudine showed linearity in the concentration range of 5-20µg/ml. The data regarding the calibration curve are given in table-2.
The quantitative results obtained were subjected to statistical analysis to find out standard deviation and standard error values. The relative standard deviation values are given below 2% indicating the precision of the methodology and low standard error values shown the accuracy of the method.
The validation of the proposed method was further conformed by recovery studies. The recovery data is given in table 2 to 7 the percentage recovery values vary from 99 to101% for Lamivudine formulation. This serves as a good index of accuracy and reproducibility of the studies. The results obtained in repeatability test expresses the precision of the method. UV/Vis Spectrophotometric methods developed were found to be rapid, simple, precise, accurate and economic for routine estimation of Lamivudine commercial dosage forms.
OPTICAL CHARACTERISTICS, PRECISION,
ACCURACY
The optical characteristics such as absorption maxima, Beer’s law limits, molar absorptivity, regression analysis using the method of least squares was made for the slope (b), intercept (x) and correlation (r) obtained from different concentrations, percent relative standard deviation. LOD and LOQ calculated from the five measurements, 3/4thof the amount of upper Beer’s law limits in each method are presented in Tables: 1 and7 the results showed that the methods have reasonable precision. Results obtained with the visible spectrophotometric methods.
RECOVERY STUDIES
3
of the methods is confirmed by the recovery studies, by adding known amount of the pure drug to the formulation already analyzed by this method.
INTERFERENCE STUDIES
The other active ingredients and excipients present in the dosage forms of Lamivudine in did not
interfere, when added in the above concentration range to the drug and estimated by the proposed method.The methods reported here are found to be simple, sensitive, accurate, precise, and economical and can be used in the determination of Lamivudine from pharmaceutical dosage forms in a routine manner.
Table 1. DRUG PROFILE [4-7]
S.NO. CHARACTER DETAILS
1. CHEMICAL FORMULA C8H11N3O3S
2. PHYSICAL APPEARANCE It is a white to off-white crystalline powder 3. MOLECULAR WEIGHT 229.26 g/mol
4. IUPAC NAME 4-amino-1-[2-(hydroxymethyl)-1,3-oxathiolan-5-yl]-1H-pyrimidin-2-one 5. SOLUBILITY Soluble in water
6. pKa 10.2
7. MELTING POINT 186-188 o C
8. STORAGE CONDITION Stable under normal conditions. Store in air tight container at room temperature
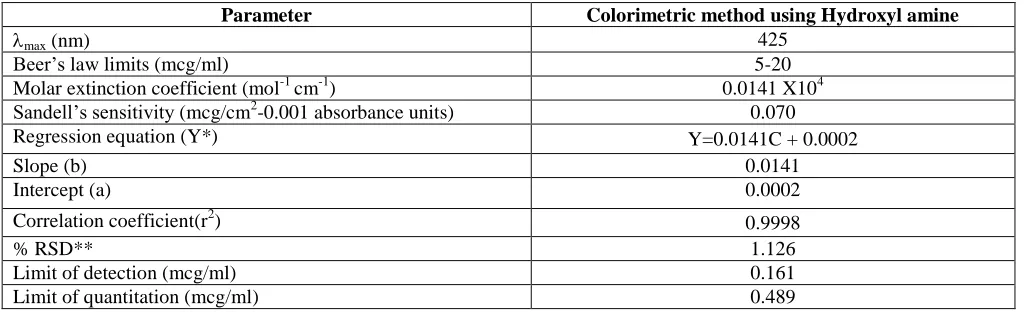
Table 2. Optimum conditions in colorimetric method using Hydroxyl amine
Parameter Colorimetric method using Hydroxyl amine
max (nm) 425
Beer’s law limits (mcg/ml) 5-20 Molar extinction coefficient (mol-1 cm-1) 0.0141 X10⁴ Sandell’s sensitivity (mcg/cm2-0.001 absorbance units) 0.070
Regression equation (Y*) Y=0.0141C + 0.0002
Slope (b) 0.0141
Intercept (a) 0.0002
Correlation coefficient(r2) 0.9998
% RSD** 1.126
Limit of detection (mcg/ml) 0.161 Limit of quantitation (mcg/ml) 0.489
*Y= bC + a where C is the concentration of Lamivudine in mcg/ml and Y is the absorbance at the respective max.
**Average of five determinations.
Table 3. Lamivudine in pharmaceutical formulations by using Hydroxyl amine
Brand used Label claimed(mg) Amount found by proposed method(mg) % label claim % RSD*
Tab-a 100 99.62 99.62 0.334 Tab-b 100 99.40 99.40 0.545 *Average of five determinations.
Table 4. recovery studies of Lamivudine
Brand used
Label claimed(mg)
Mean assay value
Known amount of Lamivudine
added Mean % recovery ±%RSD*
4
Table 5. Results of intraday precision studies of LamivudineBrand used Label claimed(mg) Amount found by proposed method(mg) % label claim % RSD*
Tab-a 100 99.58 99.58 0.334 Tab-b 100 99.34 99.34 0.745 *Average of five determinations.
Table 6. Results of inter day precision studies of Lamivudine
Brand used Label claimed(mg) Amount found by proposed method(mg) % label claim % RSD*
Tab-a 100 99.51 99.51 0.306 Tab-b 100 99.31 99.31 0.72 *Average of five determinations.
Table 7. Results of ruggedness studies of Lamivudine
Brand used Label claimed(mg) Normal condition
(Mean assay value)
Changed condition (Mean assay value) ±%RSD*
Tab-a 100 99.62 99.34±0.76 Tab-b 100 99.40 99.17±0.36 *Average of five determinations.
Table 8. Results of robustness studies of Lamivudine estimation
Brand used Label
claimed(mg)
Normal condition (Mean assay value)
Changed condition (Mean assay value) ±%RSD*
Tab-a 100 99.62 99.24±0.736 Tab-b 100 99.40 99.10±0.96 *Average of five determinations.
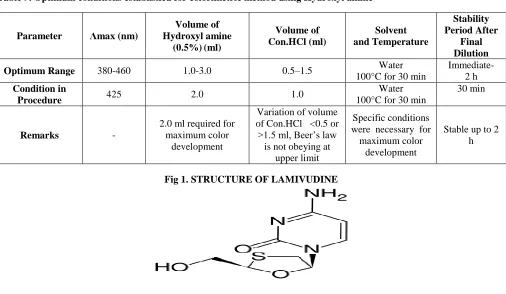
Table 9. Optimum conditions established for colorimetric method using Hydroxyl amine
Parameter Λmax (nm)
Volume of Hydroxyl amine
(0.5%)(ml)
Volume of Con.HCl (ml)
Solvent and Temperature
Stability Period After
Final Dilution
Optimum Range 380-460 1.0-3.0 0.5–1.5 Water
100°C for 30 min
Immediate- 2 h
Condition in
Procedure 425 2.0 1.0
Water 100°C for 30 min
30 min
Remarks -
2.0 ml required for maximum color
development
Variation of volume of Con.HCl <0.5 or >1.5 ml, Beer’s law
is not obeying at upper limit
Specific conditions were necessary for maximum color
development
Stable up to 2 h
5
Fig. 2. Absorption spectrum of Lamivudine with Hydroxyl amineAbsorption spectrum of Lamivudine w ith Hydroxyl amine
0 0.02 0.04 0.06 0.08 0.1 0.12 0.14 0.16
380 390 400 410 420 430 440 450 460 470 480
Wavelength(nm)
Ab
so
rb
an
ce
Fig. 3. Calibration curve of Lamivudine with Hydroxyl amine
Calibration curve or Beer's law plot of Lamivudine with Hydroxyl amine
y = 0.0141x + 0.0002 R2 = 0.9998
0 0.05 0.1 0.15 0.2 0.25 0.3
0 5 10 15 20 25
Conce ntration(mcg/ml)
A
bs
or
ba
nc
e
CONCLUSION
The proposed visible method validation for estimation of Lamivudine in bulk dosage form is carried out as per ICH and USP Guidelines. The method found to be specific for validation of estimation of Lamivudine in bulk dosage form. The method found to be linear in the specified range. Hence, this method stands validated and
can be used for routine analysis. The new procedure for the spectrophotometric determination of Lamivudine described in this work is simple, rapid and cost-effective with high accuracy and precision when compared with previously reported procedures. It could find application as a convenient technique for the in-process control of Lamivudine.
REFERENCES
1. http://en.wikipedia.org/wiki/Lamivudine
2. Day RA, Underwood AL. Quantitative analysis, 5th ed. New Delhi: Prentice- Hall India Pvt Ltd; 1986, 1-6.
3. Basett J, Denney RC, Jerrery GH, Mendham J. Vogel’s text book of quantitative inorganic analysis. 4th ed. England: Longman Group; 1986, 2.
4. Willard HH, Merrit LL (Jr), Dean JA, Settle FA (Jr). Instrumental methods of analysis. 6th ed. New Delhi: CBS Publishers and Distributors; 1986, 1-15.
5. Kirkbright GF. Development and publication of new spectrophotometric methods of analysis. Talanta, 1966, 1-14. 6. www.pubmed.com.