VOLUME 39, ARTICLE 3, PAGES 61
,
94
PUBLISHED 6 JULY 2018
http://www.demographic-research.org/Volumes/Vol39/3/ DOI: 10.4054/DemRes.2018.39.3
Research Article
Prospective versus retrospective measurement
of unwanted fertility: Strengths, weaknesses, and
inconsistencies assessed for a cohort of US
women
Heather M. Rackin
S. Philip Morgan
© 2018 Heather M. Rackin & S. Philip Morgan.
This open-access work is published under the terms of the Creative Commons Attribution 3.0 Germany (CC BY 3.0 DE), which permits use, reproduction, and distribution in any medium, provided the original author(s) and source are given credit.
1 Introduction 62
2 Existing measurement strategies 63
3 Previous studies 65
4 Data 67
5 Methods 70
6 Reliability, validity, and hypotheses 70
7 Results 75
7.1 Cross-classification of retrospective and prospective measures 75 7.2 Predictors of inconsistent reports 82
8 Conclusion 88
9 Acknowledgments 91
Prospective versus retrospective measurement of unwanted fertility:
Strengths, weaknesses, and inconsistencies assessed for
a cohort of US women
Heather M. Rackin1
S. Philip Morgan2
Abstract
BACKGROUND
Unwanted fertility is the key concept necessary to assess the potential impact of more perfect fertility control. Measuring this continues to be a significant challenge, with several plausible competing measurement strategies. Retrospective strategies ask respondents, either during pregnancy or after birth, to recall if they wanted a(nother) birth at conception; these reports are likely to be biased by an unwillingness to label a pregnancy or birth as unwanted (rationalization bias). Prospective strategies avoid this bias by questioning respondents prior to pregnancy, but reports are obtained months or years before pregnancy and so may not accurately reflect wantedness at conception. OBJECTIVE
We describe systematic errors associated with each strategy, show correspondence between strategies, and examine predictors of inconsistency.
METHODS
Using the 1979 National Longitudinal Survey of Youth, we compare retrospective and prospective reports for 6,495 births from 3,578 women.
RESULTS
The prospective strategy produces a higher percentage of unwanted births than the retrospective strategy. But the two reports of wantedness are strongly associated – especially for the second birth (vs. other births) and for women with stable (vs. unstable) expectation patterns. Nevertheless, discordant reports are common and are predicted by women’s characteristics.
CONCLUSIONS
Retrospective measures are biased by rationalization; prospective measures are biased when women change their expectations prior to conception. For practical and
theoretical reasons, we argue that retrospective measurement is more promising for assessing wantedness.
CONTRIBUTION
We highlight shortcomings in both approaches. Demographers may find ways to measure wantedness more accurately, but many of the measurement problems seem intractable.
1. Introduction
Unwanted fertility – births that occur when women preferred to have no more children – is an important demographic concept. Unwanted fertility reflects contraceptive failure or nonuse of contraception when there was a desire to have no more children. Unwanted fertility can be problematic for the woman, the child, her family, and possibly for broader society (Barber and East 2011; Brown and Eisenberg 1995; Logan et al. 2007; Rackin and Brasher 2016). Here we address issues of both the conceptualization and the measurement of unwanted fertility.
Demographers agree on the definition of unwanted fertility. In the words of Casterline and El-Zeni (2007: 731):
Pregnancies that occur at a time when a woman or a couple did not wish to have another birth are regarded as unwanted. That is, child wantedness is determined directly, and entirely, on the basis of parental fertility preferences. To be more precise, at issue are fertility preferences at the time of conception; this is the phenomenon of interest if the ultimate goal is to assess the potential impact of more perfect fertility control.
This is not to suggest that the usefulness and value of this concept have not been challenged (see Klerman 2000), but the meaning of an unwanted birth is well defined and widely shared.
weaknesses of these retrospective and prospective measurement strategies. Then we use the 1979 National Longitudinal Survey of Youth (NLSY79) to operationalize these approaches, examine the level of unwanted childbearing they produce, and show the association between the two measurement strategies. We also examine individual-level factors that attenuate or strengthen the associations between these measurements. This allows us to assess weaknesses in the retrospective and prospective measurement strategies in a cohort of US women who have recently completed their childbearing.
For the purposes of assigning individual births as wanted or unwanted, we conclude that the retrospective strategy is more appropriate conceptually and more feasible to implement. Specifically, we show that the prospective strategy is seriously flawed because fertility preferences are frequently unstable. Thus, prospective reports (even measured 18 times over the reproductive life course) do not capture fertility preferences at the time of conception. This conclusion does not remove long-standing concerns about retrospective rationalization (i.e., reporting births in the past as wanted when in fact mothers wanted no more children at the time they became pregnant).
2. Existing measurement strategies
The first method of measuring unwanted births, retrospective measurement, has substantial face validity: Women are asked to recollect their birth wantedness when they became pregnant. A child is considered unwanted if the woman reports that, at conception, she wanted no more children. It is widely suspected that these reports are biased because of hesitancy to report a child as unwanted. This reluctance could be because women do not want to label a child as unwanted or because they are reluctant to confess contraceptive failure/nonuse. Also, if the birth occurred years ago, women may not be able to recall their state of mind at the time. Thus, they may give an answer that fits a personal or normative narrative – most likely one that underestimates unwanted births. We refer to this set of biases as retrospective rationalization and expect that they will reduce the estimated levels of unwanted fertility (compared to the true level of births unwanted at conception).
number that is less than their current number of living children.3 Also, this operationalization does not capture the concept of fertility preferences at the time of conception, which links unwanted fertility to the potential impact of more perfect fertility control.
A third option is to prospectively measure unwanted fertility. Women are asked their intentions for future births. If a woman intends no additional births in year t but subsequently has a birth in year t + x, then this birth is considered unwanted. As a number of researchers have pointed out, prospective intentions are strongly predictive of fertility and there is no expectation that women consistently over-/underreport their intentions regarding future births. Bongaarts (1990: 494) referred to the desire for additional children “as the least biased of the standard preference measures” and Casterline and El-Zeni (2007: 733) go so far as to say that prospective measurement “might well be the method of choice” if appropriate longitudinal data is available. As we will discuss, this approach assumes that intentions are stable (i.e., that women rarely change their fertility intentions). However, if a woman intends no more births at time t but changes her intention before becoming pregnant, then this approach would incorrectly label the birth at time t + x as unwanted (and thus inflate estimates of unwanted births).
Another issue for these measurement strategies is that they presuppose that women have intentions that are held with considerable force. Both suppositions are increasingly challenged. First, women may respond to survey questions regarding fertility intentions based on general notions of an ideal family size, often ones that reflect widespread norms. But these women may not have formed intentions (Bachrach and Morgan 2013; Rackin and Bachrach 2016). Moreover, women may be ambivalent, not because they have neglected to think about whether to have a child, but because the reasons for wanting/not wanting a child are relatively balanced or depend upon how those reasons are weighted at a given moment. These arguments suggest considerable measurement unreliability.
The Casterline and El-Zeni (2007) proposal for measurement, like Bongaarts’s (1990) strategy, attempts to assess prospective intentions vis-à-vis births in a particular period at the aggregate level. These clever strategies rely upon aggregated intentions to have more children and an assumption that ‘stopping’ intentions are stable within the estimation period (or that instability is random and offsetting). In other words, these approaches work well as long as births to those who changed intentions and wanted more (nCy, wanted births to those who changed intentions from no⇓yes) are offset by births to those who changed their minds and wanted none but had one (births to those who changed yes⇓ no, yCn). For this to be a serious concern there would need to be a
large disparity in these births (i.e, nCy ≠ yCn). We are not aware of evidence on the relative frequency of such births, but a case for imbalance could be made.4
Also, there is a sizeable literature on the measurement of unwanted fertility at the individual level. Individual-level measurement allows one to ask important questions: Which women are most likely to have an unwanted birth? What is the impact of an unwanted birth on the mother’s life, family welfare, or child development? Studies of these topics have almost always relied on the first method, retrospective measurement. Again, these reports are widely suspected of serious retrospective rationalization.
Here we identify those with stable fertility expectations, defined – as Bongaarts (1990) defines them – as those whose array of expectations shows a single “stopping point.” We refer to such a pattern as stable. We examine several expectations that follow from this fundamental assumption in the prospective strategy (i.e., that fertility intentions are stable over time). More precisely, using a remarkable resource on fertility preferences available in the NLSY79, we compare aggregate estimates and individual assignments of birth wantedness using retrospective (the first method discussed above) and prospective (the third method discussed) measures. We also estimate associations between prospective and retrospective measures for subgroups of women (by parity and by stability in arrays of expectations), and assess the individual-level predictors of discrepant assignments.
3. Previous studies
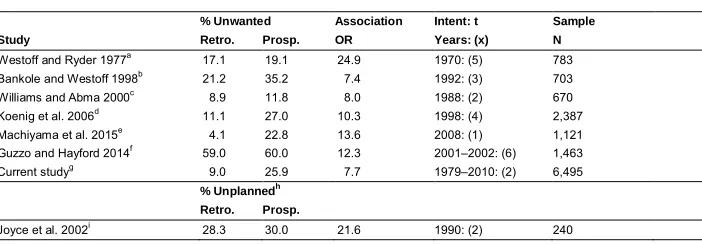
Table 1 shows the small set of longitudinal studies that allows assignment of wantedness using prospective and retrospective strategies. All of these studies cross-classify the reports from these two strategies, allowing comparisons of marginal frequencies (the proportion reporting a birth as unwanted using each strategy) and the association between the two measures. Westoff and Ryder (1977: Table 5) were the first to compare retrospective and prospective reports of unwanted births. Their estimate of the percentage of births unwanted for retrospective (17%) and prospective measurements (19%) are quite close. Net of these marginal differences, the odds ratio, 24.9, provides an estimate of the association between these two reports. To interpret, if a birth is categorized by one of these approaches as unwanted, then that birth was 24.9 times more likely to be coded as unwanted (as opposed to wanted) using the other
4 Both nCy and yCn are the product of the number of women in the category and the probability that the
approach. These results suggest trivial biases, because the estimates of unwanted births differ by only 2% and the association between reports is strong. However, these estimates come from births in the 1970–1975 period (the period of retrospective recall was five years or less) and from a homogeneous sample of stably married white women.
Table 1: Studies measuring retrospective and prospective wantedness of births
% Unwanted Association Intent: t Sample
Study Retro. Prosp. OR Years: (x) N
Westoff and Ryder 1977a 17.1 19.1 24.9 1970: (5) 783 Bankole and Westoff 1998b 21.2 35.2 7.4 1992: (3) 703
Williams and Abma 2000c 8.9 11.8 8.0 1988: (2) 670
Koenig et al. 2006d 11.1 27.0 10.3 1998: (4) 2,387
Machiyama et al. 2015e 4.1 22.8 13.6 2008: (1) 1,121 Guzzo and Hayford 2014f 59.0 60.0 12.3 2001–2002: (6) 1,463
Current studyg 9.0 25.9 7.7 1979–2010: (2) 6,495
% Unplannedh Retro. Prosp.
Joyce et al. 2002i 28.3 30.0 21.6 1990: (2) 240
Notes:
aSubset of 1970 National Fertility Survey (NFS) respondents: white women in intact first marriages of less than 20 years’ duration and married by age 25. See Westoff and Ryder 1977: 731–732.
bOriginally interviewed in 1992 Morocco Demographic Health Survey (DHS) and still living in selected sampling cluster. Women who were married to the same person in 1992 and 1995.
cOriginally interviewed in 1998 National Survey of Family Growth (NSFG) and reinterviewed by telephone approximately two years later.
dFrom four Indian states. Data from women originally interviewed in 1998–1999 in the National Family Health Survey (NFHS) survey. Follow-up in 2002–2003.
eThe sampling frame was the Demographic Surveillance Site (DSS) in the Karonga district of northern Malawi. Data is a subset of married women.
fThe prospective report is for first births born to women age 18–24 in wave III of the National Longitudinal Study of Adolescent to Adult Health (Add Health). The retrospective report is for the same births when women were age 25–32 in wave IV.
gSee text for description.
hUnplanned combines mistimed and unwanted births.
IThe prospective report is only for women pregnant at the 1990 interview of the National Longitudinal Survey of Youth 1979 (NLSY79). These women were asked for retrospective reports for these same pregnancies/births in the 1992 wave.
between reports is also strong (OR = 8.0). Koenig et al. (2006) show results from four Indian states. Their data reveals sharp differences in estimated levels (11.1% and 27.0% for retrospective and prospective reports) but, net of these large marginal differences, shows a strong association (OR = 10.3) between reports. Machiyama et al. (2015) use data from married women in northern Malawi and this has the largest differential, 4.1% and 22.8%, between retrospective and prospective reports, but there is still a strong association between reports (OR = 13.6).
Two other studies examine retrospective reports of the same pregnancy/birth at two different time points. Joyce, Kaestner, and Korenman (2002) use a sample of 240 women who were pregnant at the 1990 interview in the NLSY79 and were asked if these pregnancies were unplanned (which includes mistimed and unwanted births). In the next wave of data collection (1992), they were asked the same question retrospectively after the child was born. Prospective estimates of unplanned births are slightly higher and the association across waves is quite strong (OR = 21.6). Guzzo and Hayford (2014) explore if reports of wanted and unwanted first births among women age 18–24 had changed by the time women were age 25–32. Levels of unwanted births are similar over time (at about 60%) and the association between the measures is high (OR = 12.25). Unlike Joyce et al.’s (2002) finding that in later time periods women are more likely to change their report from unplanned to planned, Guzzo and Hayford (2014) find that women are more likely to change their reports from wanted to unwanted.
While we have not yet described our data, procedure, and measurements, our study shows a substantial difference in retrospective and prospective measurements of wantedness (9.0% vs. 25.9% unwanted) and a level of association in line with prior studies (OR = 7.7).
4. Data
biennially until the end of women’s reproductive life courses. We use data on fertility expectations (asked 18 times over 31 years) from women age 14–22 until age 45–53.
The initial NLSY79 sample included 6,292 women, but several subsamples were dropped in 1990 or before. In 2010, 4,737 female respondents were available for reinterview (75% of the original sample). We follow these women until they are lost to follow-up and, on average, women in our sample contributed 16 waves of data collection. Women in our sample (those with at least one child) had an average of 2.46 births, but women contributed only 1.82 births to the sample analyzed because children born before 1982 were excluded (we could not assess expectation patterns without at least two waves of expectation data – expectation patterns will be described below5). In total, we have information on prospective and retrospective reports for 6,495 births from 3,578 women.
Retrospective reports of planning status of births were measured using standard questions: “Just before you became pregnant the (first, second, etc.) time, did you want to become pregnant when you did?” Offered responses included “yes,” indicating a wanted birth; “it didn’t matter,” suggesting ambivalence; “no, not at that time,” was coded as mistimed; and “no, none/no more at all,” was coded as unwanted. We focus on three contrasts: wanted (including ambivalence); mistimed; and unwanted. Ambivalent responses (5% of all births) were combined with wanted because there were too few for separate analysis.
Prospective wantedness was measured based on expectations for children. Women were asked: “Altogether, how many (more) children do you expect to have?” If they reported expecting one or more children in the survey wave prior to the pregnancy, then that birth was classified as prospectively wanted. If they responded that they were not expecting more births in the survey wave prior to the pregnancy, then that birth was classified as prospectively unwanted.6
Note that the NLSY79 asks about prospective ‘expectations’ when ‘intentions’ would have been the preferred term. Because expectations were the only prospective measurement asked throughout the reproductive life course, we use these reports to classify births as prospectively wanted or unwanted. We maintain, however, that there is a very strong empirical overlap between reports of expectations and intentions – a claim supported by empirical evidence (see Morgan 2001; Ryder and Westoff 1965).
5 To briefly summarize expectation patterns (see Table 2 for examples), if mothers’ prospective fertility
expectations ever changed from not expecting another birth to expecting another birth at any time prior to a pregnancy, then births that followed this change were labeled as occurring to mothers with unstable expectation patterns. Otherwise the expectation pattern was defined as stable. Thus, we need at least two waves of expectations for an expectation pattern to emerge.
6 If women were pregnant at the time of the interview, then by definition the NLSY79 classified them as
There are few respondents who intend to have more children but do not expect them (perhaps due to limited fecundity) or expect them but do not intend to have them (possibly anticipating an unwanted birth). Both of these cases could contribute to discordant responses (vis-à-vis the retrospective measurements). To make this measurement weakness visible throughout, we will refer to the NLSY79 measurement as expectations (as opposed to intentions) and use these expectations to code births as prospectively wanted or unwanted.
We also examined if individual-level variables predicted inconsistent responses (e.g., a retrospective wanted report and prospective unwanted report). Demographic variables were race (black, Hispanic, and white) and age at the birth (<22, 22–24, 25–29, 30–34, and 35 or older). Education was measured at the retrospective report and included less than high school, high school, some college, and college or more. Being enrolled in school was measured at the retrospective report (0 = not enrolled, 1 = enrolled).
Because life changes might alter reports of prospective expectations and retrospective wantedness, we included indicators of change between the prospective and retrospective waves on three variables: marital status, poverty status, and employment status. Marital status changes were grouped as stably married (married in both waves), stably unmarried, got divorced, and got married. For poverty status, we examined if respondents’ household income was above or below the poverty line at both waves and categories included: stably below the poverty line, stably not in poverty, transitioned into poverty, and transitioned out of poverty. Employment status change included being stably unemployed, stably employed, getting a job, and losing or quitting a job.
Finally, inconsistent retrospective and prospective reports might be more likely if there was more time between the prospective report and conception. Thus, we also included a measure of the time between the prospective report and the child’s birth. We compared the month and year of the interview to children’s birthdates. On average, prospective expectations were measured 1.8 years prior to birth (or slightly more than one year before conception, and the vast majority were observed less than two years prior to conception).
We used multiple imputation for missing data7 but did not impute prospective or retrospective reports. Results presented here are not altered if we use listwise deletion.
7For the 6,495 observations, missing data was 1% or less for education, enrollment, and employment status
5. Methods
First, we examine cross-classifications of births by retrospective and prospective assignments of wantedness and compare aggregate estimates of retrospective and prospective unwanted fertility. We assess the strength of the association by examining the odds of a prospectively unwanted birth being retrospectively classified as wanted, mistimed, or unwanted, and examine the odds ratio of a prospectively unwanted birth being retrospectively classified as unwanted compared to wanted, mistimed, and wanted plus mistimed. We then analyze subsets of births: by birth order (first, second, or third or more); by expectation pattern (stable or unstable); and by both expectation pattern and birth order.
Next, we use multinomial regression to examine the contrasts produced by these cross-classifications.8 The dependent variable is the set of categories in the prospective by retrospective cross-classification (e.g., retrospectively wanted and prospectively unwanted). Independent variables are those discussed above.
6. Reliability, validity, and hypotheses
Our initial analysis tool is the cross-classification of retrospective and prospective reports. These reports produce the table structure shown in Figure 1a: rWpW indicates the observed frequency in the first row and first column for births retrospectively wanted and prospectively wanted; rW indicates the sum of the first row, etc.
Figure 1b depicts perfect association (or complete agreement) of these two measures: All prospectively unwanted births are also reported retrospectively as unwanted and all prospectively wanted births would be reported retrospectively as either wanted or mistimed. We will use this perfect association as one referent. Departures from this referent could be due to measurement unreliability. Ambivalence at pregnancy or not having formed an expectation could produce unreliable reports. Such unreliability would weaken the association between prospective and retrospective reports but would not create a disparity in aggregate estimates of unwanted births.
8In the regression, we grouped all birth orders together because of small cell sizes for certain groups, but we
Figure 1: Templates for the cross-classification of retrospective and prospective measures
a) Basic data structure
Prospective
Retrospective Wanted Unwanted
Wanted rWpW rWpU rW
Mistimed rMpW rMpU rM
Unwanted rUpW rUpU rU
pW pU
b) Perfect association/agreement
Prospective
Retrospective Wanted Unwanted
Wanted rWpW 0
Mistimed rMpW 0
Unwanted 0 rUpU
c) Disjunctures associated with retrospective rationalization: Bias in retrospective report Prospective
Retrospective Wanted Unwanted
Wanted - +
Mistimed - +
Unwanted +
-Retrospective rationalization (1) claims wanted or mistimed but at conception unwanted Retrospective rationalization (2) claims unwanted but at conception wanted or mistimed
Note: Darker gray shading indicates more common bias and arrows show flow of respondents.
d) Disjunctures associated with changing intentions: Bias in prospective report Prospective
Retrospective Wanted Unwanted
Wanted - +
Mistimed
Unwanted +
-Change expectations (1) from no more to want more (and had more) Change expectations (2) from want more to want no more (but had one)
Note: Darker gray shading indicates more common bias and arrows show flow of respondents.
e) Common biases working against perfect agreement
Prospective
Retrospective Wanted Unwanted
Wanted - + +
Mistimed +
Unwanted
retrospective rationalization. In this scenario, we assume the prospective report is correct in so far as it reflects expectations at conception. This figure explicitly shows that there are two types of retrospective rationalization. The first is likely to be more common and has been discussed frequently in the literature. This rationalization occurs when the respondent reports retrospectively (at the time of the survey) that a pregnancy was mistimed or wanted when, at the time of conception, the respondent really wanted to cease childbearing. According to our definition of unwanted as “at the time of conception,” this birth is unwanted and this first type of retrospective bias moves the template away from perfect association by shifting respondents from the retrospective unwanted prospective unwanted cell to the retrospective wanted prospective unwanted and retrospective mistimed prospective unwanted cell. The red arrows in Figure 1c show how this subtype of retrospective rationalization bias would change the frequencies in cells relative to perfect association and the darker shading shows that this is likely to be the more common type of rationalization bias. If this type of rationalization is dominant, then it would lead to many discordant responses and produce a substantial aggregate underestimate of unwanted fertility (i.e., a lower estimate of unwanted fertility using the retrospective measure compared to the prospective one).
The second subtype of retrospective rationalization occurs if women claim in the retrospective report that a child was unwanted when at conception it was actually wanted. This type of rationalization could occur if, for example, a woman in a union wanted a child but the union was dissolved before the birth. This woman might regret the pregnancy/birth and report it as unwanted. While possible, this type of rationalization is likely to be rare and has been of little concern in prior work. It would be reflected in shifts from retrospective wanted prospective wanted (rWpW) and retrospective mistimed prospective wanted (rMpW) to retrospective unwanted prospective wanted (rUpW) (as shown by the purple arrows in Figure 1c). Note that if the two subtypes of rationalization produced an equal number of response disjunctures they would cancel out one another in the table marginals (i.e., aggregate estimates would not be biased).
change their expectation from yes to no and then subsequently have an (unwanted) birth. The prospective strategy would incorrectly assign this birth a wanted status (i.e., relative to perfect agreement in Figure 1b, this bias in the prospective report reduces the number of respondents in the rUpU cell and increases those in the rUpW cell – shown by the blue arrows in Figure 1d). Again, there are strong theoretical reasons to believe that these two biases are not equal and that the first is more common. A shift to wanting children should increase the likelihood of acting to realize this expectation, but shifting to a no response should increase antenatalist behavior. As before, if these errors do not balance, then the prospective measure is also invalid at the aggregate level.
The two dominant biases combine to produce the template in Figure 1e. Importantly, both dominant biases have the same effect: increasing the frequency in the retrospective wanted prospective unwanted cell (rWpU). These combined biases could lead to substantial marginal differences, with the proportion of unwanted births greater when using the prospective as opposed to the retrospective strategy. Indeed, this feature is present in all studies in Table 1.
Given that the expected common biases produce the same response pattern in the cross-classification, we sought ways to distinguish respondents who were the most and least likely to have changed their minds prior to a conception. If we can reduce this source of error, then the two measurement strategies should be more closely aligned and much of the remaining error would most likely be due to rationalization. Specifically, we examined the array of prospective fertility expectations prior to each birth. If mothers’ prospective fertility expectations changed from not expecting another birth to expecting another birth at any time prior to a pregnancy, then any births that followed this change were labeled as occurring to mothers with unstable expectation patterns. If a mother changed her prospective expectations from no to yes at any point before a pregnancy (i.e., had unstable expectation patterns), then we reasoned that she would have been more likely to change her expectations between the wave prior to the pregnancy and the time of conception. In contrast, if a mother never shifted her expectations from no to yes prior to a pregnancy, then we reasoned that she would have been less likely to change her expectations; these patterns were labeled as stable.
refer to births that occurred when mothers never changed their expectations from no to yes prior to that birth and imply a stopping point.
Concretely, Table 2 shows two hypothetical women (scenarios 1 and 2) and their retrospective and prospective reports. The first scenario shows a woman who wanted additional births from age 18–26. She had three births, the first two both retrospectively and prospectively wanted; the third birth, however, was prospectively unwanted because in the survey wave prior to the birth she stated that she wanted no more births. Nevertheless, this woman retrospectively reported this birth as wanted. This discordance could be due to retrospective rationalization or the woman could have simply changed her mind between the survey (administered at age 30) and becoming pregnant (by age 32).
Table 2: Hypothetical lifelines showing fertility expectations for women in the NLSY79
Age of woman
18 20 22 24 26 28 30 32 34 36 38 40 … Scenario
1 Expectation Y Y Y Y Y N N N N N N N …
Births/Prosp. W W U
Births/Retro. W W W
2 Expectation Y Y Y Y Y N N N N Y Y N …
Births/Prosp. W W U W
Births/Retro. W W U U
Table 2 also highlights examples of stable and unstable expectation patterns. The first row in each scenario shows expectations for additional births and cells shaded in gray show that when these hypothetical women said yes they expected more births. In scenario 1, this woman had stable prospective reports prior to all of her births – she consistently stated that she expected more children until age 26 and then consistently stated that she expected no more births after this. In the second scenario, the woman had a stable pattern prior to her first three births, because she had a single stopping point until age 34; after this, however, her reporting pattern was unstable because she switched from not expecting more births to expecting more (i.e., no to yes). Thus, her fourth birth would be classified as occurring when she had an unstable expectation pattern, while her first three births would be classified as occurring when she had a stable pattern.
are idiosyncratic or without much commitment (indicated by temporal instability). Such variability may not be especially problematic for aggregate estimates since it could be largely random unreliability (and thus produce no consistent bias), but it would reduce the association between prospective and retrospective measurements. If our logic is correct we will find a stronger association between prospective and retrospective reports for stable rather than unstable patterns.
There are pieces of evidence that would challenge the validity of the prospective strategy. Because the prospective strategy hinges on the assumption that fertility expectations are stable, its validity would be challenged if a substantial proportion of women do not have stable expectation patterns. Also, the differential between prospective and retrospective measures of wantedness can give an indication of the validity of the prospective strategy. If women who are the most likely to have changed their minds prior to a birth (i.e., unstable arrays) have larger gaps between prospective and retrospective aggregate measures of unwanted fertility than women who are the least likely to have changed expectations (i.e., stable arrays), then this would suggest that changing expectations presents an important bias in the prospective measure at both the aggregate and the individual level.
Regarding validity of the retrospective strategy, retrospective rationalization would be shown by differences in retrospective and prospective estimates of unwanted fertility for women who are the least likely to have changed intentions (i.e., stable expectation arrays). Assuming that women with stable expectation patterns were less likely to change their minds, then disjunctures between the measurements among women with stable patterns are more likely to reflect retrospective rationalization because bias from changing expectations would be lessened.
We go further, though, to explore the validity of the retrospective strategy and examine if bias is systematically related to the attributes of women. We expect that women who are deeply entrenched in the role of mother because of their time in this role (higher-parity, older, married mothers) would be the most likely to retrospectively rationalize an unwanted birth as wanted.
7. Results
7.1 Cross-classification of retrospective and prospective measures
result is consistent with the belief that substantial numbers of unwanted births are subsequently rationalized as wanted. But it is also consistent with a substantial proportion of women changing their minds and deciding that they want another child and subsequently becoming pregnant.
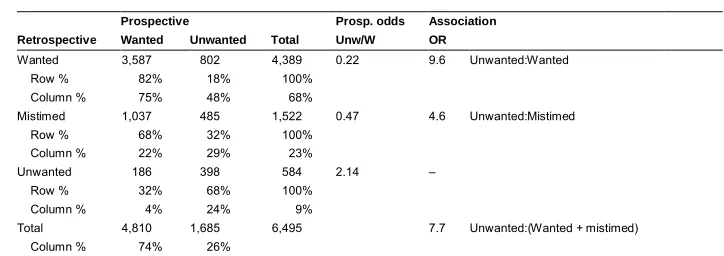
Table 3: Cross-classification of retrospective and prospective measures
Prospective Prosp. odds Association Retrospective Wanted Unwanted Total Unw/W OR
Wanted 3,587% 802% 4,389% 0.22 9.6 Unwanted:Wanted
Row % 82% 18% 100%
Column % 75% 48% 68%
Mistimed 1,037% 485% 1,522% 0.47 4.6 Unwanted:Mistimed
Row % 68% 32% 100%
Column % 22% 29% 23%
Unwanted 186% 398% 584% 2.14 –
Row % 32% 68% 100%
Column % 4% 24% 9%
Total 4,810% 1,685% 6,495% 7.7 Unwanted:(Wanted + mistimed) Column % 74% 26%
The right-hand columns of Table 3 show that the odds of a prospective report of unwanted (vs. wanted) increases sharply if the retrospective report is unwanted (as opposed to wanted or mistimed: i.e., the odds increase from 0.22 to 2.14), by a factor of 9.6 (2.14/0.22) compared to a retrospective wanted report. If we combine wanted and mistimed births to contrast with unwanted (as in Table 1), then a retrospective report of unwanted increases the odds of a parallel prospective report by a factor of 7.7. This strong association occurs despite the observed disjunctures (e.g., less than a quarter of prospectively unwanted births, 24%, are reported as unwanted retrospectively).
In sum, Table 3 shows a strong association between the two measurements of unwanted – a finding consistent with the claim that they are measuring a similar concept (i.e., an unwanted birth), albeit a retrospective report with a substantial bias (retrospective rationalization) and a prospective report that may not accurately reflect intentions at the time of conception. Retrospective rationalization and changed expectations together produce substantial disjunctures: only 24% of prospectively unwanted births are also reported as retrospectively unwanted, while nearly 48% of prospectively unwanted births are retrospectively reported as wanted. The fact that retrospectively reported mistimed births are more frequently prospectively unwanted (vs. wanted) cautions that respondents may not clearly separate timing and number considerations.
guaranteed by the large number of respondents who expect at least one or two children and the widespread expectation of eventually ceasing childbearing. Indeed, for both strategies, the percentage of unwanted births increases with birth order; these percentages, calculated from Table 4, show that percentages are closest for first births (4% for retrospective and 8% for prospective), and the estimates increase more dramatically for the prospective strategy. For second births 6% and 18% are identified as unwanted and for third- and higher-order births 18% and 58% are identified as unwanted using the retrospective and prospective strategies respectively.
Table 4: Cross-classification of retrospective and prospective measures, by birth order
Prospective Prosp. odds Association Birth
order Retrospective Wanted Unwanted Total Unw/W OR
1 Wanted 1,626% 111% 1,737% 0.07 6.0 Unwanted:Wanted
Row % 94% 6% 100%
Column % 77% 63% 76%
Mistimed 435% 40% 475% 0.09 4.5 Unwanted:Mistimed
Row % 92% 8% 100%
Column % 20% 23% 21%
Unwanted 61% 25% 86% 0.41 –
Row % 71% 29% 100%
Column % 3% 14% 4%
Total 2,122% 176% 2,298% 5.6 Unwanted:(Wanted + mistimed)
Column % 92% 8%
2 Wanted 1,469% 203% 1,672% 0.14 10.9 Unwanted:Wanted
Row % 88% 12% 100%
Column % 77% 48% 72%
Mistimed 375% 129% 504% 0.34 4.4 Unwanted:Mistimed
Row % 74% 26% 100%
Column % 20% 31% 22%
Unwanted 59% 89% 148% 1.51 –
Row % 40% 60% 100%
Column % 3% 21% 6%
Total 1,903% 421% 2,324% 8.4 Unwanted:(Wanted + mistimed) Column % 82% 18%
3+ Wanted 492% 488% 980% 0.99 4.3 Unwanted:Wanted
Row % 50% 50% 100%
Column % 63% 45% 52%
Mistimed 227% 316% 543% 1.39 3.1 Unwanted:Mistimed
Row % 42% 58% 100%
Column % 29% 29% 29%
Unwanted 66% 284% 350% 4.30 –
Row % 19% 81% 100%
Column % 8% 26% 19%
The association between retrospective and prospective reports is quite high for the first two birth orders (OR = 5.6 for birth 1 and 8.4 for birth 2). But the association is weaker (OR = 3.8) for third- and higher-order births. Again, even with the disjunctures in Table 4, this association between the reports is consistent with claims that these two measurement strategies are tapping into the same concept, but that the biases for third-and higher-order births are magnified.
We also sought a way to distinguish subgroups that might have been less likely to change their minds in order to disentangle changing expectations from retrospective rationalization. We hypothesized that the stability of expectation patterns prior to each birth was a way to distinguish births that occurred when mothers were more and less likely to have changed their minds. Note, as detailed below, that it is possible that the same mother could have had earlier births that occurred when she had a stable expectation pattern and later births when she had an unstable expectation pattern, because we classified expectation patterns by looking at changes in expectations that occurred prior to each birth.
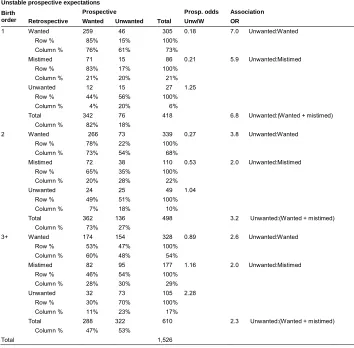
An initial observation from Table 5 is that about a quarter of births are to mothers who had unstable expectation patterns prior to that birth (1,526/6,495). Other results (available on request) also show that the proportion of women in our sample with stable and unstable patterns over their full reproductive life course is 66% and 34% respectively. Clearly the behavioral model that underpins the prospective strategy, with a single stopping point, is not a dominant one for this cohort.
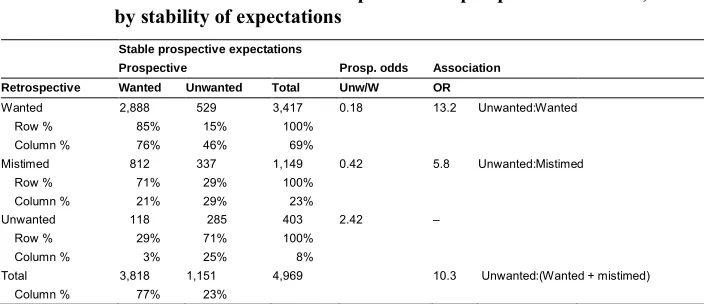
Table 5: Cross-classification of retrospective and prospective measures, by stability of expectations
Stable prospective expectations
Prospective Prosp. odds Association Retrospective Wanted Unwanted Total Unw/W OR
Wanted 2,888% 529% 3,417% 0.18 13.2 Unwanted:Wanted
Row % 85% 15% 100%
Column % 76% 46% 69%
Mistimed 812% 337% 1,149% 0.42 5.8 Unwanted:Mistimed
Row % 71% 29% 100%
Column % 21% 29% 23%
Unwanted 118% 285 403% 2.42 –
Row % 29% 71% 100%
Column % 3% 25% 8%
Total 3,818% 1,151% 4,969% 10.3 Unwanted:(Wanted + mistimed)
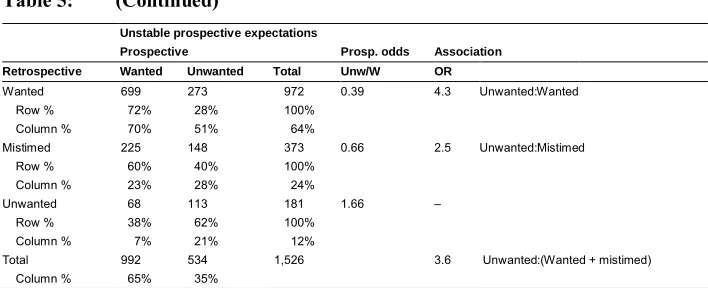
Table 5: (Continued)
Unstable prospective expectations
Prospective Prosp. odds Association Retrospective Wanted Unwanted Total Unw/W OR
Wanted 699% 273% 972% 0.39 4.3 Unwanted:Wanted
Row % 72% 28% 100%
Column % 70% 51% 64%
Mistimed 225% 148% 373% 0.66 2.5 Unwanted:Mistimed
Row % 60% 40% 100%
Column % 23% 28% 24%
Unwanted 68% 113% 181% 1.66 –
Row % 38% 62% 100%
Column % 7% 21% 12%
Total 992% 534% 1,526% 3.6 Unwanted:(Wanted + mistimed) Column % 65% 35%
Stability of women’s expectations prior to a birth produced the results we expected: Women who had stable expectation arrays had a closer correspondence in aggregate levels of unwanted fertility and a stronger association between measures compared to women with unstable expectation arrays. Table 5 shows that the difference between aggregate estimates of unwanted fertility using the prospective and retrospective measure was 15 percentage points for those with stable expectation patterns (23%–8%) and 23 percentage points (35%–12%) for those with unstable patterns. Also, as posited, the association between the measures was much higher for those with stable patterns (OR = 10.3 vs. OR = 3.6), suggesting that those with stable expectation patterns had less bias from changing their minds. Women with stable patterns most likely had a clearer fertility target and so missing this target would have been more evident. This also suggests that retrospective rationalization is a concern, because, even among those least likely to have changed their expectations, only a quarter of births classified as prospectively unwanted were retrospectively reported as unwanted.
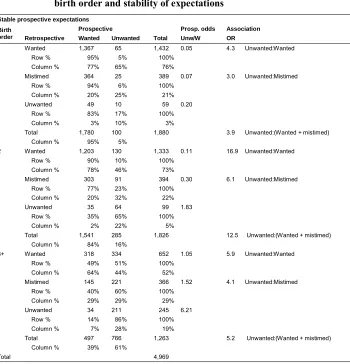
Table 6: Cross-classification of retrospective and prospective measures: By birth order and stability of expectations
Stable prospective expectations Birth
order
Prospective Prosp. odds Association Retrospective Wanted Unwanted Total Unw/W OR
1 Wanted 1,367% 65% 1,432% 0.05 4.3 Unwanted:Wanted
Row % 95% 5% 100%
Column % 77% 65% 76%
Mistimed 364% 25% 389% 0.07 3.0 Unwanted:Mistimed
Row % 94% 6% 100%
Column % 20% 25% 21%
Unwanted 49% 10% 59% 0.20
Row % 83% 17% 100%
Column % 3% 10% 3%
Total 1,780% 100% 1,880% 3.9 Unwanted:(Wanted + mistimed) Column % 95% 5%
2 Wanted 1,203% 130% 1,333% 0.11 16.9 Unwanted:Wanted
Row % 90% 10% 100%
Column % 78% 46% 73%
Mistimed 303% 91% 394% 0.30 6.1 Unwanted:Mistimed
Row % 77% 23% 100%
Column % 20% 32% 22%
Unwanted 35% 64% 99% 1.83
Row % 35% 65% 100%
Column % 2% 22% 5%
Total 1,541% 285% 1,826% 12.5 Unwanted:(Wanted + mistimed) Column % 84% 16%
3+ Wanted 318% 334% 652% 1.05 5.9 Unwanted:Wanted
Row % 49% 51% 100%
Column % 64% 44% 52%
Mistimed 145% 221% 366% 1.52 4.1 Unwanted:Mistimed
Row % 40% 60% 100%
Column % 29% 29% 29%
Unwanted 34% 211% 245% 6.21
Row % 14% 86% 100%
Column % 7% 28% 19%
Total 497% 766% 1,263% 5.2 Unwanted:(Wanted + mistimed) Column % 39% 61%
Table 6: (Continued)
Unstable prospective expectations Birth
order
Prospective Prosp. odds Association Retrospective Wanted Unwanted Total Unw/W OR
1 Wanted 259% 46% 305% 0.18 7.0 Unwanted:Wanted
Row % 85% 15% 100%
Column % 76% 61% 73%
Mistimed 71% 15% 86% 0.21 5.9 Unwanted:Mistimed
Row % 83% 17% 100%
Column % 21% 20% 21%
Unwanted 12% 15% 27% 1.25
Row % 44% 56% 100%
Column % 4% 20% 6%
Total 342% 76% 418% 6.8 Unwanted:(Wanted + mistimed) Column % 82% 18%
2 Wanted 266 73% 339% 0.27 3.8 Unwanted:Wanted
Row % 78% 22% 100%
Column % 73% 54% 68%
Mistimed 72% 38% 110% 0.53 2.0 Unwanted:Mistimed
Row % 65% 35% 100%
Column % 20% 28% 22%
Unwanted 24% 25% 49% 1.04
Row % 49% 51% 100%
Column % 7% 18% 10%
Total 362% 136% 498% 3.2 Unwanted:(Wanted + mistimed) Column % 73% 27%
3+ Wanted 174% 154% 328% 0.89 2.6 Unwanted:Wanted
Row % 53% 47% 100%
Column % 60% 48% 54%
Mistimed 82% 95% 177% 1.16 2.0 Unwanted:Mistimed
Row % 46% 54% 100%
Column % 28% 30% 29%
Unwanted 32% 73% 105% 2.28
Row % 30% 70% 100%
Column % 11% 23% 17%
Total 288% 322% 610% 2.3 Unwanted:(Wanted + mistimed) Column % 47% 53%
Total 1,526%
We also predicted that the stable group would show stronger associations between retrospective and prospective reports because respondents with stable arrays would be more likely to have had a fertility target and it would be clearer when they exceeded this target. The association between reports is stronger in the case of stable expectation arrays at the second or higher parity. This difference seems strongest at the second birth (OR = 12.5 for stable, OR = 3.2 for unstable). At the first birth, however, the association between reports appears weaker for women with stable expectation patterns compared to those with unstable patterns (OR = 3.9 for stable, OR = 6.8 for unstable). Among women who had stable expectations prior to their first birth (i.e., prospectively expected no children), only 10% reported these prospectively unwanted births as unwanted; in addition, among births that were retrospectively reported as unwanted 83% were prospectively wanted. These disjunctures are quite large and may be responsible for the low correspondence between the measures among this group. Regardless, for those who are the least likely to change their minds (i.e., have stable expectation arrays), ambivalence seems very unlikely at the second parity, yet for women the most likely to change their minds (i.e., unstable arrays) ambivalence seems to become more apparent at the second and higher parity.
Even though we cannot prove that retrospective rationalization occurs, the circumstantial evidence suggests that it does. Note that among mothers who are least likely to change expectations between waves (i.e., had stable expectation arrays), the vast majority who had prospectively unwanted births did not retrospectively report them as unwanted. While we acknowledge that this could arise from genuine ambivalence regarding an additional birth or because some women change their minds even within the groups least likely to do so, it is likely that much of the discordance stems from a reluctance to report a birth that was unwanted at conception as unwanted retrospectively.
7.2 Predictors of inconsistent reports
Table 7: Predicting inconsistent retrospective and prospective reports (vs. rWpW)
rUpU rWpU rUpW rMpU rMpW
Variables RRR RRR RRR RRR RRR
Age at birth (vs. 25–29)
<22 0.75 0.67† 2.28** 1.04 1.92***
(0.24) (0.16) (0.64) (0.27) (0.29)
22–24 0.82 0.76† 1.07 0.97 1.41***
(0.16) (0.11) (0.25) (0.17) (0.14)
30–34 1.31† 1.38** 0.87 1.10 0.61***
(0.20) (0.16) (0.18) (0.16) (0.07)
35+ 3.28*** 2.97*** 0.65 2.61*** 0.34***
(0.61) (0.41) (0.23) (0.45) (0.07)
Parity (vs. first)
Second 3.88*** 1.89*** 1.31 3.58*** 1.17†
(0.92) (0.24) (0.25) (0.66) (0.10)
Third+ 34.93*** 11.28*** 5.05*** 25.41*** 2.57***
(8.45) (1.57) (1.08) (4.79) (0.29)
Race (vs. white)
Black 3.35*** 1.57** 1.95** 2.59*** 1.57***
(0.63) (0.23) (0.44) (0.44) (0.20)
Hispanic 1.12 0.87 0.88 1.11 1.03
(0.21) (0.11) (0.21) (0.18) (0.12)
Education (vs. <high school)
High school 0.58** 0.71* 1.83* 0.88 1.39*
(0.10) (0.10) (0.46) (0.15) (0.18)
Some college 0.49*** 0.57** 1.76† 0.91 1.42*
(0.11) (0.10) (0.54) (0.18) (0.22)
College+ 0.17*** 0.33*** 0.91 0.45** 1.24
(0.06) (0.06) (0.39) (0.12) (0.22)
Enrolled in school 1.19 1.37† 1.23 1.11 1.30†
(0.27) (0.24) (0.33) (0.24) (0.17)
Marital status (vs. stably married)
Unmarried 5.42*** 2.71*** 10.79*** 4.32*** 3.75***
(0.98) (0.39) (2.53) (0.72) (0.44)
Got married 1.88* 2.12*** 4.18*** 2.08** 2.97***
(0.59) (0.41) (1.34) (0.55) (0.43)
Got divorced 1.42 1.29 4.55*** 2.33** 1.59*
(0.55) (0.33) (1.84) (0.64) (0.33)
Poverty (vs. stably not in poverty)
Stably in poverty 1.49† 1.15 1.10 1.48† 1.04
(0.32) (0.21) (0.28) (0.30) (0.15)
Out of poverty 0.91 0.92 1.27 1.45 0.74
(0.51) (0.34) (0.65) (0.62) (0.24)
Into poverty 1.85† 1.28 0.36 1.79† 1.11
Table 7: (Continued)
rUpU rWpU rUpW rMpU rMpW
Variables RRR RRR RRR RRR RRR
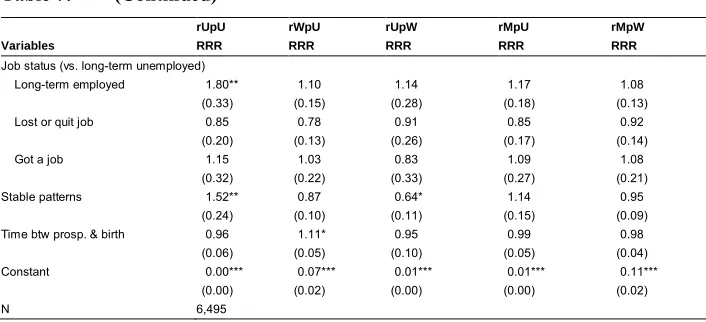
Job status (vs. long-term unemployed)
Long-term employed 1.80** 1.10 1.14 1.17 1.08
(0.33) (0.15) (0.28) (0.18) (0.13)
Lost or quit job 0.85 0.78 0.91 0.85 0.92
(0.20) (0.13) (0.26) (0.17) (0.14)
Got a job 1.15 1.03 0.83 1.09 1.08
(0.32) (0.22) (0.33) (0.27) (0.21)
Stable patterns 1.52** 0.87 0.64* 1.14 0.95
(0.24) (0.10) (0.11) (0.15) (0.09)
Time btw prosp. & birth 0.96 1.11* 0.95 0.99 0.98
(0.06) (0.05) (0.10) (0.05) (0.04)
Constant 0.00*** 0.07*** 0.01*** 0.01*** 0.11***
(0.00) (0.02) (0.00) (0.00) (0.02)
N 6,495
Notes:†p<.10,*p<.05,**p<.01,***p<.001. Standard errors in parentheses. Relative risk ratios shown. rWpW = retrospective wanted and prospective wanted; rUpU = retrospective unwanted and prospective unwanted; rWpU = retrospective wanted and prospective unwanted; rUpW = retrospective unwanted and prospective wanted; rMpU = retrospective mistimed and prospective unwanted; rMpW = retrospective mistimed and prospective wanted.
The columns in Table 7 show five contrasts where the retrospective and prospective report of wanted wanted (rWpW) is the baseline comparison group for all other contrasts. The first column shows the unwanted unwanted (rUpU) compared to rWpW. The coefficient for stable expectation patterns in column 1, 1.52, indicates that women with stable arrays of expectations are 1.52 times more likely than those with unstable arrays to be in category rUpU (compared to rWpW). Overall estimates in this column show that, compared to consistent wanted reports (rWpW), those reporting an unwanted birth (both retrospectively and prospectively, rUpU) are more likely to be older and high parity and to be socioeconomically disadvantaged – more specifically, to be black, have lower levels of education, be unmarried, and among the long-term employed and impoverished. The most striking result is the extent to which these effects persist for nearly all the possible number failure contrasts (columns 1, 2, and 4), albeit impoverishment is only significant for rMpU, and employment is not significant for other groups. Nevertheless, most numerical family planning failures (whether retrospective or prospective) are generally more likely among these demographic and disadvantaged groups. Notably, increasing the time between the prospective measurement and birth by a year increases the likelihood of rWpU compared to rMpU and all consistent response categories (i.e., rWpW, rUpU, and rMpW), which suggests that if women have a longer interval between prospective measurement and conception their expectations might change over time.
Compared to the consistent wanted group, timing failures have some similar predictors as number failures – they are more likely at higher parities and among blacks than whites. But there are some key differences. Timing failures are more likely among younger, more educated mothers, and are marginally more likely among mothers enrolled in school, while, in general, numerical errors are more likely among older, less educated mothers (compared to rWpW). Interestingly, the factors that predict rMpW are similar to those that predict rUpW, as these women are also younger and have more education than those who have consistent wanted reports.
Nevertheless, we are most interested in two specific biases, rWpU and rUpW. The former response pair, rWpU, is much more common than the latter, rUpW (see Table 3). The more common bias, rWpU, occurs when a woman retrospectively reports a birth as wanted even though she prospectively expected no more births. This common bias could result from two different processes, either changes in expectations or retrospective rationalization. For instance, a woman could have changed her expectations from no to yes between the prospective report and conception. In this scenario the bias results from an inability to measure prospective expectations at conception. Alternatively, retrospective rationalization could have occurred such that at conception a woman did not expect another child but after conception or birth she claimed that the child was wanted. The less common bias, rUpW (or retrospectively reporting a birth as unwanted for a woman who prospectively expected a birth), could also arise from changing expectations or retrospective rationalization. For this less common bias, a woman could have changed her expectations from yes to no between the prospective report and conception or rationalized after conception that she did not want to have a child and so reported the birth as unwanted. It is possible that women who prospectively expected a birth but had a birth in a less than desirable context might retrospectively have rationalized the birth as unwanted. In the following, we will compare women with the more common bias, rWpU, to those with the less common bias, rUpW.
Specifically, we examine factors that predict rWpU versus rUpW by comparing the ratios of the coefficients in Table 7. This contrast identifies the social circumstances that play the largest role in differentiating these two types of biases. We plot this contrast in Figure 2, where values above 1 indicate that the common bias is more extreme than the less common bias for a given group (relative to the reference group); values less than 1 indicate that the common bias is less extreme (relative to the reference group).
impoverished (compared to all other poverty statuses), and marginally greater for mothers who had stable expectation patterns. Older married, higher-parity women may be more likely to state that prospectively unwanted births were wanted because they may be firmly established as mothers. These older mothers in stable marital relationships are already caring for other children. Thus, they may be more prepared to care for another child regardless of whether it was wanted or not.
Other evidence suggests that women established as mothers are more likely to retrospectively report that the birth was wanted and those not established as mothers are more likely to retrospectively report that the birth was either unwanted or mistimed. Figure 3 shows the predicted probability of reporting each contrast in Table 3 for established mothers (35 or older at birth, third or higher parity, and stably married holding other variables in Table 7 at their means) and non-established mothers (younger than 22 at birth, first parity, and stably unmarried). Established mothers have a high probability of reporting a birth as wanted regardless of prospective expectations; the predicted probability of an rWpU report is high (0.36) and is much higher than any other report. Moreover, the predicted probability of rUpW is very low at 0.01.
Figure 3: Predicted probability of retrospective and prospective expectations by type of mother
Notes: Predicted probabilities are computed from Table 7. Established mothers are age 35 or older at birth, third or higher parity, and stably married (holding all other variables in Table 7 at their means). Non-established mothers are younger than age 22 at birth, first parity, and stably unmarried (holding all other variables in Table 7 at their means). rWpW = retrospective wanted and prospective wanted; rUpU = retrospective unwanted and prospective unwanted; rWpU = retrospective wanted and prospective unwanted; rUpW = retrospective unwanted and prospective wanted; rMpU = retrospective mistimed and prospective unwanted; rMpW = retrospective mistimed and prospective wanted.
Nonestablished mothers, however, had high probabilities of prospectively reporting that they expected births in the future but were nearly as likely to retrospectively report that birth as mistimed or wanted. The predicted probability of reporting a prospectively wanted birth as mistimed or wanted is 0.44 and 0.38 respectively. The third-highest predicted probability is retrospectively stating that a prospectively wanted birth was unwanted (0.11). This is likely to be because these women desired to become mothers at some point but many did not want to at this particular point in their life.
though established mothers are more likely to have prospective unwanted reports and nonestablished mothers are more likely to have prospective wanted reports, the less common bias is still much more likely among nonestablished mothers. Conditional on prospective wanted expectations, the less common bias (rUpW) is 3.83 times more likely among nonestablished mothers than among established mothers. These findings show that the type of bias reported is systematically related to characteristics of the mother.
8. Conclusion
The cross-tabulations in Tables 3–6 show many cases where retrospective and prospective reports do not correspond. This lack of correspondence could reflect low reliability and/or validity. A key source of unreliability is likely to be genuine ambivalence regarding the expectation for an additional child. Research has shown that if respondents are offered an opportunity to register uncertainty, some will do so (Ní Bhrolcháin and Beaujouan 2011). In the NLSY79, ambivalence regarding the expectation for additional births was not actively sought and reports of ambivalence in the data are rare. More attention to the level of certainty/ambivalence would improve the reliability of both prospective and retrospective measures.
Validity is the major concern. For retrospective reports, the case for systematic underreports (retrospective rationalization) of unwanted births is strong. The consistently lower estimates of unwanted fertility for the retrospective reports (vs. prospective ones) are consistent with this claim. At the same time, prospective reports of unwanted fertility are biased upward if respondents change their mind between the time they gave the report (in the interview) and when they became pregnant; even in the short two-year window in the NLSY79, women had ample time to change their minds and become pregnant prior to the next survey. And we find that a nontrivial proportion of women in our sample (over 30%) changed their minds from not expecting more children to expecting more. Thus, while retrospective reports are likely to be biased downward by rationalization, prospective reports are biased upward because some respondents change their minds and decide to have a child (and subsequently get pregnant). The real level of unwanted fertility almost certainly lies between these two biased measures.
arrays prior to a birth would be less likely to have changed their fertility expectations between surveys (given their unwavering expectations prior to the birth), so this group would have less bias from changing expectations. Consistent with this argument, the association of prospective and retrospective wantedness was much stronger for this subsample at the second and higher parity. Further, if the prospective strategy works better when women have a single stopping point (i.e., stable expectations), then we would expect the estimated level of unwanted fertility for retrospective and prospective reports to be more similar than when women have unstable expectations. We find this for the first and second births. These results suggest that changing expectations is a partial cause of the discrepancies between prospective and retrospective reports.
Second, even among those least likely to have changed their expectations, we find that many births identified as prospectively unwanted were subsequently reported as wanted. This suggests that women may be retrospectively reporting births in light of their current circumstances. To examine this possibility, we estimated the likelihood of discordant responses for established mothers (i.e., 35 or older at child’s birth, third or higher parity, stably married) and nonestablished ones (younger than 22 at first birth, first parity, unmarried). We reasoned that established mothers would be more likely to retrospectively rationalize a prospectively unwanted birth as retrospectively wanted because, given the established mother’s entrenchment in the role of mother, adding an additional birth would be less disruptive to her life. A nonestablished mother, on the other hand, would be more likely to provide the less common type of rationalization (retrospectively report a birth as unwanted when it was prospectively wanted) because becoming a mother was disruptive to her life; even if she expected a child in the future, this birth may seem unwanted retrospectively, given her current circumstances. The empirical results support this reasoning, furnishing evidence that mothers’ current circumstances influence retrospective reports and thus for retrospective rationalization.
Our broadest conclusions can be couched in two very different ways. First, there is a glass-half-full perspective: Despite the discordance visible in the tables, there is a strong statistical association between retrospective and prospective reports – if a birth is coded as unwanted using one approach it is about 2.3 to 12.5 times more likely to be coded as unwanted on the other (depending upon the subpopulation). Other studies also show strong positive associations (see Table 1). These associations suggest that there is an underlying concept (an unwanted birth) being tapped into by both of these approaches. Second, and in contrast, the patterns of discordance that we note above raise significant concerns about validity and reliability and provide the glass-half-empty perspective.
shows that many women do not have stable expectations (i.e., a single fertility stopping point). This is consistent with current research showing that women frequently change their prospective expectations (Yeatman and Sennott 2016). In other words, prospective reports do not allow women to report their expectation at the time of conception, which is at the heart of the definition of wantedness. Second, the prospective strategy almost guarantees that unwanted births will be at the end of women’s reproductive life course and cannot accommodate the fact that birth control use is becoming more important earlier in women’s reproductive life course. For instance, it may be increasingly important to decide when or if a woman wants to become a mother rather than on a particular stopping point. Improved access to birth control may be more influential to society at lower parities because it may allow women to complete education, meet a partner, and develop a career prior to making the transition to motherhood. Improved access to birth control may be less relevant to an ambivalent woman deciding if she should add a third child to her family. Finally, the longitudinal data required for the prospective measure is costly to collect and longitudinal measures of expectations for additional births are not widely available. Even though longitudinal data is now more widely accessible, it would be difficult, and perhaps impossible, to prospectively measure expectations very close to the time of conception. Succinctly, prospective measurements are problematic and as a result may not be a panacea that eliminates the many difficulties of measuring unwanted fertility.
To be clear, retrospective reports are also extremely flawed. Recall problems and retrospective rationalization make it difficult to truly know wantedness at the time of conception. Some argue that women themselves might be uncertain at conception, or may have not yet developed specific expectations (Bachrach and Morgan 2013; Rackin and Bachrach 2016). Thus, some women who were uncertain or did not have any specific expectations at conception may only be able to provide wantedness reports in light of how the birth impacted their life. Research has shown that current circumstances may be very important for wantedness reports (Smith-Greenaway and Sennott 2016). Retrospective rationalization will always be a concern on important, emotionally laden, and complex matters that cannot be rescinded.
Even though retrospective rationalization remains a significant concern, we maintain that the retrospective strategy more accurately reflects the concept of wantedness (i.e., fertility preferences at the time of conception), is flexible enough to include changes in the life cycle of unwanted fertility, and is more feasible to implement. Both measurement strategies have significant deficiencies, but understanding these weaknesses provides researchers with information about where and how to push forward when measuring wantedness.
possibility is to study measurement flaws and then improve measurement strategies. But some of the problems apparent in our analyses suggest that these problems are intractable. Thus, an alternative is to ask whether current flawed measures of unwanted fertility are useful. And if the answer is no, then demographers must ask if this concept, despite its flaws and historical importance, remains valuable. Our work illuminates this dilemma, but does not resolve it.
9. Acknowledgments
References
Bachrach, C.A. and Morgan, S.P. (2013). A cognitive–social model of fertility intentions. Population and Development Review 39(3): 459–485. doi:10.1111/ j.1728-4457.2013.00612.x.
Bankole, A. and Westoff, C.F. (1998). The consistency and validity of reproductive attitudes: Evidence from Morocco.Journal of Biosocial Science 30(4): 439–445. doi:10.1017/S0021932098004398.
Barber, J.S. and East, P.L. (2011). Children’s experiences after the unintended birth of a sibling.Demography48(1): 101–125.doi:10.1007/s13524-010-0011-2.
Bongaarts, J. (1990). The measurement of wanted fertility. Population and Development Review 16(3): 487–506.doi:10.2307/1972833.
Brown, S.S. and Eisenberg, L. (1995).The best intentions: Unintended pregnancy and the well-being of children and families. Washington, D.C.: National Academies Press.
Casterline, J.B. and El-Zeini, L.O. (2007). The estimation of unwanted fertility.
Demography 44(4): 729–745.doi:10.1353/dem.2007.0043.
Guzzo, K.B. and Hayford, S.R. (2014). Revisiting retrospective reporting of first-birth intendedness. Maternal and Child Health Journal 18(1): 2141–2147. doi:10.1007/s10995-014-1462-7.
Joyce, T., Kaestner, R., and Korenman, S. (2002). On the validity of retrospective assessments of pregnancy intention.Demography 39(1): 199–213.doi:10.1353/ dem.2002.0006.
Klerman, L.V. (2000). The intendedness of pregnancy: A concept in transition.
Maternal and Child Health Journal 4(3): 155–162. doi:10.1023/A: 1009534612388.
Koenig, M.A., Acharya, R., Singh, S., and Roy, T.K. (2006). Do current measurement approaches underestimate levels of unwanted childbearing? Evidence from rural India.Population Studies 60(3): 243–256.doi:10.1080/00324720600895819. Logan, C., Holcombe, E., Manlove, J., and Ryan, S. (2007). The consequences of
Machiyama, K., Baschieri, A., Dube, A., Crampin, A.C., Glynn, J.R., French, N., and Cleland, J. (2015). An assessment of childbearing preferences in northern
Malawi.Studies in Family Planning 46(2): 161–176. doi:10.1111/j.1728-4465.
2015.00022.x.
Morgan, S.P. (2001) Should fertility intentions inform fertility forecasts. In:
Proceedings of US Census Bureau Conference ‘The direction of fertility in the United States’. Washington, D.C.: US Census Bureau.
Ní Bhrolcháin, M. and Beaujouan, É. (2011). Uncertainty in fertility intentions in Britain, 1979–2007. Vienna Yearbook of Population Research 9: 99–129. doi:10.1553/populationyearbook2011s99.
Rackin, H.M. and Bachrach, C. (2016). Assessing the predictive value of fertility expectations through a cognitive–social model.Population Research and Policy Review 35(4): 527–551.doi:10.1007/s11113-016-9395-z.
Rackin, H.M. and Brasher, M.S. (2016). Is baby a blessing? Wantedness, age at first birth, and later-life depression.Journal of Marriage and Family 78(5): 1269–
1284.doi:10.1111/jomf.12357.
Ryder, N.B. and Westoff, C.F. (1965). Reproduction in the United States. Princeton: Princeton University Press.
Smith-Greenaway, E. and Sennott, C. (2016). Death and desirability: Retrospective reporting of unintended pregnancy after a child’s death. Demography 53(3): 805–834.doi:10.1007/s13524-016-0475-9.
Westoff, C.F. and Ryder, N.B. (1977). The predictive validity of reproductive intentions.Demography 14(4): 431–453.doi:10.2307/2060589.
Williams, L. and Abma, J. (2000). Birth wantedness reports: A look forward and a look back. Biodemography and Social Biology 47(3–4): 147–163. doi:10.1080/ 19485565.2000.9989016.