International Journal of Research in AYUSH and
Pharmaceutical Sciences
IJRAPS | September 2017 | Vol 1 | Issue 3 137
Research Article
STABILITY INDICATING RP-HPLC METHOD DEVELOPMENT AND VALIDATION
FOR THE ANALYSIS OF CEPHALEXIN AND BROMHEXINE IN PHARMACEUTICAL
DOSAGE FORM
A. Lakshmana Rao*, T. Prasanthi, U. Sai Spandana
Department of Pharmaceutical Analysis, V. V. Institute of Pharmaceutical Sciences, Gudlavalleru,
A.P., India.
ARTICLE INFO Article history:
Received: Oct 20 2017 Accepted: Dec 29 2017 Keywords: Cephalexin, Bromhexine, RP-HPLC, Validation.
ABSTRACT
A simple, precise and rapid RP-HPLC method has been developed and validated for the simultaneous determination of Cephalexin and Bromhexine in pharmaceutical dosage form. The method was carried out using Kromasil C8 column (250 mm x 4.6 mm, 5µm) and mobile phase comprised 0.1% Ortho Phosphoric Acid (OPA) and acetonitrile in the ratio of 45:55 v/v and degassed under ultrasonication. The flow rate was 1.0 mL/min and the effluent was monitored at 215 nm. The retention times of Cephalexin and Bromhexine were 2.29 min and 2.81 min respectively. The method was validated in terms of linearity, precision, accuracy, specificity, limit of detection and limit of quantitation. Linearity was in the range of 62.5 to 375 µg/mL for Cephalexin and 1 to 6 µg/mL for Bromhexine respectively. The percentage recoveries of both the drugs were ranging from 98.27 to 100.02% for Cephalexin and 98.17 to 99.32% for Bromhexine respectively from the tablet formulation. The proposed method is suitable for the routine quality control analysis of simultaneous determination of Cephalexin and Bromhexine in bulk and pharmaceutical dosage form.
INTRODUCTION
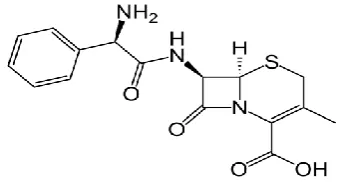
Cephalexin [Fig. 1] (also called Cefalexin) is chemically known as (6R,7R)-7-[(2R)-2-amino-2-
phenylacetamido]-3-methyl-8-oxo-5-thia-1-azabicyclooct-2-ene-2-carboxylic acid. It is is an orally active semisynthetic derivative of the cephalosporin nucleus (7-amino cephalosporanic acid) with a spectrum of activity against both gram-positive and gram-negative bacteria. Cephalexin is advocated for the treatment of infections of the upper and lower respiratory tract, genitourinary system, skin and soft tissue, bones and joints and certain other infections due to susceptible organisms. It can be administered in relatively high oral doses without gastrointestinal irritation, because it is not absorbed from the stomach but is totally and rapidly absorbed in the upper intestine[1,2].
Fig. 1: Structure of Cephalexin
Website: http://ijraps.in 138
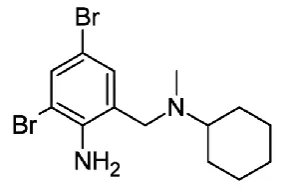
Fig. 2: Structure of Bromhexine
Literature survey reveals that few analytical methods[4-12] were reported for individual determination of Cephalexin and Bromhexine and combination with other drugs, but only one RP-HPLC method[13] was reported for simultaneous estimation of Cephalexin and Bromhexine in combined dosage forms. The objective of the present study was to develop and validate a simple, accurate and precise HPLC method for simultaneous determination of Cephalexin and Bromhexine in pharmaceutical formulations. MATERIALS AND METHODS
Instrumentation: The analysis of drugs was carried out on a Waters HPLC system on a Kromasil C8 column (250 mm x 4.6 mm, 5 µm). The instrument is equipped with a 2695 pump with inbuilt degasser, a Photo Diode Array detector and Auto sampler integrated with Empower 2 Software. UV-VIS spectrophoto-meter PG Instruments T60 with special bandwidth of 2 mm and 10 mm and matched quartz cells integrated with UV win 6 Software was used for measuring absorbances of Cephalexin and Bromhexine solutions. Degassing of the mobile phase was done by using an ultrasonic bath sonicator. A Shimadzu balance was used for weighing the materials.
Chemicals and Solvents: The reference samples of Cephalexin and Bromhexine were obtained from Spectrum Labs, Hyderabad, India. The branded formulations (tablets) were procured from the local market. HPLC grade methanol and analytical grade OPA was obtained from Rankem Chemicals Ltd, Mumbai, India. Hydrochloric acid, sodium hydroxide, hydrogen peroxide of analytical grade was obtained from Merck Chemicals Ltd, Mumbai, India. Milli-Q water was used throughout the experiment.
Chromatographic conditions: HPLC was connected with Kromasil C8 column (250 mm x 4.6 mm, 5 µm) as stationary phase. A mixture of 0.1%OPA:acetonitrile (45:55) v/v was prepared and used as mobile phase. The mixture of water and acetonitrile in the ratio of 50:50 v/v was prepared and used as diluent. Injection volume was 10 µL and flow rate was 1.0 mL/min and run time was 6.0 min. The column was maintained at
ambient temperature and the eluent was monitored at 215 nm.
Preparation of standard solution: Accurately weighed 25 mg of Cephalexin, 4 mg of Bromhexine and transferred to 10 mL and 100 mL volumetric flasks separately. 3/4th of diluent was added to both of these flasks and sonicated for 10 minutes. Flasks were made up with diluents and labeled as standard stock solution 1 and 2 (250 µg/mL of Cephalexin and 40 µg/mL of Bromhexine).This stock solution was diluted to get a concentration of 62.5-375 μg/mL and 1-6 µg/mL for Cephalexin and Bromhexine respectively.
Preparation of sample solution: 5 tablets were weighed and the average weight of each tablet was calculated, then the weight equivalent to 1 tablet was transferred into a 100 mL volumetric flask, 50 mL of diluents was added and sonicated for 25 min, further the volume was made up with diluent and filtered by HPLC filters. 1 mL of filtered sample stock solution was transferred to 10 mL volumetric flask and made up with diluents.
Method development: To develop a simple and robust method for the simultaneous determination of Cephalexin and Bromhexine in combined tablet dosage form using HPLC. The spectra of diluted solutions of the Cephalexin and Bromhexine in diluent were recorded separately on UV spectrophotometer. The peaks of maximum absorbance wavelengths were observed. The spectra of the both Cephalexin and Bromhexine were showed that a balanced wavelength was found to be 215 nm. Preliminary development trials have performed with octyl and octadecyl columns with different types, configurations and from different manufacturers. Finally the expected separation and shapes of peak was succeeded in Kromasil BDS C8 column.
IJRAPS | September 2017 | Vol 1 | Issue 3 139
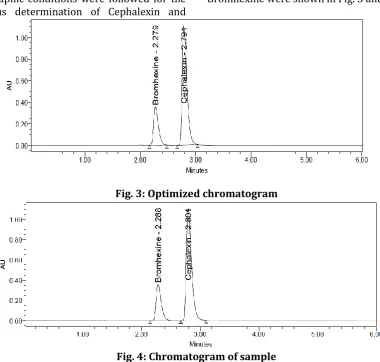
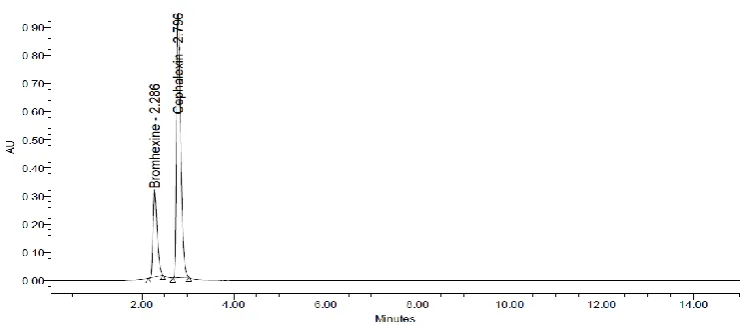
analyte. No interference in blank and placebo solutions for both drug peaks in the trail injections with a runtime of 6.0 min. The above optimized chromatographic conditions were followed for the simultaneous determination of Cephalexin and
Bromhexine in bulk samples and its combined tablet formulations. The chromatograms of standard and sample solutions of Cephalexin and Bromhexine were shown in Fig. 3 and Fig. 4.
Fig. 3: Optimized chromatogram
Fig. 4: Chromatogram of sample
Validation of the proposed method: The proposed method was validated as per ICH [14]guidelines. The parameters studied for validation were specificity, linearity, precision, accuracy, robustness, system suitability, limit of detection, limit of quantification, and solution stability.
Specificity: A study conducted to establish specificity of the proposed method involved injecting blank and
placebo using the chromatographic conditions defined for the proposed method. It was found that there is no interference due to excipients in the tablet formulation and also found good correlation between the retention times of standard and sample. The chromatograms of blank and placebo for Cephalexin and Bromhexine were shown in Fig. 5 and Fig. 6.
Website: http://ijraps.in 140
Fig. 6: Chromatogram of placebo Linearity: Linearity was performed by preparing
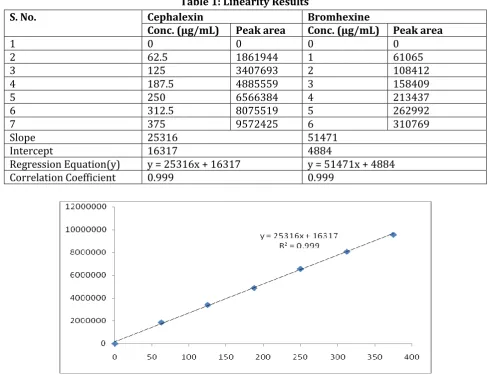
mixed standard solutions of Cephalexin and Bromhexine at different concentration levels including working concentration mentioned in experimental condition i.e., 62.5 to 375 µg/mL for Cephalexin and 1 to 6 µg/mL for Bromhexine respectively. Five microlitres of each concentration was injected in duplicate into the HPLC system. The response was read at 215 nm and the
corresponding chromatograms were recorded. From these chromatograms, the mean peak areas were calculated and linearity plots of concentration over the mean peak areas were constructed individually. The regressions of the plots were computed by least square regression method. Linearity results were presented in Table 1 and linearity plots were shown in Fig. 7 & Fig. 8.
Table 1: Linearity Results
S. No. Cephalexin Bromhexine
Conc. (µg/mL) Peak area Conc. (µg/mL) Peak area
1 0 0 0 0
2 62.5 1861944 1 61065
3 125 3407693 2 108412
4 187.5 4885559 3 158409
5 250 6566384 4 213437
6 312.5 8075519 5 262992
7 375 9572425 6 310769
Slope 25316 51471
Intercept 16317 4884
Regression Equation(y) y = 25316x + 16317 y = 51471x + 4884
Correlation Coefficient 0.999 0.999
IJRAPS | September 2017 | Vol 1 | Issue 3 141
Fig. 8: Calibration curve of Bromhexine
Precision: Precision is the degree of repeatability of an analytical method under normal operational
conditions. Precision of the method was performed as system precision, method precision and intermediate precision.
System precision: To study the system precision, five replicate mixed standard solutions of Cephalexin and
Bromhexine were injected. The percent relative standard deviation (% RSD) was calculated and it was found to be 0.6 and 0.5 for Cephalexin and Bromhexine respectively, which are well within the acceptable criteria of not more than 2.0. Results of system precision studies are shown in Table 2.
Table 2: System precision table of Cephalexin and Bromhexine S. No. Area of Cephalexin Area of Bromhexine
1. 6650241 210776
2. 6642511 213306
3. 6637446 212657
4. 6737626 210780
5. 6698803 212996
6. 6686676 212519
Mean 6675551 212172
S.D 39247.8 1114.2
%RSD 0.6 0.5
Method precision: The method precision study was carried out on six preparations from the same tablet samples of for Cephalexin and Bromhexine and percent amount of both were calculated. The %RSD of the assay result of six preparations in method precision study was found to be 0.4 and 0.5 for Cephalexin and Bromhexine respectively, which are well within the acceptance criteria of not more than 2.0. The results obtained for assay of for Cephalexin and Bromhexine are presented in Table 3.
Table 3: Method precision results of Cephalexin & Bromhexine S. No. Area of Cephalexin Area of Bromhexine
1. 212137 6620134
2. 210307 6696873
3. 211672 6614558
4. 211262 6622508
5. 210668 6667204
6. 212208 6625169
Mean 211376 6641074
S.D 776.7 33273.3
Website: http://ijraps.in 142
Intermediate precision: The intermediate precision study was carried out by different analysts, different columns, different reagents using different HPLC systems from the same tablet of for Cephalexin and Bromhexine and the percent amount of for Cephalexin and Bromhexine was calculated. The %RSD of the assay result of six preparations in intermediate precision study was 0.8 and 0.5 for Cephalexin and Bromhexine respectively, which are well within the acceptance criteria of not more than 2.0. The results of intermediate precision study are reported in Table 4.
Table 4: Intermediate precision results for Cephalexin and Bromhexine S. No Area of Cephalexin Area of Bromhexine
1. 214408 6705971
2. 212408 6700919
3. 216254 6712015
4. 217078 6679323
5. 214565 6772154
6. 215027 6732111
Mean 214957 6717082
S.D 1621.0 31921.5
%RSD 0.8 0.5
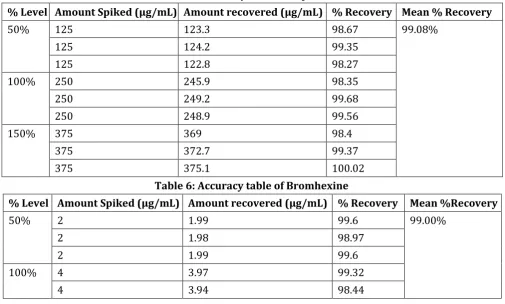
Accuracy: The accuracy of the method was determined by standard addition method. A known amount of standard drug was added to the fixed amount of pre-analyzed tablet solution. Percent recovery was calculated by comparing the area before and after the addition of the standard drug. The standard addition method was performed at three concentration levels of 50%, 100% and 150%. The solutions were analyzed in triplicate at each level as per the proposed method. The percent recovery and %RSD at each level was calculated and results are presented in Table 5 & 6. Satisfactory recoveries ranging from 98.27 to 100.2% for Cephalexin and 98.17 to 99.6% for Bromhexine respectively were obtained by the proposed method. This indicates that the proposed method was accurate.
Table 5: Accuracy table of Cephalexin
% Level Amount Spiked (μg/mL) Amount recovered (μg/mL) % Recovery Mean % Recovery
50% 125 123.3 98.67 99.08%
125 124.2 99.35
125 122.8 98.27
100% 250 245.9 98.35
250 249.2 99.68
250 248.9 99.56
150% 375 369 98.4
375 372.7 99.37
375 375.1 100.02
Table 6: Accuracy table of Bromhexine
% Level Amount Spiked (μg/mL) Amount recovered (μg/mL) % Recovery Mean %Recovery
50% 2 1.99 99.6 99.00%
2 1.98 98.97
2 1.99 99.6
100% 4 3.97 99.32
IJRAPS | September 2017 | Vol 1 | Issue 3 143
4 3.93 98.17
150% 6 5.93 98.89
6 5.93 98.79
6 5.95 99.19
Robustness: The robustness study was performed by slight modification in flow rate of the mobile phase, pH of the buffer and composition of the mobile phase. It was observed that there were no marked changes in chromatograms, which demonstrated that the developed method was robust in nature. The results were represented in Table 7.
Table 7: Robustness data for Cephalexin and Bromhexine
S. No Condition % RSD of Cephalexin %RSD of Bromhexine
1 Flow rate (-) 1.1mL/min 0.5 0.8
2 Flow rate (+) 1.3mL/min 0.1 0.1
3 Mobile phase (-) 35B:65A 0.3 0.6
4 Mobile phase (+) 45B:55A 0.4 0.2
5 Temperature (-) 25°C 0.5 0.5
6 Temperature (+) 35°C 0.1 0.7
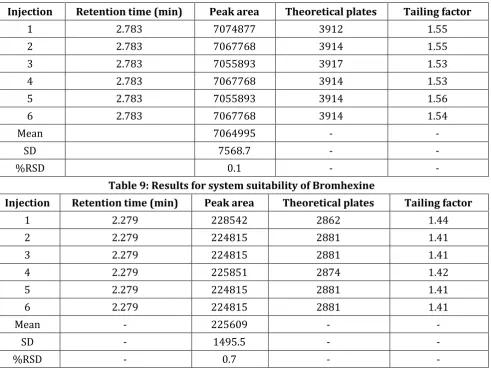
System suitability: System suitability was studied under each validation parameters by injecting six replicates of the standard solution. The system suitability parameters are given in Table 8 & 9.
Table 8: Results for system suitability of Cephalexin
Table 9: Results for system suitability of Bromhexine
Injection Retention time (min) Peak area Theoretical plates Tailing factor
1 2.279 228542 2862 1.44
2 2.279 224815 2881 1.41
3 2.279 224815 2881 1.41
4 2.279 225851 2874 1.42
5 2.279 224815 2881 1.41
6 2.279 224815 2881 1.41
Mean - 225609 - -
SD - 1495.5 - -
%RSD - 0.7 - -
Injection Retention time (min) Peak area Theoretical plates Tailing factor
1 2.783 7074877 3912 1.55
2 2.783 7067768 3914 1.55
3 2.783 7055893 3917 1.53
4 2.783 7067768 3914 1.53
5 2.783 7055893 3914 1.56
6 2.783 7067768 3914 1.54
Mean 7064995 - -
SD 7568.7 - -
Website: http://ijraps.in 144
Limit of detection and Limit of quantification: For this study six replicates of the analyte at lowest concentration were measured and quantified. The LOD and LOQ of Cephalexin and Bromhexine are given in Table 10.
Table 10: Sensitivity table of Cephalexin & Bromhexine Molecule LOD (µg/mL) LOQ (µg/mL)
Cephalexin 0.03 0.10
Bromhexine 0.01 0.03
Stability studies: In order to demonstrate the stability of both standard and sample solutions during analysis, both solutions were analyzed over a period of 24 hours at room temperature. The results show that for both solutions, the retention time and peak area of Cephalexin and Bromhexine remained almost similar (%RSD less than 2.0) and no significant degradation within the indicated period, thus indicated that both solutions were stable for at least 24 hours, which was sufficient to complete the whole analytical process. Further forced degradation studies were conducted indicating the stability of proposed method. The results of the degradation studies are shown in the Table 13.
Acid degradation sample: 1 mL of stocks solution Cephalexin and Bromhexine, 1mL of 2N Hydrochloric acid was added and refluxed for 30 mins at 600C. The resultant solution was diluted to obtain 250 µg/mL & 4 µg/mL solution and 10 µL solutions were injected into the system and the chromatograms were recorded to assess the stability of sample. Typical chromatogram of acid degradation for Cephalexin and Bromhexine is shown in Fig. 9.
Fig. 9: Acid degradation chromatogram of Cephalexin and Bromhexine
Base degradation sample: To 1 mL of stock solution Cephalexin and Bromhexine, 1 mL of 2N sodium hydroxide was added and refluxed for 30 mins at 600C. There sultant solution was diluted to obtain 250 µg/mL & 4 µg/mL solution and 10 µL were injected into the system and the chromatograms were recorded to assess the stability of sample. Typical chromatogram of base degradation for Cephalexin and Bromhexine is shown in Fig. 10.
IJRAPS | September 2017 | Vol 1 | Issue 3 145
Peroxide degradation sample: To 1 mL of stock solution of Cephalexin and Bromhexine, 1 mL of 20% hydrogen peroxide (H2O2) was added separately. The solutions were kept for 30 min at 600c. For HPLC study, the resultant solution was diluted to obtain 250 µg/mL & 4 µg/mL solution and 10 µL were injected into the system and the chromatograms were recorded to assess the stability of sample. Typical chromatogram of peroxide degradation for Cephalexin and Bromhexine is shown in Fig. 11.
Fig. 11: Peroxide degradation chromatogram of Cephalexin and Bromhexine
Thermal degradation sample: The standard drug solution was placed in oven at 105°C for 6hrs to study dry heat degradation. For HPLC study, the resultant solution was diluted to 250 µg/mL & 4 µg/mL solution and 10 µL were injected into the system and the chromatograms were recorded to assess the stability of the sample. Typical chromatogram of thermal degradation for Cephalexin and Bromhexine is shown in Fig. 12.
Fig. 12: Thermal degradation chromatogram of Cephalexin and Bromhexine Table 11: Degradation Data of Cephalexin
S. No. Degradation Condition % Drug Degraded Purity Angle Purity Threshold
1 Acid 4.61 0.142 1.288
2 Alkali 2.89 1.325 2.286
3 Oxidation 1.86 0.134 0.280
4 Thermal 0.55 0.114 0.282
Table 12: Degradation Data of Bromhexine
S. No. Degradation Condition % Drug Degraded Purity Angle Purity Threshold
1 Acid 4.87 2.288 2.300
2 Alkali 2.74 0.996 1.294
3 Oxidation 1.40 0.178 0.282
Website: http://ijraps.in 146
RESULTS AND DISCUSSION
The present study was aimed at developing a simple, sensitive, precise and accurate stability indicating RP-HPLC method for the simultaneous estimation of Cephalexin and Bromhexine from bulk samples and their tablet dosage forms. A non-polar C8 analytical chromatographic column was chosen as the stationary phase for the separation and simultaneous determination of Cephalexin and Bromhexine. Mixtures of commonly used solvents like water, methanol and acetonitrile with or without buffers in different combinations were tested as mobile phases. The choice of the optimum composition is based on the chromatographic response factor, a good peak shape with minimum tailing. A mixture of 0.1% OPA and acetonitrile in the ratio of 45:55 v/v was proved to be the most suitable of all the combinations since the chromatographic peak obtained was well defined, better resolved and almost free from tailing. The retention times of the Cephalexin and Bromhexine were found to be 2.29 and 2.81 min respectively. The linearity was found satisfactory for both the drugs in the range of 62.5 to 375 μg/mL for Cephalexin and 1 to 6 μg/mL for Bromhexine respectively. The regression equation of the linearity curve between concentrations of Cephalexin and Bromhexine over its peak areas were found to be y=25316x+16317 and y=51471x +4884 respectively. Precision of the method was studied by repeated injection of tablet solution and results showed lower % RSD values. This reveals that the method is quite precise. The percent recoveries of the drug solutions were studied at three different concentration levels. The percent individual recovery and the % RSD at each level were within the acceptable limits. This indicates that the method is accurate. The absence of additional peaks in the chromatogram indicates non-interference of the commonly used excipients in the tablets and hence the method is specific. The deliberate changes in the method have not much affected the peak tailing, theoretical plates and the percent assay. This indicates that the present method is robust. The system suitability studies were carried out to check various parameters such as theoretical plates and tailing factor. The lowest values of LOD and LOQ as obtained by the proposed method indicate that the method is sensitive. The solution stability studies indicate that both the drugs were stable up to 24 hours. The forced degradation studies indicate that both the drugs Cephalexin and Bromhexine were stable in stability studies.
CONCLUSION
A simple and reproducible RP-HPLC procedure was developed and validated as per ICH guidelines for the simultaneous estimation of Cephalexin and Bromhexine in marketed formulation. Quantitative estimation of Cephalexin and Bromhexine was estimated by RP-HPLC using 0.1% OPA: Acetonitrile (45:55) v/v as a mobile phase and column Kromasil C8 (4.6 x 250 mm, 5 µm)as a stationary phase and the peak was observed at 215 nm which was selected as a wavelength for quantitative estimation. After development of the method it was validated for specificity, system suitability, accuracy, linearity, precision, ruggedness and robustness. Therefore it was concluded that the proposed method can be used for routine analysis of simultaneous estimation of Cephalexin and Bromhexine in combined dosage form.
REFERENCES
1. Griffith RS. The pharmacology of Cephalexin. Post Graduate Medical Journal.1983; 59(5): 16-27.
2. Speight TM, Brogden N and Avery GS. Cephalexin: A Review of its Antibacterial, Pharmacological and Therapeutic Properties Drugs January 1972; 3(2): 9–78.
3. Benoit V, Bruno G, Nieves S, Jocelyne L, Marc F and Fabrizio A. Cellular and molecular mechanisms of Bromhexine: An overview. Clincal Science (London). 2012; 122(6): 253– 270.
4. Lalit VS and Sanjaykumar BB. Development and validation of RP-HPLC method for the simultaneous estimation of Amoxicillin Trihydrate and Bromhexinee Hydrochloride from oily Suspension. Pharmaceutica Analytica Acta. 2010; 1(2): 1-6.
5. Jivani NP, Hitesh V and Hetal PR. Stability indicating HPLC method development and validation for simultaneous estimation of Bromhexinee and Phenylephrine HCL in its combined pharmaceutical dosage form. Journal of Pharmaceutical Sciences and Bio-scientific Research.2016; 6(4); 523-528. 6. Kumar A and Sanju N. A validated high
performance liquid chromatographic method for estimation of Bromhexine and Terbutaline in bulk and tablet dosage form. Journal of Pharmaceutical Methods. 2011; 2(4): 218-222. 7. Senthilraja M and Giripaj P. Reverse Phase
IJRAPS | September 2017 | Vol 1 | Issue 3 147
Pharmaceutical and Clinical Research. 2011; 4(2): 13-15.
8. Gupta A, Garg R and Sharma AK. Derivative spectrophotometric and multi wavelength spectrophotometric methods for simultaneous determination of Terbutaline Sulphate, Bromh exine Hydrochloride and Guaiphenesin in thee component tablet dosage forms. Indian Journal of Pharmaceutical Sciences. 1999; 61: 12830. 9. Patil KM, Bhoir IC and Sundareesan M. Derivative spectrophotometric method for the analysis of Terbutaline Sulphate and Guaiphenesin in combined dosage form. Indian Journal of Pharmaceutical Sciences. 1998; 60: 407-409.
10. Trivedi P and Sachan A. Two spectro-photometric methods have proposed for
simulataneous analysis of Bromhexine Hydro-chloride, Diphenhydramine Hydrochloride and Guaiphenesin from multi component syrup formulation Indian Drugs. 1999; 36: 735-738. 11. Tapsoba JE, Belgained and Boujlel.
Voltammetric assay of Guaifenesin in pharma-ceutical formulation. Journal of Pharmapharma-ceutical and Biomedical Analysis. 2005; 3(8):162-165. 12. Siddartha B and Bharathi Ch. Simultaneous
estimation and validation of Bromhexine and Cephalexin in bulk and pharmaceutical dosage form by RP-HPLC method. Scholars Research Library. 2014; 6(6): 315-321.
13. ICH Harmonised Tripartite Guideline. Validation of Analytical Procedures: Text and Methodology, Q2(R1), USA, 2005; 1-13.
Cite this article as:
A.Lakshmana Rao, T.Prasanthi, U.Sai Spandana. Stability Indicating RP-HPLC Method Development and Validation for the Analysis of Cephalexin and Bromhexine in Pharmaceutical Dosage Form. International Journal of Research in AYUSH and Pharmaceutical Sciences, 2017;1(3):37-147.
Source of support: Nil, Conflict of interest: None Declared
*Address for correspondence A. Lakshmana Rao