Available Online at www.ijpret.com 43
INTERNATIONAL JOURNAL OF PURE AND
APPLIED RESEARCH IN ENGINEERING AND
TECHNOLOGY
A PATH FOR HORIZING YOUR INNOVATIVE WORK
A THEORETICAL STUDY OF SUPER FLUID – INSULATOR PHASE TRANSITION IN A
GAS OF ULTRA COLD ATOMS AND EVALUATION OF ATOM DENSITY
DISTRIBUTION AS A FUNCTION OF DISTANCE FROM THE CENTRE OF TRAP
(R/A) USING BOSE-HUBBARD MODEL
JITENDRA KUMAR SINGH2, L. K. MISHRA1 1. Department of Physics, Magadh University, Bodh-Gaya-824234 (Bihar)
2. Department of Physics, Alma Iqbal College, Biharsarif, Nalanda (Bihar)
Accepted Date: 22/05/2015; Published Date: 01/07/2015
\
Abstract: - Using the theoretical formalism of Jakub Zakrzewski ( cond-mat/0406186v3
(2005), we have theoretically studied quantum phase transition from a super fluid to Mott insulator in a gas of ultra cold atoms and evaluated mean field particle density distribution as a function of r/a. Our theoretically evaluated results are in good agreement with the results of quantum Monte Carlo simulation results. This calculation also indicates that mean field Gutzwiller approximation allows one to simulate the dynamics of Bose-Hubbard model taking into account of realistic experimental conditions. Our theoretically evaluated results are also in good agreement with other theoretical workers.
Keywords: Bose-Hubbard model, Quantum phase transition, Super fluid-insulator phase transition, Gutzwiller trail function, Mean field approximation, Quantum Monte Carlo simulation, Wannier site function, Harmonic magnetic trap potential, Time dependent mean field dynamics, Integrated momentum distribution
Corresponding Author: MR. JITENDRA KUMAR SINGH
Access Online On:
www.ijpret.com
How to Cite This Article:
Jitendra Kumar Singh, IJPRET, 2015; Volume 3 (11): 43-54
Available Online at www.ijpret.com 44 INTRODUCTION
The Bose-Hubbard model1,2 is one of the standard models for studying the interacting particles in a cold gas placed in an optical lattice. The reported realization3 of a quantum phase transition between super fluid (SF) and Mott insulator (MI) phase showed that one can control the parameters of the model at will. This has triggered several studies involving Bose condensate4-9 and Bose-Fermi mixtures10-13 placed on optical lattice. Several groups have also tried to understand the details of the experiments3 to check the underlying physics involved in it.
A physical system that crosses the boundary between two phases changes its properties in a fundamental way. When the temperature of the system approaches zero, all thermal fluctuations die out. This prohibits phase transition in a classical system at zero temperature as their opportunity to change has vanished. However, their quantum mechanical counterparts can show fundamentally different behavior. In quantum system, fluctuations are present even at zero temperature due to Heisenberg uncertainty relation. These quantum fluctuations may be strong enough to derive a transition from one phase to another bringing about the macroscopic change. A prominent example of such a quantum phase transition is the change from the super fluid phase to Mott insulator phase in a system consisting of bosonic particles with repulsive interactions hopping through a lattice potential. This system was first studied theoretically in the context of super fluid to insulator transitions in liquid helium14. Jakisch etal15 have proposed that such a transition might be observable when an ultra cold gas of atoms with repulsive interactions is trapped in a periodic potential.
Available Online at www.ijpret.com 45
entropy whereas quantum phase transition is driven between the kinetic and interaction energy.
In this paper, using the theoretical formalism of J. Zakrzewski17,18, we have theoretically studied the quantum phase transition from a super fluid to a Mott insulator in a gas of ultra cold atoms. We have also theoretically evaluated mean field particle density distribution as a function of r/a taking different set of parameters U, U0 and κ. We have also evaluated atom density
distribution (accumulations of sites) as a function of r/a by taking four sets of parameters V, N and γSF where V is lattice depth potential, N is total number of atoms and γSF is super fluid
factor. Our theoretically evaluated results are in good agreement with other theoretical workers19-21.
MATERIALS AND METHODS
The Bose-Hubbard Hamiltonian describing the system takes the form22
,
( 1)
2
i j i i i i
i j i i
U
H J a a n n W n
(1)
Where ni=ai+ai is occupation number operator at site i (with ai being the corresponding
annihilation operator) Wi denotes the energy offset of the ith lattice sites due to external
harmonics component of the atom. U is the interaction energy and J is the tunneling
coefficient. i j, denote a sum over nearest neighbor. The strength of the tunneling term is
characterized by the hopping matrix element between adjacent sites i,j
2 2
3
( )( ( )) ( )
2
i lat i
J d xw x x V x w x x m
(2)
Where w(x-xi) is the single particle Wannier function localized to the ith lattice site, Vlat(x) is
optical lattice potential and m is the mass of a single atom. The repulsion between two atoms on a single lattice site is given by on-site interaction matrix element U
2
4 3 4
( a) ( )
U w x d x m
(3)
Where a is the scattering length of an atom. One first considers the standard homogeneous situation in which all Wi’s are equal. The last term of equation (1) becomes proportional to the
Available Online at www.ijpret.com 46
U/J. When tunneling dominates the system in its ground state is super fluid while in the opposite case it becomes the Mott insulator. The border line between the two phases depends on the chemical potential. The effective chemical potential at each site is given by
i Wi
(4)
Now to find the mean field ground state, one minimizes
E G H N G
(5)
Where N=i in and G is Gutzwiller trial function
1 ( ) 0 1 ( m n N i n n i
G f n i
(6)
Where the number of parameters fn(i) depends on the number of site as well as the maximal
occupation of a given site nm. At each site I, one takes a solution for fn(i) corresponding to the
homogeneous B-H model with the effective chemical potential μ.
Now the difference of the on-site energy Wi and the chemical potential μ is expressed as
2 0
2
i i
U W U x
(7)
Where xi is the position vector of site i. U and U0 are different taken to match the results with
mean field solution with quantum Monte Carlo results23. The momentum distribution is given by24
2 .( )
,
( ) ik r ri j
k i i
i j
n k
e a a (8)
Where k is the wave vector, φ(k) is Fourier transform of Wannier site function. In order to characterize whether the state is closer to super fluid or Mott insulator, one defines the super
fluid factor SF
1
SF ai a i
N
Available Online at www.ijpret.com 47 SF
=0.0 for pure MI state.
Now, one applies time dependent variational principle25. One takes minimum of expression
( ) ( ) ( )
G t i H t N G t
t
=minimum (10)
Here H(t) is time dependent Hamiltonian . μ is also time dependent. G t( ) is variational wave function. The minimum of equation (10) gives the set of first order differential equation for fn(i)(t)
( ) ( ) * ( ) ( )
1 1
[ ( 1) ( )] [ 1 ]
2
i i i i
n i n i n i n
d U
i f n n n W f J n f n f
dt
(11)
Where i j G t a G t( ) j ( ) (12)
In equation (12) the sum as indicated by subscript in bracket is over the nearest neighbor only. Now when U and J change the chemical potential corresponding to the mean field solution with a given number of particles N also changes. The dynamics of μ depends upon the evolution of
two states G1 and G2 with different average number of particles.
2 2 1 1 1
N G N G N N G N G N
(13)
The chemical potential at given time will be
2 2 1 1
[ ( ) ( ) ( ) ( ) ( ) ( ) ( )t G t H t G t G t H t G t
N (14)
This approach is used to find out the numerical results shown in table
The freely expanding atomic cloud after some delay was recorded by a destructive absorption imaging which is reflected in the momentum distribution26. Since the absorption images are taken along two orthogonal axes the quantity measured in fact is the integrated momentum distribution which is given by
( ,x y) z k
N k k
dk nAvailable Online at www.ijpret.com 48
For clouds released from low optical lattice when tunneling dominates and the super fluid behavior is expected the signal reflects Bragg peaks due to interference of the atoms coming from different lattice sites. At increased lattice depth above 13Eγ (where Eγ is the recoil energy
of the Rb atom) the interference maxima immersed in the incoherent background. This behavior is associated with the quantum phase transition from SF to MI phase.
RESULTS AND DISCUSSION
In this paper using the theoretical formalism of Jakub Zakrzewski17,18, we have studied mean field dynamics of super fluid –insulator phase transition in a gas of ultra cold atoms. We have evaluated mean field particle distribution (on site filling factor) n as s function of r/a and mean field atom density distribution (accumulation of sites) also as a function of r/a with different set of parameters. In table T1, we have shown the evaluated results of mean field particle distribution ‘n’ as a function of r/a with different sets of parameters; (a) U=24, U0=-11.08,
κ=0.19531 (b) U=32, U0=-28.08, κ=0.19531 (c) U=80, U0 =-65, κ=0.97656. U is the interaction
energy, U0 is the energy required to make a particle-hole excitation, κ is the parameter to
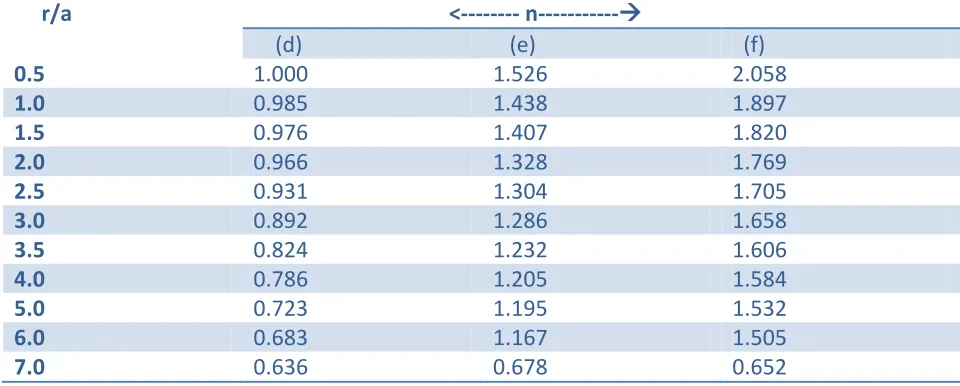
match the result of mean field with Quantum Monte Carlo results. Our evaluated results indicate that mean particle distribution n decreases with r/a. the decrease is more sharply pronounced in case of (a) in comparison to (b) and (c) . In table T2, we again repeated the calculation by taking three different values of U, U0 and κ shown in (d), (e) and (f). In this case
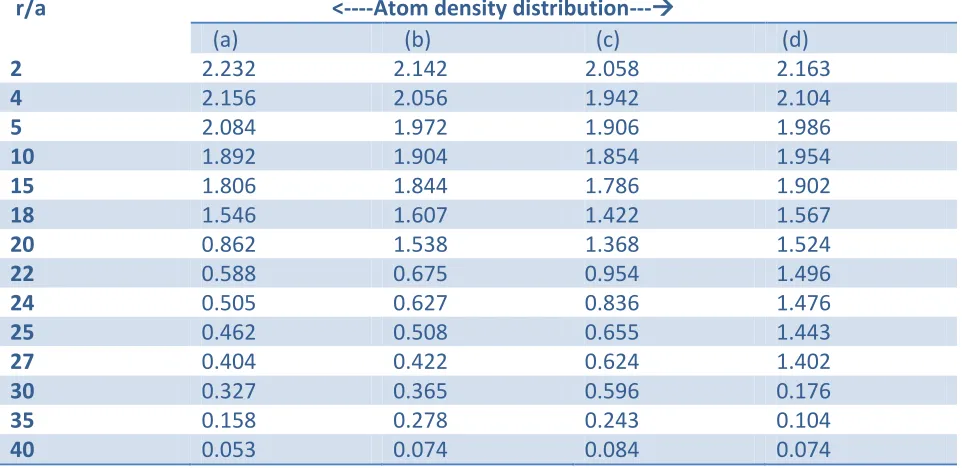
the value of n is large in (f) and small in (d). Here, also n decreases with r/a. In table T3, we have shown the evaluated results of mean field atom density distribution (occupation of sites) as a function of r/a. Here, we have taken three sets of parameters V, N and γSF known as lattice
depth potential, Total number of particles, Eγ recoil energy, Super fluid factor. In calculation, we
have taken four sets of parameters (a) V=9Eγ, N=99771, γSF=0.95 (b) V=13Eγ, N=99502, γSF=0.40
(c) V=16Eγ, N=95408, γSF=0.11 (d) V=22Eγ, N=94572, γSF=0.01. Here, the chemical potential μ has
been adjusted to have the average number of atoms 105. This leads to more than two atoms per site in the center of the trap. To characterize whether the state is closer to being super fluid or Mott insulator, we take super fluid factor γSF. The case V=9Eγ seems almost fully super fluid
when V=13Eγ shows first traces of insulating phase. The transition is completed for significant
fraction of sites at V=16Eγ while for deepest lattice V=22Eγ ,SF fraction is restricted to vary
narrow regions separately different integer occupations. In table T4, we have given the interference peak widths (μm) as a function of energy difference between neighboring sites ΔE/Ћ due to potential gradient applied. Here, we have also taken four different sets of potential gradient (a) 10Eγ (b) 13 Eγ (c)16 Eγ and (d) 20 Eγ. The results shown in tableT4 are fits to the data
Available Online at www.ijpret.com 49
be interpreted as follows: If excitations have been created during the application of the potential gradient at the potential depth V0=Vmax then one is not able to return to perfectly
coherent super fluid state by taking the potential to a depth Vo=9 Eγ. Here, excitations in the
Mott insulator phase will lead to excitations in the lower energy band in the super fluid case. These excitations are simply phase fluctuations between lattice sites. It also causes a broadening of the interference maxima in the interference pattern. Our theoretical results indicate that in case (a) V=10Eγ the state is completely super fluid state. In this case no peak
values are seen. In case (b) V= 13 Eγ two peak values are observed as a function of ΔE/Ћ.
Similarly in case of (c) and (d) two peak values are observed. These all results show the dynamical process of restoring coherence coming from Mott insulator Phase. There is some recent calculations27-35 which also reveals the same behavior.
CONCLUSION
From the above theoretical analysis and investigations, we have come across the following conclusions
(1) In the theoretical study of quantum phase transition from a super fluid to a Mott insulator in a gas of ultra cold atoms, we observed that as the potential depth of the lattice is increased, a transition is observed from a super fluid to Mott insulator phase. In the super fluid phase each atom is spread out-over the entire lattice with long range phase coherence. But in the insulating phase atoms are localized at individual lattice sites with no phase coherence across the lattice. This phase is characterized by a gap in the excitation spectrum.
Available Online at www.ijpret.com 50 Table T1: An evaluated result of mean-field particle distribution ‘n’ as a function of r/a with
different sets of parameters (a) U=24, U0=-11.08, κ=0.19531 (b) U=32, U0=-28.08,κ=0.19531
(c) U=80, U0 =-65, κ=0.97656. U is the interaction energy, U0 is the energy required to make a
particle-hole excitation, κ is the parameter to match the result of mean field with Quantum Monte Carlo results.
r/a <---n---
(a) (b) (c)
1.0 0.562 1.000 1.000
1.5 0.508 0.982 0.984
2.0 0.476 0.917 0.942
2.5 0.403 0.843 0.936
3.0 0.365 0.796 0.904
4.0 0.308 0.702 0.896
5.0 0.284 0.654 0.845
6.0 0.237 0.606 0.726
7.0 0.186 0.532 0.637
8.0 0.105 0.474 0.548
9.0 0.084 0.286 0.406
10.0 0.006 0.205 0.316
12.0 0.000 0.005 0.006
Table T2: An evaluated result of mean-field particle distribution ‘n’ as a function of r/a, the others parameters are (d) U=80, U0=-90.0, κ=1.03062 (e) U=80.0, U0=-120.08, κ=2.00375 (f)
U=80, U0 =-150.0, κ=1.75781.
r/a <--- n---
(d) (e) (f)
0.5 1.000 1.526 2.058
1.0 0.985 1.438 1.897
1.5 0.976 1.407 1.820
2.0 0.966 1.328 1.769
2.5 0.931 1.304 1.705
3.0 0.892 1.286 1.658
3.5 0.824 1.232 1.606
4.0 0.786 1.205 1.584
5.0 0.723 1.195 1.532
6.0 0.683 1.167 1.505
Available Online at www.ijpret.com 51
8.0 0.432 0.439 0.504
9.0 0.324 0.340 0.368
10.0 0.242 0.228 0.254
12.0 0.017 0.007 0.090
Table T3: An evaluated result of mean-field atom density distribution (accumulation of sites) as a function of r/a. others parameters are (a) V=9Eγ, N=99771, γSF=0.95 (b) V=13Eγ, N=99502,
γSF=0.40 (c) V=16Eγ, N=95408, γSF=0.11 (d) V=22Eγ, N=94572, γSF=0.01.Here three sets of
parameters V, N and γSF are known as lattice depth potential, Total number of particles, Eγ
recoil energy, Super fluid factor
r/a <----Atom density distribution---
(a) (b) (c) (d)
2 2.232 2.142 2.058 2.163
4 2.156 2.056 1.942 2.104
5 2.084 1.972 1.906 1.986
10 1.892 1.904 1.854 1.954
15 1.806 1.844 1.786 1.902
18 1.546 1.607 1.422 1.567
20 0.862 1.538 1.368 1.524
22 0.588 0.675 0.954 1.496
24 0.505 0.627 0.836 1.476
25 0.462 0.508 0.655 1.443
27 0.404 0.422 0.624 1.402
30 0.327 0.365 0.596 0.176
35 0.158 0.278 0.243 0.104
40 0.053 0.074 0.084 0.074
Table T4 : An evaluated result of interference peak width(μm) as a function of energy difference between neighboring lattice sites ΔE/Ћ due to potential gradient applied
(Vmax=10Eγ (b) 13Eγ (c) 16Eγ (d) 20 Eγ
ΔE/Ћ (KHz) <---Interference peak width (μm)---
(a) (b) (c) (d)
0 10.25 10.86 16.25 18.57
1.0 15.68 12.58 18.84 20.26
1.5 20.46 22.47 32.35 28.42
Available Online at www.ijpret.com 52
2.5 33.26 30.26 22.16 23.25
3.0 37.49 32.39 24.58 24.16
3.5 41.86 37.15 23.86 27.89
4.0 43.24 30.42 21.29 22.42
4.5 44.59 29.59 22.58 23.67
6.0 45.16 32.57 23.09 20.34
6.5 47.27 33.11 28.13 18.29
7.0 49.58 39.56 29.24 17.56
8.0 55.06 38.29 26.12 24.42
REFERENCES:
1. M. P. A. Fisher, P. B. Weichman, G. Grinstein and D. S. Fisher, Phys. Rev B40, 546 (1989)
2. S. Sachdev, “ Quantum phase transitions (Cambridge University, Press, Cambridge, 2001)
3. M. Greiner, O. Mandel, T. Esslinger, T. W. Hansch and I. Bloch, Nature (London) 415, 39(2002)
4. D. Van Oosten, P. Van der Straten and H. T. C. Stoof, Phys. Rev. A63, 053601(2001)
5. D. B. M. Dickerscheid, D. Van Oosten, P. J. H. Denteneer and H. T. C. Stoof A68, 043623(2003)
6. C. Menotti, A. Smerzi and A. Trombettoni, New J. Phys. 5, 112(2003)
7. D. Jaksch, V. Venturi, J. I. Cirae, C. J. Williams and P. Zoller, Phys. Rev. Lett.(PRL) 89, 040402(2002)
8. B. Damiki, J. Zakrzewski, L. Santos, P. Zoller and M. Lewenstein, Phys. Rev. Lett.(PRL) 91, 080403(2003)
9. B. Damiki etal. Phys. Rev. Lett. (PRL) 90, 110401(2003)
A. Albus, F. Illuminato and J. Eisert, Phys. Rev A68, 023606(2003)
10.H. P. Buchler and G. Blatter, Phys. Rev. Lett.(PRL) 91,130404(2003)
Available Online at www.ijpret.com 53
12.H. Feshrmann, M. A. Baramov, B. Damiki and L. Santos, Cond-mat/0307635(2003)
13.V. A. Kashurnikov, N. V. Prokof’av and B. V. Svstunov, Phys. Rev. A66, 031601(2002)
14.D. Jakesch, C. Bruder, J. I. Cirac, C. w. Gardiner and P. Zoller, Phys. Rev. Lett. (PRL) 81, 3108(1998)
15.S. Stringari, C. R. Acad. Sci 4, 381(2001)
16.J. Zakrzewski, Cond-mat/0406186v1(2004)
17.J. Zakrzewski, Cond-mat/0406186v3(2005)
18.M. Fattori etal. Nature Phys. 2, 765(2006)
19.S. Folling, A. Widera and I. Bloch, Phys. Rev. Lett.(PRL) 97,060403(2006)
20.M. Popp. I. J. Garcia-Ripokl, K. G. Vollberteha and I. J. Cirac A74, 013622(2006)
21.Bloch, J. Dalibard and W. Zwerger, Rev. Mod. Phys. 80, 885(2008)
22.R. N.Palmer, A. Klein and D.Jaksch, Phys. Rev.(2008) A78, 013609
A. L. Fetter, Rev. Mod. Phys.81, 647(2009)
23.G. Moller and N. R. Cooper, Phys. Rev. Lett. (PRL) 103, 105303(2009)
24.F. Gerbier and J. Dalibard, New. J. Phys 12, 033007(2010)
25.T. Duric and D. K. K. Lee, Phys. Rev. B81, 014520(2010)
26.P. Lugan, L. Sanchez-Palencia, Phys. Rev. A84, 013612(2011)
27.M. C. Beeler, M. E. W. Reed, T. Hong, S. L. Rolston and U. Gavish, New. J. Phys. 14, 073024(2012)
28.G. Gaul and C. A. Muller, Eur. Phys J. Special topics 217, 69(2013).
29.G. Konya, G. Szirmai and P. Domokis, Phys. Rev. A90, 013623(2014)
30.D. Mckay, U. Ray, S. Natu and B. Demarco, arXiv:1411.5595v2[Cond-mat.quant.gas] 25Nov 2014
Available Online at www.ijpret.com 54
32.Peng-Jeng Wang and Jing Zhang, Frontiers of Physics, 9(5) 598 (2014)