Available Online at www.ijpret.com 279
INTERNATIONAL JOURNAL OF PURE AND
APPLIED RESEARCH IN ENGINEERING AND
TECHNOLOGY
A PATH FOR HORIZING YOUR INNOVATIVE WORK
DIABETIC RETINOPATHY USING MORPHOLOGICAL OPERATIONS AND MACHINE
LEARNING
MS. BHAGYASHRI S. MANKAR1, PROF. NITIN RAUT2
1. MTECH (CSE), GNIET, Nagpur-441501.
2. Assistant Professor (CSE), GNIET, Nagpur-441501.
Accepted Date: 15/03/2016; Published Date: 01/05/2016
\
Abstract: Diabetic retinopathy (DR) is a condition where the retina is damaged due to fluid leaking from the blood vessels into the retina. In extreme cases, the patient will become blind. Therefore, early detection of diabetic retinopathy is crucial to prevent blindness. The main stages of diabetic retinopathy are non-proliferate diabetic retinopathy (NPDR) and proliferate diabetic retinopathy (PDR). Retinal micro-aneurysms, haemorrhages, exudates and cotton wool spots are kind of major abnormality to find the Non- Proliferative Diabetic Retinopathy (NPDR) and Proliferative Diabetic Retinopathy (PDR). The main objective of our proposed work is to detect retinal micro- aneurysms and exudates for automatic screening of DR using Support Vector Machine (SVM) and KNN classifier. To develop this proposed system, a detection of red and bright lesions in digital fundus photographs is needed. Micro-aneurysms are the first clinical sign of DR and it appears small red dots on retinal fundus images. To detect retinal micro-aneurysms, retinal fundus images are taken from Messidor, DB-ret dataset and then after pre-processing, morphological operations are performed to find micro-aneurysms and then features are get extracted such as GLCM and Structural features for classification. In order to classify the normal and DR images, different classes must be represented using relevant and significant features.
Keywords: Diabetic Retinopathy, NPDR, PDR, micro-aneurysm, exudates, SVM, KNN
Corresponding Author: MS. BHAGYASHRI S. MANKAR Access Online On:
www.ijpret.com
How to Cite This Article:
Bhagyashri S. Mankar, IJPRET, 2016; Volume 4 (9): 279-287
Available Online at www.ijpret.com 280 INTRODUCTION
Diabetes is the commonest cause of blindness in the working age group in the developed world. Patient’s sight can be affected by diabetes which causes cataracts, glaucoma, and most importantly, damage to blood vessels inside the eye, a condition known as “diabetic retinopathy”. Diabetic retinopathy is a critical eye disease which can be regarded as manifestation of diabetes on the retina. The screening of diabetic patients for the development of diabetic retinopathy can potentially reduce the risk of blindness in these patients by 50%.Diabetic retinopathy can be broadly classified as non-proliferative diabetic retinopathy (NPDR) and proliferative diabetic retinopathy (PDR) .Therefore, regular screening of diabetic patients’ retina is very important. And, automated or computer-assisted analysis of diabetic patient’s retina can help eye care specialist to screen larger populations of patients. One of the first unequivocal signs of the presence of diabetic retinopathy is the appearance of micro aneurysms; these appear as small red dots between the larger vessels of the retina. In some cases the micro aneurysms will burst causing haemorrhages. As the disease and damage to the vasculature progresses larger haemorrhages will appear. In addition to leaking blood, the vessels will also leak lipids and proteins causing small bright dots called exudates to appear.
METHODS AND MATERIALS
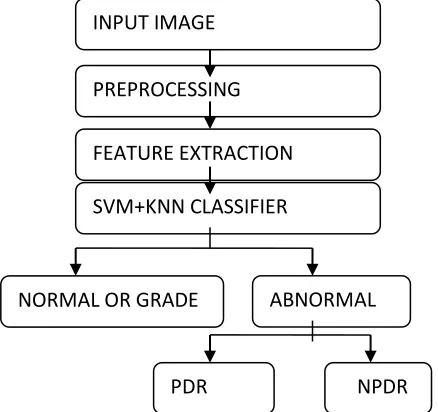
Firstly this system takes retinal image as a input, after loading the image it will go under pre-processing part where features are extracted from the image and fed these into the classifier for classification of the image as whether this image is normal or having Diabetic Retinopathy.
Fig. Propose method development diagram. INPUT IMAGE
PREPROCESSING
NORMAL OR GRADE
SVM+KNN CLASSIFIER FEATURE EXTRACTION
ABNORMAL
Available Online at www.ijpret.com 281 PREPROCESSING
In the preprocessing stage, problems arise due to the blurred image or non-clarity. Hence Images are rectified in preprocessing. This stage involves the color space conversion, image restoration and enhancement.
Color space conversion: Image is converted into gray scale model
Image Restoration: Filtered image to remove the noise using adaptive median filter
Contrast Enhancement: In this histogram equalization highlights the darker regions and keeps
the brighter region at almost same level.
a) Original image b) HSI image
c) Preprocessed image d) histogram of preprocessed image
FEATURE EXTRACTION
In order to classify the given fundus image as PDR or NPDR, first we have to extract features.
Micro aneurysms: These are small red dots on the retinal surface, which occur due to capillary
Available Online at www.ijpret.com 282 Exudates: These appear as yellow or white structures in the retina. There are two types of
exudates based on their appearance and occurrence. Hard exudates have well defined boundaries and the soft exudates have unclear boundaries also known as cotton wool spots.
Haemorrhages: These occur due to bleeding. Dot haemorrhages lie deep within the retina and
reflect leakage of the veins and capillaries. Dot haemorrhages are an indication of diabetic retinopathy.
CLASSIFICATION
In this we are using splat features and GLCM features likes Energy, contrast, entropy, homogeneity, and area part of exudates and the formulas for extracted features are given below:
1) Entropy: A scalar value representing the entropy of gray-scale retinal image. Entropy feature is a statistical measure of randomness that can be used to characterize the texture of the input retinal image. It is defined as
Sum (p. *log2 (q))
Where q is the histogram counts.
Entropy=∑ i ∑ j G (i, j) log (G (i, j))
2) Contrast: The contrast function enhances the contrast of an image. It creates a new gray
Available Online at www.ijpret.com 283
Contrast=∑i ∑ j (i, j) 2 N (G (i, j))
3) Energy: Energy is used to describe a measure of "information" when formulating an
operation under a probability framework such as MAP (maximum a priori) estimation in conjunction with Markov Random fields.
Energy = ∑i∑j (G (i, j)) 2
4) Homogeneity:
Homogeneity=∑ i∑ j G (i, j)) / [1 + (i – j)]
These features are selected for reducing noise and enhancing the result of classifier accuracy.
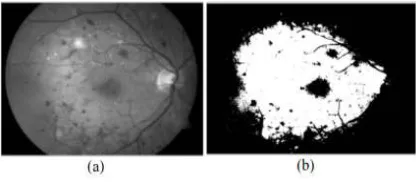
Fig. (a) Original image (b) Severe NPDR
Table show the diabetic retinopathy severity or grade as normal, mild and serve.
SUPPORT VECTOR MACHINES
Available Online at www.ijpret.com 284 RESULTS AND DISCUSSION:
The all texture features from the given image corresponding to two classes are extracted using the proposed algorithms. The results of the K-Nearest Neighbour and Support Vector Machine classification are shown in below
K-nearest neighbour
1. Normal:
a. Number of data for training: 7
b. Number of data for testing : 20
c. Accurately Classified: 18
d. Accuracy: 90%
2. NPDR:
a. Number of data for training: 13
b. Number of data for testing :16
c. Accurately Classified:8
d. Accuracy: 50%
3. PDR:
a. Number of data for training: 36
b. Number of data for testing: 19
c. Accurately Classified: 17
d. Accuracy: 89.47%
Available Online at www.ijpret.com 285 SVM classifier:
1 Normal:
a. Number of data for training: 7
b. Number of data for testing : 20
c. Accurately Classified: 15
d. Accuracy: 75%
1. NPDR:
a. Number of data for training: 13
b. Number of data for testing :16
c. Accurately Classified:11
d. Accuracy: 68.75%
2. PDR:
a. Number of data for training: 36
b. Number of data for testing : 19
c. Accurately Classified: 17
d. Accuracy: 89.5
From above, it is observed that 75% classification accuracy has been obtained for normal images whereas the DR images gave an accuracy of 68.75% and 89.50% respectively. Thus the abnormality detection is done with higher accuracy.
CONCLUSION:
Available Online at www.ijpret.com 286
are calculated and feed to both SVM and KNN classifier. SVM classifier is better classifier than KNN. So from the extracted feature it directly concludes the disease grade as normal, moderate and severe. So earlier detection and diagnosis of Diabetic retinopathy help the patients from vision loss and also the severity of Disease can be decreases. As combined dataset our specificity is 100% and sensitivity is more than 90% for SVM.
REFFERENCES:
1. Sohini Roychowdhury, "DREAM: Diabetic Retinopathy Analysis Using Machine Learning", IEEE Journal of Biomedical and Health Informatics, Vol. 18, No. 5, September 2014.
2. Mahendran Gandhi et.al“Diagnosis of Diabetic Retinopathy Using Morphological Process and SVM Classifier” IEEE International conference on Communication and Signal Processing, April 3-5, 2013.
3. Li Yafen et. al. “Automated Identification of Diabetic Retinopathy Stages Using Support Vector Machine” proceeding of the 32nd Chinese control conference 2013, Xi‟an, china.
4. Dr. R Geetha Ramani et al. "Data Mining Method of Evaluating Classifier Prediction Accuracy in Retinal Data" IEEE International Conference on Computational Intelligence and Computing Research, 2012.
5. Anderson Rocha, Tiago Carvalho, Herbert F. Jelinek, Siome Goldenstein, and Jacques Wainer, ‘Points of Interest and Visual Dictionaries for Automatic Retinal Lesion Detection’, IEEE Transactions on Biomedical Engineering, Vol. 59, No. 8, pp. 2244 - 2253, 2012.
6. Atul Kumar, Abhishek Kumar Gaur, Manish Srivastava, ‘A Segment based Technique for detecting Exudate from Retinal Fundus image’, Procedia Technology, Vol. 6, pp. 1 – 9, 2012. 7. Haniza Yazid, Hamzah Arof, Hazlita Mohd Isa, ‘Exudates segmentation using inverse surface adaptive thresholding’, Measurement, Vol. 45, No. 6, 2012, pp. 1599–1608, 2012. 8. C. JayaKumari, R. Maruthi, ‘Detection of Hard Exudates in Color Fundus Images of the Human Retina’, Procedia Engineering, Vol.30, pp. 297 – 302, 2012.
9. L. Giancardo, F. Meriaudeau, T. Karnowski, K. Tobin, E. Grisan, P. Favaro, A. Ruggeri, and E. Chaum, “Textureless macula swelling detection with multiple retinal undusimages,” IEEE Trans. Biomed. Eng., Vol. 58, No. 3, pp. 795–799, Mar. 2011.
10. C. Agurto, V. Murray, E. Barriga, S.Murillo, M.Pattichis, H. Davis, S.Russell, M.Abramoff, and P. Soliz, “Multiscale am-fm methods for diabetic retinopathy lesion detection,” Medical Imaging, IEEE Transactions, vol. 29, No. 2, pp. 502 –512, Feb. 2010.
Available Online at www.ijpret.com 287