ALDERSON, Andrew <http://orcid.org/0000-0002-6281-2624>, ALDERSON, Kim L., MCDONALD, Samuel A., MOTTERSHEAD, Beth, NAZARE, Shonali, WITHERS, Philip J. and YAO, Yong T.
Available from Sheffield Hallam University Research Archive (SHURA) at: http://shura.shu.ac.uk/7197/
This document is the author deposited version. You are advised to consult the publisher's version if you wish to cite from it.
Published version
ALDERSON, Andrew, ALDERSON, Kim L., MCDONALD, Samuel A.,
MOTTERSHEAD, Beth, NAZARE, Shonali, WITHERS, Philip J. and YAO, Yong T. (2013). Piezomorphic materials. Macromolecular Materials and Engineering, 298 (3), 318-327.
Copyright and re-use policy
See http://shura.shu.ac.uk/information.html
Sheffield Hallam University Research Archive
DOI: 10.1002/mame.201200028
Article type: Full Paper
Title
aPiezomorphic materialsAndrew Alderson*, Kim L. Alderson, Samuel A. McDonald, Beth Mottershead, Shonali Nazare, Philip J. Withers, Yong T. Yao
–––––––––
Prof. A. Alderson, Prof. K. L. Alderson, Dr B. Mottershead, Dr S. Nazare,
Institute for Materials Research and Innovation, University of Bolton, Deane Road, Bolton, BL3 5AB, UK
E-mail: [email protected] Prof. P. J. Withers, Dr. S. A. McDonald
Henry Moseley X-ray Imaging Facility, School of Materials, University of Manchester, Grosvenor Street, Manchester, M1 7HS, UK
Dr Y. T. Yao
National Key Laboratory of Science and Technology on Advanced Composites in Special Environments, Harbin Institute of Technology, Harbin150080, China
–––––––––
The development of stress-induced morphing materials which are described as piezomorphic
materials is reported. The development of a piezomorphic material is achieved by introducing
spatial dependency into the compliance matrix describing the elastic response of a material
capable of undergoing large strain deformation. In other words, it is necessary to produce an
elastically gradient material. This is achieved through modification of the microstructure of
the compliant material to display gradient topology. Examples of polymeric (polyurethane)
foam and microporous polymer (expanded polytetrafluoroethylene) piezomorphic materials
aSupporting Information
is available at Wiley Online Library or from the author. A.A. and K.L.A. conceived the piezomorphic foam concept. A.A. and P.J.W. conceived the combined programme of processing-structure-properties relationships in foam materials. A.A. and K.L.A supervised the design, PU foam/ex-PTFE fabrication, and mechanical properties characterisation aspects of the project. P.J.W. supervised the topology characterisation aspects of the project. S.N. performed the foam fabrication activity. S.A.M. performed the X-ray
are presented here. These materials open up new morphing applications where dramatic shape
changes can be triggered by mechanical stress.
Introduction
Morphing materials are those which undergo a smooth transition from one shape into another
which can be triggered by, for example, electrical, chemical or optical stimuli. The venus fly
trap is an example of a naturally-occurring morphing material in which the presence of the fly
triggers a flow of ions within the plant to effect electrochemical morphing action.[1]
Man-made morphing materials include those which are triggered by electrical (e.g. piezoelectrics [2-4]
), magnetic (e.g. magnetostrictive[5-7]), thermal (e.g. shape memory[8-10]), chemical[11] or
optical (e.g. shape memory polymers[12-14]) stimuli. Here, we report materials (as distinct from
layered or truss-like structures) which undergo an elastic morphing function in response to an
applied uniaxial mechanical stress, which we describe as piezomorphic materials.
Our use of piezomorphic to describe mechanically-activated morphing materials
incorporates the terms ‘morphic’ (the ability to deform and undergo a smooth transition from
one shape into another) and ‘piezo’ (in response to a mechanical stress) and is analogous to
the piezoelectric and piezochromic descriptors, respectively, for stress-induced electrical and
pressure-induced colour change materials.
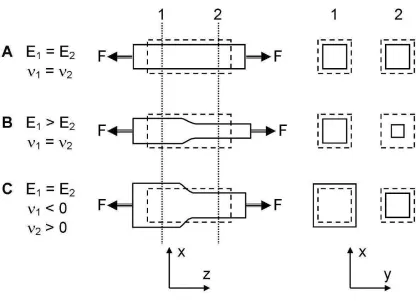
When a tensile (or compressive) uniaxial stress is applied to an elastic material it
undergoes axial extension (or contraction) determined by the Young’s modulus (E) of the
material in the loading direction, accompanied by transverse deformation determined by the
Poisson’s ratio (ν) of the material. In the most general anisotropic case, the presence of
non-zero shear coefficients in the compliance matrix may also lead to a shearing of the material in
response to a uniaxial load, as is the case for unbalanced composite laminates. However,
substantially uniform along the length of the material (neglecting end effects due to clamps,
grips etc) as shown in Figure 1A. Materials whose bulk elastic response can be described by a
single unique compliance matrix at any point in time do not, therefore, undergo a morphing
action in response to a simple uniaxial applied stress.
[Figure 1 here]
Now consider a linear elastic material of uniform Poisson’s ratio in which the Young’s
modulus varies along the length of the material such that the Young’s modulus in one half
differs from that in the other half (Figure 1B). The lower modulus half deforms to higher axial
strain (εL) in response to an applied axial stress (σ), given by
E L
σ
ε = (1)
with a concomitant larger change in transverse strain (εT),
L T νε
ε =− (2)
due to the uniform value of Poisson’s ratio. In this case the cross-sectional shape remains the
same for the two halves, but the size differs, leading to a change in shape along the length of
the material. In other words it undergoes a stress-induced shape change along its length and is,
therefore, a piezomorphic material.
Alternatively, we can consider the case where the material has a uniform Young’s
modulus, but the Poisson’s ratio differs from one half to the other (Figure 1C). Now both
halves of the material naturally undergo the same level of axial strain, but exhibit different
transverse strains due to the different Poisson’s ratios. Again, a change in cross-section size
and, therefore, shape along the length is realised leading to a piezomorphic response.
We have achieved controlled morphing behaviour in practice by tailoring both Young’s
possibilities since their structure-elastic properties relationships are reasonably well
understood[15] and capable of large variations. Methods have been developed previously to
modify the structure and elastic properties of open cell polymeric and metallic foams.[16-19] In
particular, Lakes reports the conversion of a conventional positive Poisson’s ratio open cell
thermoplastic (polyester) foam into one displaying isotropic negative Poisson’s ratio (auxetic)
response (corresponding to axial and transverse dimensions both expanding under an applied
tensile axial load).[16] This is achieved by simultaneously applying uniform axial
compressions along all three principal axes whilst heating the foam in the vicinity of the
softening point for a suitable period of time (typically in the range 10 to 20 minutes). As a
result of this process, the foam microstructure adopts a more convoluted topology which
becomes ‘fixed’ (frozen in) upon subsequent cooling below the softening temperature.[20] The
negative Poisson’s ratio is derived from this more contorted, re-entrant and higher density
microstructure than is present in the unconverted foam.[16,20]
Variants of the process have subsequently explored different compression regimes
offering significant control over structure and elastic response.[18,19,21] For example, biaxial
compression during the conversion process leads to the production of foams having highly
anisotropic Young’s moduli and Poisson’s ratios.[21] To date, essentially uniform linear
compression regimes have been employed (i.e. the unconverted form has essentially the same
shape but different dimensions to the compression mould used in the conversion process).
To achieve gradient structure and elastic properties in a thermoplastic open cell foam,
we introduce non-uniform linear compression regimes into the thermo-mechanical foam
conversion process by employing a starting polyurethane (PU) foam cut to a different shape to
the compression mould (Figure 2A and 2B). The dimensions of the unconverted foam are
chosen (see Experimental Section) so that when inserted into the end-tabbed mould the
whereas the thicker end of the foam undergoes significant biaxial transverse compressive
strain.
[Figure 2 here]
Such behaviour is not limited to thermoplastic polymeric foams. A microporous form of
expanded polytetrafluoroethylene (ex-PTFE) can also be processed to show piezomorphic
behaviour. This material is known to possess a negative Poisson’s ratio following
pre-conditioning of conventional (positive Poisson’s ratio) ex-PTFE. The pre-pre-conditioning is
required to provide an ordered microstructure prior to testing and consists of
through-thickness compression and axial expansion by hand of the sample. By applying a uniform
compression in the through-thickness direction,negative Poisson’s ratios as large as -12 have
been achieved depending on the level of pre-conditioning compression and applied strain
during testing.[22,23]
Following the previously reported process for producing auxetic ex-PTFE,[22,23] we
apply pre-conditioning in the form of a series of uniform through-thickness compressions and
uniaxial tensions by hand to produce a repeatable and uniform sample of ex-PTFE as a
reference sample. To create piezomorphic ex-PTFE we develop the previously reported
process for uniform auxetic ex-PTFE to incorporate the application of non-uniform
compressions for the creation of wedge-shaped and hour-glass shaped samples having
gradient elastic properties. Finally to create an ex-PTFE sample having a regular rectangular
shape prior to deformation we apply a non-uniform compression followed by cutting of the
sample to the required rectangular shape. Figure 2C-2F shows schematically the four samples
of ex-PTFE developed in this work, and further details on the sample preparation are provided
Experimental Section
Polyurethane Foam Fabrication
Low density PU foam (Custom Foams, designated by R45FR, 45 pores/inch, density =
26-32 kg/m3) was cut into a form comprising thick and thin square cross-sections at the ends, and
a short tapered intermediate section between the thick and thin cross-section ends (Figure
2A). The foam was then inserted into a metallic square cross-section tube (Figure 2B) and end
tabs secured over the free ends of the mould. The dimensions of the starting foam and metallic
tube are given in Figure 2, and correspond to linear compression ratios of 0.70 and 1.0 being
applied to the transverse dimensions of the thick and thin ends of the foam, respectively, when
inserted into the tube. An overall linear compression ratio of 0.83 was applied along the
length of the foam. The mould containing the foam was then placed in an oven at a
temperature of 190ºC for 15 minutes. The foam was then removed and relaxed to avoid
adhesion of ribs and to minimise surface creasing. The foam was then reinserted into the
mould and returned to the oven at 190ºC for a further 10 minutes, followed by 20 minutes at
100ºC.
Ex-PTFE Samples Fabrication
The ex-PTFE reference sample was produced by subjecting a strip of ex-PTFE to a
pre-conditioning series of uniform compressions (Figure 2C) and uniaxial tensions by hand to
produce a repeatable and uniform sample. The sample had dimensions of 56mm long by
11.5mm wide by 4mm thick. To produce the PTFE wedge-shaped sample a strip of
ex-PTFE of length 56mm long and thickness 4mm was subjected to non-uniform compression by
taken to avoid out-of-plane deformation and the sample retained the wedge shape in the
free-standing state. The wedge-shaped profile of the specimen placed in the testing machine is
shown in Figure 7B (εL = 0) of the Results section, with minimum width ~ 8.7mm towards
one end and maximum width ~ 15.2mm towards the other end of the converted sample. The
ex-PTFE hourglass-shaped sample was produced by subjecting a strip of ex-PTFE of
dimensions 56mm long by 4mm thick to non-uniform compression by hand in two locations
on each side of the sample in the width-wise direction. Each location was in phase with
(directly opposite to) the equivalent location on the opposite side (see Figure 2E). Care was
taken to avoid out-of-plane deformation and the sample retained the imposed hourglass shape
in the free-standing state. The hourglass-shaped profile of the converted specimen placed in
the testing machine is shown in Figure 7C (εL = 0), with minimum width ~ 8.5mm to one side
of the bulge in the middle of the sample having maximum width ~ 10.9mm. To produce the
ex-PTFE modified rectangular sample a compression was applied using the flat end of a small
cylindrical object in the width-wise direction to the middle of one surface of an initially
rectangular shaped strip of ex-PTFE of dimensions 56mm long by 7.5mm wide by 5mm thick.
Care was taken to avoid out-of-plane deformation. The compression caused an indentation
(~2-2.5mm) in the strip, with its depth defining a cut line (see Figure 2F). The sample was cut
along this line, removing the indented surface so that a rectangular strip was again formed.
The rectangular profile of the converted specimen placed in the testing machine is shown in
Figure 7D (εL = 0), with width ~ 5.1mm towards one end and width ~ 5.3mm in the middle of
the sample.
X-ray Microtomography
X-ray microtomography measurements were carried out using an Xradia MicroXCT system.
projections over 180°. Optics comprising a 4× magnification objective lens focussing onto a
2000×2000 pixel 16-bit CCD detector were used, giving a voxel size in the reconstructed
volume of 4.95µm (using a camera binning of 2, i.e. 1000×1000 pixels). Virtual isosurface
renderings were created by joining 3 separate volumes along the height of the sample and
across the transition region.
Mechanical Properties
Combined videoextensometry and tensile testing were employed to determine the bulk
deformation response of the PU foam and ex-PTFE samples in uniaxial tension.
Axial and transverse dimensions of the PU foam were measured using a
MESSPHYSIK ME 46 videoextensometer during mechanical testing in an Instron 3369
testing machine fitted with a 100 N load cell. The videoextensometer software determined
the axial and transverse length data by tracking the change in the contrast between the edges
and background as strain was applied to the specimen. Transverse width data were collected
for 10 evenly spaced segments along the length of the foam, allowing both individual segment
and average width data to be generated. Cardboard end-tabs were glued to the foam to allow
clamping in the jaws of the Instron testing machine. The samples were tested at a strain rate of
10 mm/min.
The ex-PTFE samples were each placed in the grips of an Instron 3369 mechanical
testing machine fitted with a 100 N load cell and subjected to tensile testing at a strain rate of
2 mm/min. A series of video stills were taken during each tensile test and longitudinal and
transverse dimensional variations determined using a Messphysik ME 46-NG
videoextensometer.
Polyurethane Foam
Figure 3 shows X-ray tomography images in the x-z and y-z planes (z being the long axis of
the foam and mould) of the converted PU foam structure in the vicinity of the transition
region from the initially thick to thin cross-section of the unconverted foam. The images show
a clear transition from the open cell foam structure characteristic of a conventional positive
Poisson’s ratio foam material (top of image) to the higher density re-entrant foam structure
characteristic of foam materials displaying negative Poisson’s ratio response (bottom of
image). Supplementary movie S1 looks through the structure of the three-dimensional
scanned section of the converted foam. A topologically-gradient foam is evidently produced.
[Figure 3 here]
The converted foam sample has a uniform square cross-section in the relaxed state,
with dimensions given approximately by the internal dimensions of the compression mould
(minor changes in linear dimensions occur as the foam is cooled from the elevated
temperatures used in the conversion process), as shown in Figure 4A. The region of
compressed foam in the conversion process appears slightly darker in the bulk sample with
respect to the relatively uncompressed region as a result of the increase in foam density of the
compressed region.
[Figure 4 here]
Figure 4 shows the foam on removal from the mould (A), before (B) and during (C)
from regular elongated cuboid to a square cross-section ‘bottle-shape’ in which one end
decreases in width and the other end expands in width. In other words, the foam morphs from
one form (regular elongated cuboid) to another (square cross-section bottle-shape) upon the
application of a uniaxial stress. The foam is elastic and recovers the regular elongated
cuboidal form on release of the stretch. Supplementary movie S2 shows the morphing
response.
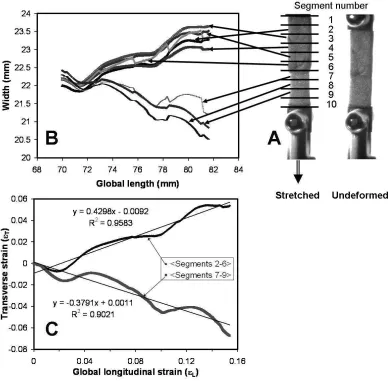
Figure 5A shows the shape change under a more controlled tensile test, before (RHS)
and during (LHS) stretching from it natural length of 70 mm in a universal testing machine.
Video-extensometry measurements of the width variations along the length of the foam as it is
subject to uniaxial tension are shown in Figure 5B. The video-extensometer software divides
the foam into 10 segments of equal segment length along the length of the foam, the middle 8
of which are plotted in Figure 5B (the outermost segments being omitted due to edge effects
associated with lateral constraint arising from the end-tabs). The two halves of the foam show
contrasting lateral deformations; one half (sections 2-6) showing reasonably uniform
transverse expansion (negative Poisson’s ratio), and the other half (sections 7-9) showing
uniform transverse contraction (positive Poisson’s ratio).
[Figure 5 here]
To determine the Poisson’s ratio of the two regions of the foam, the axial and
transverse true strains are first calculated using
= 0 ln d d d ε (3)
where εd is the strain, and d and do are the instantaneous length and the original length,
respectively, of the foam in the direction (axial or transverse) of interest. The axial length is
global length into segments of equal length throughout the test. The Poisson’s ratio ν is
calculated as the negative of the slope of the transverse true strain vs axial true strain graph
for loading along the axial direction (see equation (2)). Figure 5C shows the transverse true
strain calculated from the average of the width measurements for segments 7 to 9 plotted as a
function of the global axial true strain. The slope of the least squares best fit line (also
included in Figure 5C) yields an average value of the Poisson’s ratio for the positive Poisson’s
ratio region of ν = +0.38 ± 0.13 (the quoted uncertainty corresponds to the standard deviation
calculated from the measured Poisson’s ratios of the individual segments). Similarly, from the
corresponding transverse true strain data for segments 2-6, also included in Figure 5C, the
auxetic region of the foam has a measured average Poisson’s ratio of -0.43 ± 0.06.
Expanded PTFE
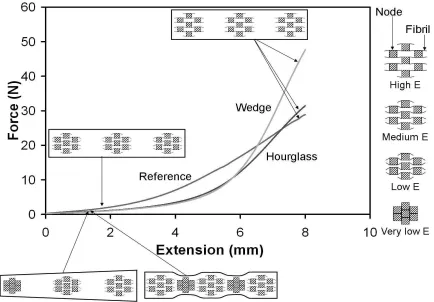
Figure 6 shows the load vs displacement data from the tensile testing of the reference, wedge
and hourglass ex-PTFE samples. All the curves have an initially shallow slope which
increases significantly at intermediate and high extensions. The wedge and hourglass samples
display lower initial slopes than the reference sample, indicating they have lower stiffness
than the reference sample at low extension.
[Figure 6 here]
The initially rectangular reference ex-PTFE sample (previously subject to low-level
uniform compression pre-conditioning) maintains a uniform rectangular shape during tensile
testing (see Figure 7A) and displays a strain-dependent incremental Poisson’s ratio response,
determined from the slope of the transverse true strain vs longitudinal true strain data (not
0
=
L
ε and 0.18 (corresponding to the initial and high extension regions, respectively) is
indicated in Figure 7A, from which a transverse strain of εT =0.24 is determined when
18 . 0
=
L
ε . To enable comparison with the subsequent ex-PTFE samples produced, the
Poisson’s ratio calculated from the total strains (using Equation (2)) at εL =0.18 is thus
calculated to be -1.31 and is also shown on Figure 7A.
[Figure 7 here]
Figure 7B shows the response of the converted wedge-shaped sample, which displays
shape memory behaviour triggered by the application of uniaxial tensile stress. The converted
(wedge-shaped) sample undergoes non-uniform deflection of the sample and is transformed
back into the rectangular shape of the pre-converted sample by the end of the test. The sample
clearly demonstrates a gradient Poisson’s ratio response. The transverse strains at εL =0.18
for the initially narrowest and widest regions of the sample correspond to Poisson’s ratios of
-3.35 and -0.57, respectively (Figure 7B).
Similarly, the converted hourglass-shaped sample also displays stress-induced shape
memory response and gradient elasticity having Poisson’s ratios of -3.12 and -1.83 when
18 . 0
=
L
ε for the initially narrowest and widest (middle) sections (Figure 7C).
The converted ex-PTFE rectangular strip formed by cutting to shape of an ex-PTFE
sample subject to non-uniform compression (Figure 2F), adopts a non-regular (bulge) shape
when a uniaxial tensile stress is applied (see Figure 7D), again displaying piezomorphic
response and gradient elasticity. The magnitude of the negative Poisson’s ratio is largest at the
mid-point of the sample and reduces towards the sample ends (ν = -2.31 and -1.34,
The wedge-shaped, hourglass-shaped and rectangular ex-PTFE test specimens shown in
Figure 7B-7D clearly display piezomorphic behaviour as a result of gradient mechanical
properties (i.e. Poisson’s ratios) along and/or transverse to the loading direction introduced in
the regions where compression is applied during the conversion process. Supplementary
movies S3-S6 show the controlled tensile tests of the reference and piezomorphic wedge,
hourglass and rectangular ex-PTFE samples.
Discussion
Foams
The measured effective Poisson’s ratios of the conventional and auxetic regions of the
piezomorphic foam (ν = +0.38 ± 0.13 and -0.43 ± 0.06, respectively) compare with values of
ν = +0.31 and -0.21, respectively, reported for the same foam without conversion and after
undergoing uniform tri-axial compression using a linear compression ratio (the converted to
unconverted dimension ratio) of 0.67 in all 3 principal directions under the same conversion
heating regime.[24] The conventional region of the piezomorphic foam undergoes substantially
no transverse compression but some axial compression (global linear compression ratio for
the whole piezomorphic foam of 0.83 is applied along the length of the foam during the
conversion process). The auxetic region of the piezomorphic foam undergoes some
compression axially and also significant biaxial transverse compression (transverse linear
compression ratio of 0.70). The slight discrepancies between the piezomorphic foam
Poisson’s ratios and those of the previously reported foams are likely then to be attributable in
part to the different compression regimes experienced in the different foam locations during
the piezomorphic foam conversion process compared to the unconverted and triaxial
The Young’s modulus of a foam is also known to be modified to different degrees by
different compression regimes during the conversion process.[21] In this work the effective
Poisson’s ratios have been determined from the measured local transverse and global
longitudinal strains. Any variation in the Young’s modulus along the length leads to
non-uniform strain along the length of the foam. This is, then, likely to also be a contributory
factor to the slight discrepancies in the Poisson’s ratios of the piezomorphic and previously
reported foams since, in the piezomorphic foams, the assumption that the global strain is a
reasonable measure of the local strain is unlikely to be valid. Nevertheless, the analysis
presented in this paper clearly demonstrates successful development of piezomorphic
materials. A more detailed analysis of the elastic response in piezomorphic foams, employing
more sophisticated strain mapping procedures than used in this work, will be reported in due
course.
An alternative process for the modification of foam microstructure and properties has
recently been reported in which the role of temperature in Lakes’ process is replaced by
immersing the foam in a solvent.[25] The solvent causes the foam to swell and soften prior to
compression in a smaller mould, whereupon the softened foam microstructure transforms into
that required for auxetic behaviour. The new foam microstructure is then ‘frozen in’ by drying
of the foam prior to removal from the mould. Clearly, the use of a mould having different
shape to that of the softened foam can also be employed in the solvent-based conversion route
to produce piezomorphic foams.
Methods exist to modify the structure and elastic properties of thermosetting polymer
and metallic open cell foams,[17] and these can be easily adapted to include non-uniform
compression regimes for the production of gradient structure and elastic properties. Gradient
open cell ceramic foams may also be prepared through coating of a sacrificial gradient
thermoplastic open cell foam with an appropriate ceramic material (for example by dipping
While the morphing demonstrated here is rather primitive, more useful (and complex)
morphing responses in foams can be engineered in a similar manner, see section 3.3.
Ex-PTFE
The strain-dependent elastic response of auxetic PTFE is attributed to an internal
microstructure of nodules interconnected by a network of high tensile stiffness fibrils.[22,23]
Simple 2D and 3D analytical models which assume a regular array of rectangular/cuboidal
nodules interconnected by fibrils attached to the corners of the nodules, with deformation by
rotation and stretching of the fibrils in response to an applied mechanical load, have been
found to reproduce the essential features of the strain-dependent Young’s modulus and
Poisson’s ratio responses in ex-PTFE (and other auxetic microporous polymers such as
ultra-high molecular weight polyethylene) remarkably well.[26-30]
The key to the right hand side of Figure 6 shows schematics of such an idealized 2D
nodule-fibril model network. The fully-dense structure at the bottom of the key has the
interconnecting fibrils oriented vertically. A tensile load applied horizontally to this structure
(i.e. perpendicular to the fibril orientation) induces a moment on the fibrils and causes the
structure to deform via rotation (hinging) of the fibrils. Initially this is a low energy (low
Young’s modulus) mode of deformation since all the applied load acts to rotate the fibrils. As
the fibrils rotate, they begin to align towards the loading direction, and the structure opens up
transversely as well as axially due to the hinging mode (corresponding to progressing up the
key on the right hand side of Figure 6). Hinging becomes progressively harder to achieve
since the component of applied force inducing the moment on a fibril (i.e. the component of
force acting perpendicular to the fibril axis) reduces as the fibril increasingly aligns along the
loading direction. In other words, the Young’s modulus increases as fibril hinging progresses
length of each fibril increases as hinging progresses, causing stretching along the length of the
(stiff) fibrils to become a significant mode of deformation at medium-to-high applied loads.
At the highest applied loads the fibrils are aligned along the loading direction and deformation
is by stretching of the fibrils, corresponding to a high Young’s modulus for the nodule-fibril
network.
Turning now to the load-displacement responses of the ex-PTFE samples studied in
this work, the reference sample displays the load-displacement behaviour expected from a
nodule-fibril network having an initial uniform structure characterized by an intermediate
fibril angle (corresponding to medium Young’s modulus) due to the uniform low-level
compression pre-conditioning stage applied to this sample. Increased applied load causes an
increase in the slope of the load-displacement curve due to the stiffening effects associated
with hinging and stretching of fibrils which become increasingly aligned with the loading
direction. The schematics associated with the reference sample in Figure 6 show the idealized
2D nodule-fibril network corresponding to the low and high extension regions for this sample.
The wedge-shaped and hourglass-shaped samples both initially possess regions having
high compression applied to them during the conversion process. These regions correspond to
high density nodule-fibril microstructures in which the fibrils are aligned along the
compression direction during conversion, i.e. perpendicular to the subsequent loading
direction employed during testing (see schematics in Figure 6). These regions, therefore,
account for the lower stiffness of these samples compared to the reference sample at low
extension. The lower Young’s modulus locations along the length of the wedge-shaped and
hourglass-shaped samples undergo most of the deformation (via fibril hinging) at low to
intermediate extensions, until the nodule-fibril structure becomes more uniform and
deformation occurs via high stiffness hinging and stretching of fibrils oriented towards the
The development of these new piezomorphic materials now requires a theoretical
description which captures the spatial dependency of the elastic response. Consequently, we
expect appropriate theoretical treatments for piezomorphic materials will utilise, for example,
strain-gradient theories[31-33] in which the scale-independent classical elasticity continuum
theory is extended to include one or more material-characteristic lengths to account for spatial
variations in the underlying microstructure. The initial interpretation introduced above links
the gradient macroscopic response of the ex-PTFE samples to the nodule-fibril microstructure
via the idealized 2D nodule-fibril model previously reported for microporous polymers. This
carries promise in terms of developing a macroscale continuum formulation in which the
constitutive response is provided by micromechanical models having different geometries at
different points in the material. Similarly, the x-ray tomographic imaging of piezomorphic
foams presented in this paper provides a geometrical basis for the development of a
macroscopic continuum description in which the properties of points in the material are given
by existing analytical and/or finite element microstructural models for foams.
Potential applications for piezomorphic materials
Morphing materials are attracting significant interest for their potential in applications such as
aerospace, in morphing aircraft skins[34], and biomedical, in artificial muscles using ionic
polymer-metal composites[35] or electroactive polymers[36]. Piezomorphic materials extend the
range of morphing material applications to include those which exploit the potential of a
stress-induced trigger. A few examples are provided here to illustrate the wide breadth of
applications we envisage for piezomoprhic materials.
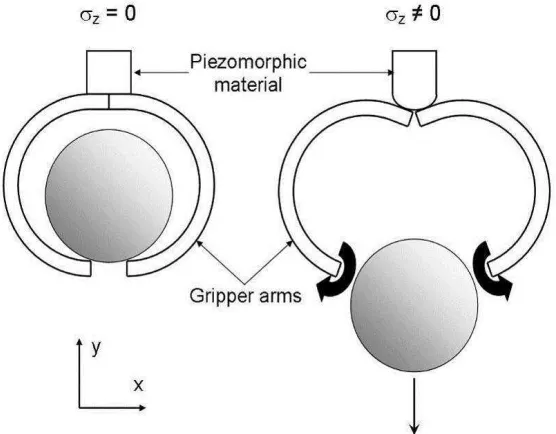
Piezomorphic materials may act as the actuator element in, for example, microgripper
devices (Figure 8). In Figure 8, the piezomorphic material has an undeformed rectangular
undergoes shape change through the development of a convex bulge to one side (i.e. similar to
the modified rectangular PTFE sample reported in this paper). In the proposed device, gripper
arms are attached to the surface of the piezomorphic material. Upon a stress applied along the
length of the piezomorphic material the change in cross-section shape acts to open the gripper
arms to enable release of stored material. Release of the stress results in the gripper arms
closing with the potential to grip or store a guest material.
[Figure 8 here]
A smart bandage incorporating a porous auxetic component containing a guest active
pharmaceutical ingredient (API), such as an anti-inflammatory agent, has previously been
proposed by some of the authors in which release of the API to the wound occurs through
opening of the pores of the auxetic material when the bandage is stretched by wound
swelling[37]. A bandage incorporating a gradient auxetic foam having a distribution of pore
sizes would enable controlled release of the API over a period of time rather than
instantaneous release from a uniform pore size material.
The application of a stress to actively change the shape of a compliant piezomorphic
material could be employed in adaptive airfoils for the modification of wing shape to achieve
optimal aerodynamic performance in morphing aircraft.
Foam inserts are used in intimate apparel garments such as bra cups to provide support,
comfort and fit. During vigorous exercise and/or periods of significant variations in breast
size (e.g. breast feeding mothers) there are significant changes in the dimensions and shape of
the breast. The foam insert is required to expand in certain regions of the insert and contract in
others to maintain optimum fit, comfort and conformability. A piezomorphic foam enables
Prosthetic limb sockets are susceptible to variations in stump volume, which leads to a
loosening of the prosthetic limb and deleterious consequences in terms of wearer compliance,
skin irritation, tissue breakdown and discomfort. A piezomorphic material lining capable of
undergoing adjustable volume and tailored uneven deformation to compensate for stump
volume variations will maintain fit to minimise the aforementioned deleterious effects.
Piezomorphic foams may be utilised as deployable/removable cores in the manufacture
of closed and semi-closed composite structures often having complex shapes. The use of a
piezomorphic foam enables the foam to be in a shape/size to facilitate insertion prior to
expansion into the mould cavity in the mechanically-stressed form. Release of the mechanical
load then returns the foam back to a form to facilitate easy extraction from the final part.
A piezomorphic fixation device material will change shape in response to the stress
from an object attached to the external end of the fixation device, the change in shape thus
resisting the tendency for pull-out of the device.
Gradient materials also have potential in impact energy absorbing components. Auxetic
materials are known to have enhanced impact energy absorption response[38]. The auxetic
property also acts to concentrate the incident impact energy local to the region of the material
under the impacting object[38]. It is, therefore, desirable to have regions of an impact absorber
that are auxetic (to absorb the energy) and non-auxetic (to diffuse or disperse the impact
force). A one-piece gradient foam having regions of negative and positive Poisson’s ratio, as
reported here, provides an elegant and practical alternative to existing multi-layers systems.
We expect the development of elastically gradient materials will stimulate
developments of other forms of piezomorphic materials, leading to new and improved
materials for an expanded range of applications.
We have produced open-cell PU foams and microporous ex-PTFE samples displaying
gradient elastic properties and the ability to undergo large strain shape change under an
applied uniaxial stress. The term piezomorphic materials has been introduced to describe
these new materials where shape change is triggered by an applied stress. The mechanical
properties and deformation profiles were measured using combined videoextensometry and
uniaxial tensile testing. The gradient elastic responses have been related to gradient material
microstructure using x-ray microtomography (PU foams) and existing micromechanical
models (ex-PTFE), with the gradient microstructures being produced by uneven compression
during the conversion routes from the as-found conventional starting materials. We envisage
many future possibilities for such materials using more sophisticated morphing geometries.
Acknowledgements: EPSRC funding of the X-ray Imaging Facility is acknowledged under
EP/F007906 and EP/I02249X. Aspects of this work have been disclosed to the Intellectual
Property Panel at the University of Bolton and a patent application has been submitted.
Received: ((will be filled in by the editorial staff)); Revised: ((will be filled in by the editorial
staff)); Published online: DOI: 10.1002/mame.201200028
Keywords: auxetic, piezomorphic, polytetrafluoroethylene (PTFE), polyurethane (PU) foam,
structure-property relations
[1] D. Hodick, A. Sievers, Planta1989, 179, 32.
[2] R. F. Gibson, Composite Structures2010, 92, 2793.
[3] S. Tadigadapa, K. Mateti, Meas. Sci. Technol.2009, 20, 092001.
[5] G. P. McCombe, J. A. Etches, I. P. Bond, P. H. Mellor Journal of Intelligent Material
Systems and Structures2009, 20, 1249.
[6] J. A. Etches, I. P. Bond, P. H. Mellor, Smart Mater. Struct.2006, 15, 288.
[7] T. A. Duenas, G. P. Carman, J. Appl. Phys.2000, 87, 4696.
[8] J. Van Humbeeck, Adv. Eng. Mater.2001, 3, 837.
[9] Z. G. Wei, R. Sandström, S. Miyazaki, J. Mater. Sci.1998, 33, 3743.
[10] D. Ratna, J. Karger-Kocsis, J. Mater. Sci.2008, 43, 254.
[11] M. Motornov, J. Zhou, M. Pita, V. Gopishetty, I.. Tokarev, E. Katz, S. Minko, Nano
Lett.2008, 8, 2993.
[12] H. Finkelmann, E. Nishikawa, G. G. Pereira, M. Warner, Phys. Rev. Lett.2001, 87,
015501.
[13] M. Camacho-Lopez, H. Finkelmann, P. Palffy-Muhoray, M. Shelley, Nature Materials
2004, 3, 307.
[14] A. Lendlein, H. Jiang, O. Jünger, R. Langer, Nature2005, 434, 879.
[15] L. J. Gibson, M. F. Ashby, Cellular solids, Structure and Properties, Cambridge
University Press, Cambridge, second edition, 1997.
[16] R. Lakes, Science1987, 235, 1038.
[17] E. A. Friis, R. S. Lakes, J. B. Park, J. Mater. Sci.1988, 23, 4406.
[18] N. Chan, K. E. Evans, J. Mater. Sci.1997, 32(22), 5945.
[19] F. Scarpa, P. Pastorino, A. Garelli, S. Patsias, M. Ruzzene, Phys. Stat. Sol (B)2005,
242(3), 681.
[21] A. Alderson, K.L. Alderson, P.J. Davies, G.M. Smart, Proceedings of the ASME
Aerospace Division 2005, vol. 70AD, p. 503 (American Society of Mechanical Engineers,
Aerospace Division (Publication) AD 2005).
[22] B. D. Caddock, K. E. Evans, J. Phys. D. Appl. Phys.1989, 22, 1877.
[23] K. E. Evans, B. D. Caddock, J. Phys. D. Appl. Phys. 1989, 22, 1883.
[24] S. A. McDonald, G. Dedreuil-Monet, Y. T. Yao, A. Alderson, P. J. Withers, Phys.
Stat. Sol. (B)2011, 248, 45.
[25] J. N. Grima, D. Attard, R. Gatt, R. N. Cassar, Adv. Eng. Mater. 2009, 11, 533.
[26] K. E. Evans, J. Phys. D: Appl. Phys. 1989, 22, 1870.
[27] A. Alderson, K. E. Evans, J. Mater. Sci. 1995, 30, 3319.
[28] A. Alderson, K. E. Evans, J. Mater. Sci. 1997, 32, 2797.
[29] K. L. Alderson, A. Alderson, K. E. Evans, J. Strain Analysis1997, 32, 201.
[30] N. Gaspar, C. W. Smith, A. Alderson, J. N. Grima, K. E. Evans, J. Mat. Sci. 2011, 46,
372.
[31] R. A. Toupin, Arch. Ration. Mech. Anal. 1962, 11, 385.
[32] R. D. Mindlin, Arch. Ration. Mech. Anal. 1964, 16, 51.
[33] C. Tekoglu, P. R. Onck, Journal of the Mechanics and Physics of Solids2008, 56,
3541.
[34] C. Thill, J. Etches, I. Bond, K. Potter, P. Weaver, Aeronautical Journal2008, 112, 117.
[35] M. Shahinpoor, K. J. Kim, Smart Mater. Struct.2001, 10, 819.
[36] Y. Bar-Cohen, J. Spacecraft Rockets2002, 39, 822.
[38] K. L. Alderson, V. R. Simkins, V. L. Coenen, P. J. Davies, A. Alderson, K. E. Evans,
Figure 1. Piezomorphic response in an elastically gradient material. (A) x-z and x-y
projections showing how an initially undeformed elongated cuboidal material (shown by the dashed outline) of uniform elastic properties (Young’s modulus, E, and Poisson’s ratio ν) undergoes a change in dimensions but retains shape (solid outline) in response to a uniaxial stress applied along the z direction – non-piezomorphic response. (B) an elastically gradient material having Young’s modulus in region 1 (E1) greater than that in region 2 (E2), but uniform Poisson’s ratio, undergoes a greater change in cross-section dimension in region 2 (x-y projection), leading to a change in shape in the x-z plane, under loading along the z
Figure 2. (A) schematic of the shape and dimensions of the unconverted PU foam. (B) dimensions of the square cross-section hollow metallic compression mould used in the
conversion of the starting PU foam into a gradient foam of elongated cuboid form. Schematics showing the compression regimes and converted shape for the conversion of initially
Figure 3. X-ray tomographs corresponding to scanned regions of 4.6 mm in the x and y directions and 13.8 mm in the z direction of the converted PU Foam. Virtual isosurface renderings in the x-z and y-z planes across the transition region in the converted foam
Figure 5. (A) Controlled tensile test showing the converted PU foam in the grips of the tensile testing machine in the undeformed and stretched states. Evenly spaced dividing lines along the length of the stretched foam have been overlaid on the image to indicate the width sections used by the video-extensometry software in the measurement of transverse
Figure 6. Force vs extension response under tensile testing of the reference, wedge and hourglass ex-PTFE samples. Schematics showing the expected idealised 2D rectangular nodule and interconnecting fibril network microstructure are shown at low and high
The table of contents entry
A new class of materials, called piezomorphic materials, displaying stress-induced shape
change (morphing) behaviour due to gradient microstructure and elastic properties is
reported and potential applications suggested across a wide range of disciplines. The figure
(Figure 3) shows the gradient topology of a piezomorphic polyurethane foam.
A. Alderson*, K. L. Alderson, S. A. McDonald, B. Mottershead, S. Nazare, P. J. Withers, Y. T. Yao
Topologically and elastically gradient piezomorphic materials
ToC figure
Copyright WILEY-VCH Verlag GmbH & Co. KGaA, 69469 Weinheim, Germany, 2011.
Supporting Information
for Macromol. Mater. Eng., DOI: 10.1002/mame.201200028
Piezomorphic materials
Andrew Alderson*, Kim L. Alderson, Samuel A. McDonald, Beth Mottershead, Shonali Nazare, Philip J. Withers, Yong T. Yao
Supporting online movie captions:
Movie S2. Morphing response of the topologically-gradient foam under uniaxial tension
(piezomorphic behaviour).
Movie S3. Controlled tensile testing of the reference ex-PTFE sample.
Movie S4. Controlled tensile testing of the piezomorphic wedge ex-PTFE sample.
Movie S5. Controlled tensile testing of the piezomorphic hourglass ex-PTFE sample.