Effects of Nb on the Microstructure and Elevated-Temperature
Mechanical Properties of Alloy 690-SUS 304L Dissimilar Welds
Sheng-Long Jeng
1, Hwa-Ten Lee
2, Jiunn-Yuan Huang
1and Roang-Ching Kuo
11
Institute of Nuclear Energy Research (INER), P. O. Box 3-14, 1000 Wenhua Road, Chiaan Village, Longtan, Taoyuan 32546, Taiwan, R. O. China
2Department of Mechanical Engineering, National Cheng Kung University, Tainan 701, Taiwan, R. O. China
The purpose of this paper was to investigate the effects of Nb on the microstructure and elevated-temperature mechanical properties of Alloy 690-SUS 304L dissimilar welds. The results show that the welds were dominant with dendrites and interdendritic phases. In the low Nb welds, the main interdendritic phases were Nb-rich and Al-Ti-rich phases. Cr-carbides were precipitated along the grain boundaries of the root region. In the high Nb welds, there were large Nb-rich phases in the cap region, while smaller Nb-carbonitride precipitates were found in the root region. The addition of Nb increased the hardness of the fusion zones. At 300C, though the tensile strengths of all welds were higher than that of 304L, micro-cracks were unexpectedly found in the low Nb weld. Notched specimens were tested to characterize the mechanical properties of the welds. Both of the yielding and tensile strengths of the welds increased with Nb additions. On the fracture surface, the brittle fracture features also became noticeable. [doi:10.2320/matertrans.MRA2008008]
(Received January 7, 2008; Accepted February 29, 2008; Published May 25, 2008)
Keywords: niobium, dissimilar weld, elevated temperature, shielding metal arc welding
1. Introduction
Stress corrosion cracking (SCC) of nickel-based alloys is an important safety issue of nuclear power plants. Many nickel-based alloy components of nuclear power plants have experienced intergranular stress corrosion cracking (IGSCC) in the past decades. Recently SCC was also found to occur in the interdendritic region of nickel-based welds where hot cracking often occurred and was thought to be the initiation site of cracks.1)It could be a special case but raised a concern about the corrosion resistance and mechanical properties of the nickel-based welds.
Nb has a higher affinity to carbon than Cr, so it could reduce the precipitation of Cr-carbides and the formation of Cr-depletion zone along the grain boundary to improve the corrosion resistance.2–4) When adding Nb in nickel-based alloys, NbC and Ni3Nb precipitates are commonly expected to enhance their elevated-temperature strengths.5)Although adding Nb can improve the corrosion resistance and elevated temperature mechanical properties, the degradation of weld-ability is an adverse effect. It is known that Nb will degrade the mechanical properties of weldments as a result of the precipitation of brittle Laves phases.6)The Laves phases are prone to form in an alloy with a high Nb/C ratio.7–9)Besides, the formation of Laves phases is reported to cause hot cracking.1,10)
Alloy 690 has gradually replaced Alloy 600 as a material for the components of nuclear power plants. With a proper heat treatment, it has been proved to have better corrosion resistance. Since some of its compatible weld metals in use, for instance, Alloy 152 and Alloy 182, have a Nb content of 12mass%, we are interested in the influence of Nb on the welds. Thus, it is intended to investigate the microstructure and mechanical properties of the welds with various Nb additions.
2. Experiment
The base metal Alloy 690 was treated at 1050C for
five minutes and then water quenched. The other base metal SUS 304L was treated at 1050C for two hours and cooled in air. Both base metals were machined to the
dimensions of 80706mm. Their compositions are
given in Table 1.
The experimental electrodes were prepared with a core wire of Alloy 52 and outside coats with fluxes of various Nb additions with reference to the composition of Alloy 152. The experimental electrodes were analyzed in accordance with ASME Boiler and Pressure Vessel Code, Section II Speci-fication SFA-5.11. According to their Nb levels, these experimental electrodes were designated as SNb1, S152, SNb2 and SNb3, respectively. Table 1 shows their chemical compositions.
Figure 1(a) shows the weldment design. The weldment was prepared by a manual shielding metal arc welding (SMAW) process with a welding current of 100 A and an average voltage about 22 V; the welding process was carried out with a control of heat input of about 2 KJ/mm. A weld was made of three welding layers, each of which was deposited in a single pass. Prior to welding, two base metals were cleaned with acetone and the experimental electrodes were dried in a backing oven. Beneath the base metals, a ceramic strip was placed as backing. After each pass, the weldment was brushed clean of any trace of slag or oxide. A
maximum interpass temperature of 150C was adopted
throughout.
The samples for optical observation were prepared by a mechanical grinding and polishing process, followed by electrolytic etching using a reagent of 70 ml H3PO4 + 30 ml H2O under a potential of 6 volts dc for2030seconds. For identifying precipitates, carbon extraction replicas with a double-sided extraction were prepared from the fusion zones
(FZs) of SNb1 and SNb3.11)These specimens were analyzed by a JEOL 2000FX transmission electron microscope (TEM) equipped with an energy dispersive x-ray spectroscope (EDXS).
The hardness measurement of FZ was taken using a Vickers hardness tester under a load of 200 g. In order to characterize the mechanical properties of FZ, tensile tests were performed on smooth and notched specimens with an MTS 810 universal tensile testing machine at 300C.
Figures 1(b) and 1(c) show the dimensions of the tensile test specimens. The crosshead speed was set at 0.012 mm/s. Tested specimens were further examined fractographically with optical and scanning electron microscopy.
3. Results and Discussion
3.1 Base metal
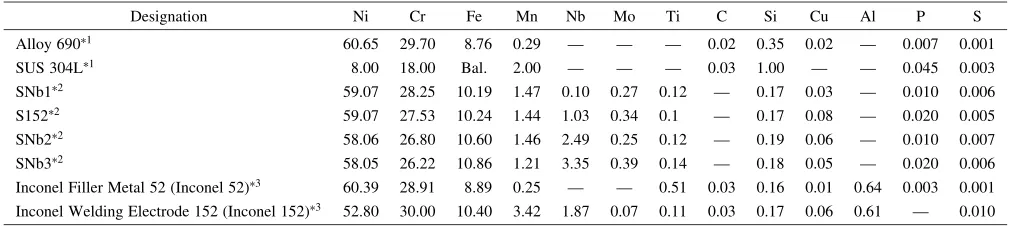
An optical micrograph of Alloy 690 is shown in Fig. 2(a). Precipitates were dispersed in the matrix and along the grain boundary. In the matrix, TiNs were in a shape of rectangular and showed a golden color under the optical microscope. The precipitates along the grain boundary were thought to be Cr-carbides. Figure 2(b) is an optical micrograph of SUS 304L base metal. -ferrite was observed in the matrix. Both base metals had an austenitic matrix, within which twins were often observed.
3.2 FZ microstructure
[image:2.595.45.550.84.197.2]Dendrites were the dominant feature of the SNb1 FZ, Fig. 3. The dendrites grew in a direction perpendicular to the interfaces, so they had different growth orientations in each pass. Under the optical microscope, golden particles were found in the SNb1 FZ, which were assumed to be TiNs, as shown in Fig. 4(a). Relatively, there were less golden particles in the root region, where the particles were obviously precipitated along the grain boundary, as shown in Fig. 4(b). Figures 4(c) and 4(d) show the large interden-dritic phases were present in the SNb3 FZ. The addition of Nb increased the size of interdendritic phases significantly. Due to the significant dilution of base metals in the root region, the size of interdendritic phases in the root region was smaller than that in the cap region.
Figure 5 shows the line scan results of SNb2. As shown in Figs. 5(b) and 5(d), wide variations in Ni and Fe contents were observed between the fusion zone and the SUS 304L base metal. On the side of Alloy 690, small compositional variations were observed. In the fusion zone, the Nb content showed periodical change, which could be accounted for by the formation of Nb-rich interdendritic phases. Due to the dilution effect of base metals, a difference in chemical compositions between the cap region and root region was also noted.
Figure 6 shows the TEM images and compositional analyses of the cap region of SNb1. Nb-rich, Al-Ti-rich and Cr-Ni-rich precipitates were found in the welds. Among them, Cr-Ni-rich precipitates and Al-Ti-rich precipitates were thought to be carbides and oxides, respectively.
In the root region, Cr-carbides and Al-Ti-rich oxides were dominating. Along the grain boundary, Cr-carbides were in
Alloy 690 SUS 304L
80
160
70
Unit : mm 6 1
3.2 80O
(a)
(b)
(c)
Fig. 1 (a) Welding configuration, (b) design of tensile specimen, (c) design of notched tensile specimen.
*1 Base metal
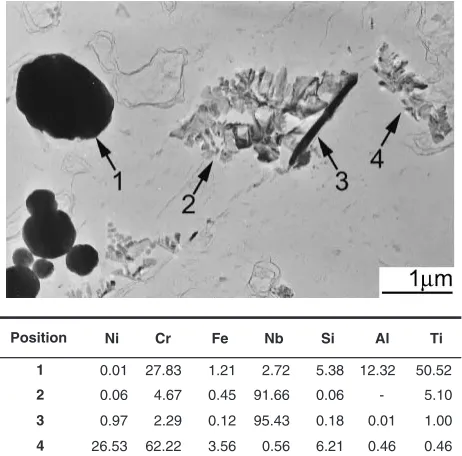
[image:2.595.47.291.252.559.2]various shapes and with different compositions, as shown in Fig. 7(a). As demonstrated in Fig. 7(b), some of them were Cr7C3. In the matrix, the carbides were identified to be Cr23C6, as shown in Fig. 7(c).
Cr-carbides prefer to precipitate along the grain boundaries
[image:3.595.79.522.73.207.2]when welding heat is introduced. In this study, the welding was a three-pass process and the welding heat was generated during each pass. The root region,i.e.the first pass, would be heat-affected by the sucessive two passes. In addition, grain boundary is thought to be one of the preferable sites for precipitation. Therefore, abundant Cr-carbides were seen to precipitate along the grain boundary of the root region.
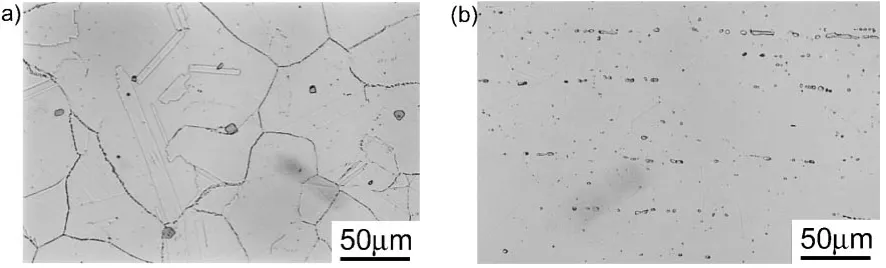
Figure 8 shows the TEM images of precipitates in the cap region of SNb3. The precipitates were similar to what were observed under the optical microscope (Fig. 4(c)). They were all Nb-rich phases.
In the root region, the interdendritic phases were smaller than those in the cap region. The difference in the sizes of interdendritic phases could be attributed to significant dilution from the base metals in the root region. In the root region, large precipitates were about 1mmin size. Their Nb
Fig. 2 Optical micrographs of two base metals: (a) Alloy 690, (b) SUS 304L.
1mm
Fig. 3 A macrograph of SNb1 weldment.
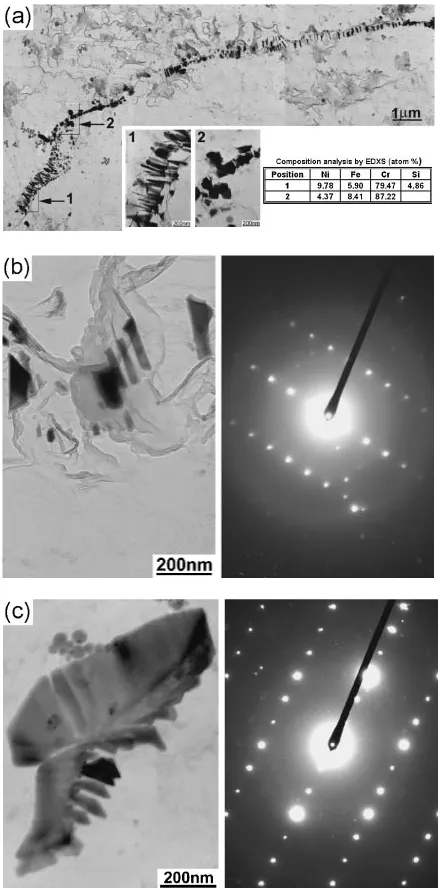
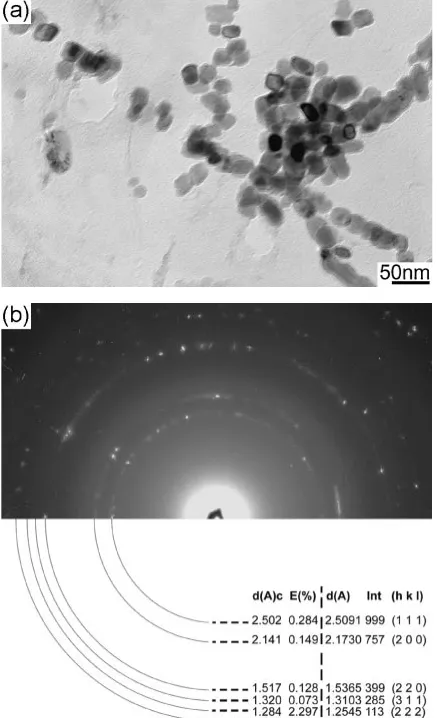
[image:3.595.48.290.254.340.2] [image:3.595.78.520.470.769.2]concentrations were above 90 mass%. The ring patterns showed they were of an fcc structure with a lattice parameter of about 0.428 nm. That was similar to the Nb-Ti carbonitride (a¼0:4346nm), as shown in Fig. 9. Near the large ones, there were tiny precipitates in a size of 20–30 nm, Fig. 10. They were identified to have a structure similar to that of the Nb-Ti carbonitride, as stated above. The lattice parameter was calculated to be about 0.430 nm.
3.3 Mechanical properties 3.3.1 Hardness test
Figure 11 is the hardness measurements of FZ. The average hardness measurement increased with increasing the Nb addition. In the SNb3 FZ, the hardness of the cap region was higher than that of the root region. From the microstructural observations, it was deduced that the rise in hardness was a result of an increase in number of interden-dritic phases that were rich in Nb.
[image:4.595.98.498.72.457.2]3.3.2 Tensile test at elevated temperature
Figure 12 shows the tensile test results. All specimens, except those prepared with weld metal SNb1, had yielding stresses at the same level. With increasing the Nb content, the elongation decreased. The stress-strain curves were serrated
Fig. 5 Line scans of SNb2: (a) in the cap region near Alloy 690, (b) in the cap region near SUS 304L, (c) in the root region near Alloy 690 and (d) in the root region near SUS 304L (SEM/EDS).
Position Ni Cr Fe Nb Si Al Ti
1 0.01 27.83 1.21 2.72 5.38 12.32 50.52
2 0.06 4.67 0.45 91.66 0.06 - 5.10
3 0.97 2.29 0.12 95.43 0.18 0.01 1.00
4 26.53 62.22 3.56 0.56 6.21 0.46 0.46
[image:4.595.54.285.526.754.2]in the plastic region, an indication that dynamic strain aging appeared to occur. The serrations resulting from dynamic strain aging had been classified into several types.12) The serrations, revealed in Fig. 12, were a mixture of type A and type B by nature. Since the gauge length of a tensile specimen was comprised of three distinct parts of Alloy 690, weld metal and SUS 304L, the serrated deformation behavior of a weldment could be a combined result of their dynamic strain aging effects. The observations that all the tensile specimens tested were fractured at the SUS 304L of a weldment, Fig. 13, suggested that the dynamic strain aging of SUS 304L could be predominating over the weldment deformation behavior.
Microcracks were observed in the root region of the weld metal SNb1. As exemplified in Fig. 14, cracks initiated and propagated along the grain boundary or in the interdendritic
region where Cr-carbides tended to be precipitated. Precip-itation of Cr-carbides is well known to prompt the develop-ment of Cr-depleted zone, which could provide a weak path for intergranular crack propagation.13)
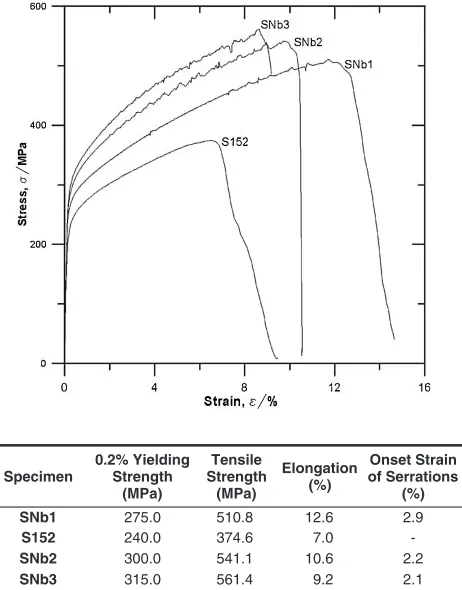
In order to characterize the mechanical properties of FZ, notched specimens were tested under the same conditions. Figure 15 shows the tensile test results of notched specimens, of which the tests on specimen S152 failed. All specimens tested were fractured at the weld, as shown in Fig. 16. With the Nb addition, the elongation decreased but the tensile stress increased. The flow curves started to serrate in the plastic region and became jerkier at higher strains. The serrations with the weld metal SNb1 were similar to the type A in their nature, but those with the weld metals SNb2 and SNb3 were difficult to classify. In comparison with Fig. 12, the serrations in Fig. 15 were coarser.
Dynamic strain aging is known to result from the interaction between mobile dislocations and solute atoms. The diffusion of interstitial solutes in iron base alloys,e.g.C and N, to dislocations is the mechanism for the serrated flow in the temperature range between 523 K and 623K.12) Alloy 600 and Alloy 690 have been shown to have dynamic strain aging induced by carbon in the temperature range between 373K and 873K.14) In the nickel-based welds, Nb, which was added to the flux, could react with C and N to form carbide/carbonitride. The more Nb was added, the less C/N atoms retained. As a result, DSA, induced by C/N atoms, was suppressed by the addition of Nb. So for the case of weld metals, DSA could not be a mechanism to account for the serrated flow.
Some studies of Al alloys15,16) reported that the interac-tions between mobile dislocainterac-tions and precipitates resulted in the serrations of the flow curve. The sizes of precipitates were assumed to be responsible for the stress drop size and stress drop rate of serrations. Dislocations would pile up in front of
Fig. 7 Precipitates in the SNb1 root region: (a) Bright field image and compositional analysis (TEM/EDXS), (b) bright field image and diffraction pattern of Cr7C3 along the grain boundary, (c) bright field
image and diffraction pattern of Cr23C6in the materix.
Position Ni Cr Fe Nb Si Al Ti
1 0.01 2.10 0.27 97.58 0.04
-2 15.47 8.93 1.05 70.27 3.45 - 0.82
3 0.33 3.42 0.25 81.94 0.01 2.31 11.74
4 0.97 2.29 0.12 95.43 0.18 0.01 1.00
[image:5.595.58.277.71.515.2] [image:5.595.313.542.72.310.2]the precipitates after a certain amount of deformation. As the dislocations were in a strong pileup, they could shear the precipitates to move and cause a stress drop.15)
In this study, both particle size and number density of the precipitates, i.e. interdendritic phases, increased with in-creasing the Nb content. On the contrary, the onset strain of serrations for the welds was noted to decrease, as shown in Fig. 15. The sizes of precipitates could not be responsible for the stress drop size of serrations. The exact mechanism of the serrated flow of welds remains to be studied.
Figure 17 shows the fractographs of all welds. Dendrite-like features were prevalent in the cap region. Ductile dimples were the dominant features of the SNb1 cap region and decreased with the Nb addition, in contrast to the brittle fracture features with SNb2 and SNb3.
4. Conclusions
(1) The FZ was dominant with dendrites and interdendritic phases. The interdendritic phases increased with the Nb addition.
[image:6.595.54.286.70.546.2](2) In the low Nb welds, the main interdendritic phases
Fig. 10 Tiny precipitates in the root region of SNb3: (a) Bright field image, (b) ring pattern.
175 180 185 190 195 200 205 210 215
SNb1 S152 SNb2 SNb3)
Specimen
HV0.2
[image:6.595.318.537.74.433.2]Top Root
Fig. 11 Average hardness measeurments of weld metals. Position Ni Cr Fe Nb Si Al Ti
1 0.29 3.67 0.58 92.61 0.70 0.80 1.35
2 0.16 1.80 0.47 96.23 0.01 0.03 0.80
3 0.08 1.52 0.32 96.65 0.01 0.07 1.36
4 0.28 1.46 0.69 95.90 0.36 0.23 1.08
5 5.56 2.82 0.68 89.66 0.73 0.13 0.42
[image:6.595.309.548.505.669.2]were Nb-rich and Al-Ti-rich phases. Cr-carbides were precipitated along the grain boundaries of the root region. In the high Nb welds, there were large Nb-rich phases in the cap region, while the smaller Nb-rich
phases identified as Nb-carbonitride were found in the root region.
(3) The hardness measurement of FZ increased with addition of Nb.
(4) The results of tensile test at 300C showed that the
tensile strengths of the welds were higher than that for the SUS 304L base metals, but that micro-crack was observed in the welds with a small addition of Nb. The tensile tests of notched specimens showed that Nb increased the tensile strength of welds. However, the brittle fracture features became noticeable with the addition of Nb.
Specimen
0.2% Yielding Strength
(MPa)
Tensile Strength
(MPa)
Elongation (%)
Onset Strain of Serrations
(%)
SNb1 192.0 414.7 32.0 4.9
Inconel 152 230.0 474.0 31.2 2.7
SNb2 220.0 442.7 30.0 2.4
[image:7.595.314.545.72.367.2]SNb3 220.0 442.2 27.3 2.5
[image:7.595.51.287.72.363.2]Fig. 12 Tensile stress-strain curves for weldments tested at 300C.
Fig. 13 Macrographs of tested weldment specimens.
Fig. 14 An optical micrograph of fractured SNb1 specimen tested at 300C.
Specimen
0.2% Yielding Strength
(MPa)
Tensile Strength (MPa)
Elongation (%)
Onset Strain of Serrations
(%)
SNb1 275.0 510.8 12.6 2.9
S152 240.0 374.6 7.0
-SNb2 300.0 541.1 10.6 2.2
[image:7.595.59.279.431.552.2]SNb3 315.0 561.4 9.2 2.1
Fig. 15 Tensile stress-strain curves for notched tensile specimens tested at 300C.
[image:7.595.318.536.433.586.2] [image:7.595.62.278.606.684.2]REFERENCES
1) A. Jenssen, K. Norrgard, J. Lager, G. Embring and D. R. Tice:10th Int. Conf. Environmental Degradation of Materials in Nuclear Systems-Water Reactors, ed. by F. P. Fordet al.(Lake Tahoe, Nevada, August 5–9, 2001).
2) E. Folkhard, G. Rabensteiner, E. Perteneder, H. Schabereiter and J. Toesch: Welding Metallurgy of Stainless Steels (Springer-Verlag, Wien, 1988) pp. 31–34.
3) H. Nagano, K. Yamanaka, K. Kobayashi and M. Inoue: The Sumitomo Search40(1989) 57–70.
4) K. Yamanaka, K. Ogawa, K. Kobayashi and S. Nagata: The Sumitomo Search51(1993) 1–15.
5) ASM Metal Handbook Volume 2(Metals Park, Ohio, 1990) pp. 430– 431.
6) A. F. Padilha, M. Pohl and L. V. Ramanathan: Prakt Metall31(1994) 436–447.
7) J. N. DuPont, C. V. Robino, J. R. Michael, M. R. Nois and A. R.
Marder: Metall. Mater. Trans. A29A(1998) 2785–2796.
8) J. N. DuPont, C. V. Robino, A. R. Marder and M. R. Nois: Metall. Mater. Trans. A29A(1998) 2797–2806.
9) J. N. DuPont, C. V. Robino and A. R. Marder: Weld. J.77(12)(1998) 417s–431s.
10) W. T. Wu and C. H. Tsai: Metall. Mater. Trans. A30A(1999) 417– 426.
11) A. Czyrska-Filemonowicz and K. Spiradek: Europ. Microscopy Analysis3(1995) 13.
12) S. L. Mannan: Bull. Mater. Sci.16(1993) 561–582.
13) A. Aguilar, J. L. Albarran, H. F. Lopez and L. Martinez: Mater. Letters
61(2007) 274–277.
14) H. Ha¨nninen, M. Ivanchenko, Y. Yagodzinskyy, V. Nevdacha, U. Ehrnste´n and P. Aaltonen:12th Int. Conf. Environmental Degradation of Materials in Nuclear Systems-Water Reactors, ed. by T. R. Allenet al.(Salt Lake City, Utah, August 14–18, 2005).
15) E. Pink, S. Kumar and B. Tian: Mater. Sci. Eng. A280(2000) 17–24. 16) D. Thevenet, M. Mliha-Touati and A. Zeghloul: Mater. Sci. Eng. A266
[image:8.595.75.521.73.413.2](1999) 175–182.