T
HE
A
PP
E
CONOMY
HOW START
-
UPS CREATE BUSINESS VALUE WITH MOBILE APPLICATIONS
MS
CT
HESISI
NNOVATION&
E
NTREPRENEURSHIPAUTHOR: MARC C.ZINCK STAGNO
INSTITUTIONS: SCHOOL OF MANAGEMENT &GOVERNANCE,UNIVERSITY OF TWENTE,ENSCHEDE STRATEGIES FOR THE INFORMATION SOCIETY,TNO,DELFT
SUPERVISORS: FONS WIJNHOVEN,UNIVERSITY OF TWENTE MICHEL EHRENHARD,UNIVERSITY OF TWENTE BAS KOTTERINK,TNO
TIJS VAN DEN BROEK,TNO
DATE: 21-06-2012
SUMMARY &PREFACE I
SUMMARY
Background – Mobile applications (‘apps’) are a relatively new phenomenon with rapidly growing popularity. There are indications that apps have the potential to create economic value. Much is unknown about the value that apps create, and the manner in which organizations can leverage the value creating potential of apps.
Objective & setting– The research goal of this study is to explain the business value of apps. The study will focus on explaining value creation by examining app-enabled economic opportunities initiated by start-up ventures. The research goal is met by focusing on two elements of the business value of apps: (1) an explanation of the business process of app-enabled value creation and (2) an explanation of the type of outcomes associated to the use of apps for business purposes.
Approach – A Dynamic Capabilities perspective is taken to explain the process and outcomes of app-enabled value creation by start-ups using interpretive case study research. The chosen theoretical framework is the Net-Enabled Business Innovation Cycle (NEBIC), which is used as basis for the collection, analysis, and reporting of data. Data on eight cases selected by method of intensity sampling are collected through interviews with the founding entrepreneurs and from additional sources such as websites and business plans.
Findings – The results include (1) the identification of twelve routines matched to four capabilities for creating business value using apps, (2) the explanation of the interactions between the four capabilities leading to a model representing the app-enabled value creation process, and (3) the identification of eleven types of app-enabled business value, categorized into four dimensions and matched to the capabilities making up the value creation process.
Conclusions – An understanding is created about how start-ups create business value by using apps for business purposes and what type of business value is created in this process. This understanding forms a basis for future studies on app-enabled value creation; directions for further research are formulated. The results also provide managers with insights regarding the creation of business value with apps, which can guide decision-making on the business adoption of apps.
Keywords – Mobile applications, apps, economic value, business value, app-enabled value creation, start-ups, app-entrepreneurs, Dynamic Capabilities, NEBIC, interpretive case study.
PREFACE
What is the economic impact of apps? Inspired by this question I started my graduate research at TNO, a research & technology organization. The recent proliferation of the app-phenomenon makes it a very interesting topic of study. Many people use them, but do they actually create value? I hope the reader will enjoy the insights on app-enabled value creation provided by this study.
TABLE OF CONTENTS II
TABLE OF CONTENTS
S
UMMARY... I
P
REFACE... I
L
IST OF FIGURES AND TABLES... IV
1
I
NTRODUCTION:
THEB
USINESSV
ALUE OFA
PPS... 1
1.1 APPS & THE ECONOMY ... 1
1.2 RESEARCH GOAL: THE BUSINESS VALUE OF APPS ... 1
1.3 FOCUS ON VALUE CREATION BY START-UPS ... 2
1.4 RESEARCH QUESTIONS AND APPROACH ... 2
2
B
ACKGROUND:
A
PPS&
IT
B
USINESSV
ALUE... 4
2.1 APPS: DEFINITION & ECOSYSTEM ... 4
2.1.1 Working definition of business apps ... 4
2.1.2 The app ecosystem ... 5
2.2 A PRODUCTION ECONOMICS APPROACH TO IT VALUE RESEARCH ... 7
2.2.1 IT business value & production economics ... 7
2.2.2 A production economic-based model for the business value of apps ... 8
2.3 ADYNAMIC CAPABILITIES APPROACH TO IT VALUE RESEARCH ... 9
2.3.1 Considerations for IT business value research ... 9
2.3.2 Dynamic capabilities to explain app-enabled value creation ... 11
2.3.3 The dependent variable: App business value ... 12
2.4 SUMMARY... 14
3
F
RAMEWORK FOR THEV
ALUEC
REATIONP
ROCESS:
NEBIC ... 15
3.1 THE NET-ENABLED BUSINESS INNOVATION CYCLE ... 15
3.2 THE APP-ENABLED VALUE CREATION CYCLE: PROCESS PROPOSITIONS ... 17
3.3 THE APP ARTIFACT ... 19
3.4 SUMMARY... 20
4
M
ETHODOLOGY... 21
4.1 RESEARCH STRATEGY ... 21
4.2 POPULATION & SAMPLE ... 22
4.3 DATA COLLECTION ... 24
TABLE OF CONTENTS III
5
R
ESULTS:
C
APABILITYD
ESCRIPTION&
B
USINESSV
ALUE... 31
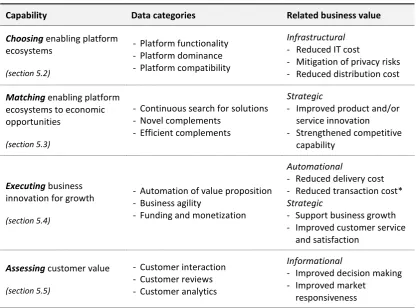
5.1 OVERVIEW OF THE RESULTS ... 31
5.2 CHOOSING CAPABILITY ... 31
5.2.1 Description ... 31
5.2.2 Business value ... 33
5.3 MATCHING CAPABILITY ... 33
5.3.1 Description ... 33
5.3.2 Business value ... 35
5.4 EXECUTING CAPABILITY ... 35
5.4.1 Description ... 35
5.4.2 Business value ... 36
5.5 ASSESSING CAPABILITY ... 37
5.5.1 Description ... 37
5.5.2 Business value ... 38
6
D
ISCUSSION:
A
PP-
ENABLEDV
ALUEC
REATIONC
YCLE... 39
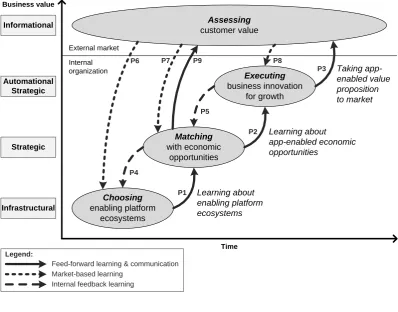
6.1 OVERVIEW OF THE APP-ENABLED VALUE CREATION PROCESS ... 39
6.2 VALUE CREATION PROCESS EXPLANATIONS ... 40
6.3 SAMPLE EMPIRICAL INDICATORS... 44
6.4 DIFFERENCES BETWEEN APP-ENABLED AND NET-ENABLED VALUE CREATION ... 45
7
C
ONCLUSION... 47
7.1 RECAP: THE BUSINESS VALUE OF APPS ... 47
7.2 LIMITATIONS AND FUTURE RESEARCH DIRECTIONS ... 47
7.3 THEORETICAL IMPLICATIONS AND FUTURE RESEARCH DIRECTIONS ... 48
7.3.1 IT business value: production economics & NEBIC ... 48
7.3.2 Dynamic capabilities and a positivist understanding of app business value ... 49
7.3.3 Strategic entrepreneurship ... 49
7.3.4 Business model innovation ... 50
7.4 MANAGERIAL IMPLICATIONS ... 50
R
EFERENCES... 52
A
PPENDIX1:
A
PP BUSINESS VALUE TYPOLOGY&
GUIDING INDICATORS... 57
LIST OF FIGURES AND TABLES IV
LIST OF FIGURES AND TABLES
FIGURE 1. Actors and interactions of the app ecosystem (adapted from the mobile commerce
lifecycle by Varshney & Vetter, 2002) ... 6
FIGURE 2. IT and economic performance (adapted from Dedrick, et al., 2003). ... 8
FIGURE 3. Ten-dimensional construct of ‘app business value’ ... 12
FIGURE 4. Net-enabled business innovation cycle (adapted from Wheeler, 2002) ... 15
FIGURE 5. Proposed app-enabled business innovation cycle (adapted from Wheeler, 2002) ... 17
FIGURE 6. Visualization of the data analysis procedure (adapted from Runeson & Höst, 2009) ... 26
FIGURE 7. Extended and refined app-enabled value creation process (adapted from Wheeler, 2002) ... 40
TABLE 1. Functional taxonomy of business apps based on their level of interactivity (adapted from Unhelkar & Murugesan, 2010). ... 5
TABLE 2. Sample overview and background ... 23
TABLE 3. Data sources specified by case ... 24
TABLE 4. Concepts derived from data and emerging categories linked to capabilities ... 28
TABLE 5. Business value indicators derived from data linked to app business value dimensions .. 30
TABLE 6. Data categories and business value indicators linked to capabilities ... 31
INTRODUCTION: THE BUSINESS VALUE OF APPS 1
1
INTRODUCTION: THE BUSINESS VALUE OF APPS
1.1
A
PPS&
THE ECONOMY‘App’1 was voted word of the year in 2010 by the American Dialect Society. Apps have gained strong popularity in recent years, and currently over a third of the adult population in the U.S. has apps on mobile phones (Purcell, Entner, & Henderson, 2010). Since its launch less than four years ago, Apple’s App Store has seen over 25 billion apps downloaded, and has an availability of over 500 thousand apps (Apple, 2012). Popular examples are gaming apps (e.g. Angry Birds), social networking apps (e.g. Facebook mobile), and GPS navigation apps (e.g. Google navigation).
Apps have the potential to impact the economic performance of organizations and countries. The sale of apps alone generated around € 5 billion in 2011, and is estimated to grow to over € 18 billion in 2016 (iDate, 2012). In the U.S., employment related to the ‘app economy’ is estimated at over 460 thousand jobs in 2011 (Mandel, 2012). Organizations are presented with new opportunities to create value using apps (Varnali & Toker, 2010). Firms are adopting apps in an attempt to meet new demands, increase efficiency, and improve competitiveness (Unhelkar & Murugesan, 2010). There are indications that apps can be used for different facets of business, for example as a new marketing medium, allowing more efficient inventory management, and providing a mobile office environment to employees (Varshney & Vetter, 2002). A recent report shows that small businesses are benefiting from using apps because they allow entrepreneurs to work more effectively and thus save time and money (Small Business & Entrepreneurship Council, 2011). However, given the high adoption numbers by the public, besides being leveraged to boost internal productivity apps can be deployed on the customer-side of an organization. Many large established organizations have attempted to create value with so-called ‘branded apps’ (Distimo, 2011a), but success stories are rare as many of the apps published by major brands have low download numbers (Deloitte, 2011). Because of the little research done in this field to date, much is unknown about the value that apps create, and the manner in which organizations can leverage the value creating potential of apps.
1.2
R
ESEARCH GOAL:
THE BUSINESS VALUE OF APPSApps are part of the mobile information technology (IT2) landscape, and research has shown that IT in general contributes to economic performance (for an overview see Dedrick, Gurbaxani, & Kraemer, 2003). It is important for researchers, managers, and policymakers to know how IT contributes to economic performance to guide effective decision-making (Melville, Kraemer, & Gurbaxani, 2004). In the field of Information Systems this stream is termed ‘IT business value’ research. In this field it is important to study the paths to economic value3 that are influenced by IT (Kohli & Grover, 2008). Several calls have been made for investigating how businesses create value in the context of mobile IT (e.g. Basole, 2007; Ladd, Datta, Sarker, & Yu, 2010). Following these calls, the main research goal can be formulated as follows.
RG: Explain the business value of apps.
‘Explaining’ a phenomenon aims at developing an understanding of ‘how things are’ (Gregor, 2006). The resulting explanation provides insights to organizations on how to create value with apps.
1
Throughout this paper the term app will be used to refer to a mobileapplication.
2
Throughout this paper the abbreviation IT will be used for information technology and information technologies, depending on the grammatical context.
3
INTRODUCTION: THE BUSINESS VALUE OF APPS 2
1.3
F
OCUS ON VALUE CREATION BY START-
UPSThis study will focus on app-enabled value creation by start-ups. Start-ups are ventures in the process of defining a viable and scalable business model to exploit market opportunities; the start-up entrepreneur is the visionary driving this process (Gries & Naudé, 2010). Choosing start-start-ups and their founding entrepreneurs as focus for the investigation of value creation with apps has two main reasons.
(1) From a theoretical perspective, start-ups and their founding entrepreneurs are viewed as fundamental for economic transformation and growth (Gries & Naudé, 2010; Schumpeter & Backhaus, 2003). Especially when dealing with opportunities relating to novel technologies in new and dynamic markets, as is the case with apps, entrepreneurs are those who identify and explore these opportunities (M. A. Hitt, Ireland, Camp, & Sexton, 2001). Therefore, entrepreneurial start-ups provide fertile ground for strategic management research (Carland, Hoy, Boulton, & Carland, 1984) and examining these start-ups could yield novel and rich explanations of the business value of apps.
(2) From a practical perspective, the success stories relating to apps usually come from small start-ups. Many entrepreneurs have developed their app-enabled ideas and created ‘million dollar’ start-ups.4 As mentioned in section (1.1), success stories coming from large established organizations creating value with apps are rare.
It should be noted that the validity of the results for large organizations might be limited by focusing this study on start-ups. However, also in large organizations new opportunities are identified and seized by entrepreneurial efforts connected to the organization, because industry incumbents are often blind to these opportunities (Wheeler, 2002). Therefore, explaining the value creation by start-up entrepreneurs can prove insightful to organizations of all sizes in their decision-making on the implementation of apps.
1.4
R
ESEARCH QUESTIONS AND APPROACHFollowing Gregor (2006), an ‘explanation’ of the business value of apps should include a description of how business value is created (i.e. the process), and what the business value of apps is (i.e. the outcome). Following this reasoning, two research questions are formulated.
RQ1: How do start-ups create value by using apps for business purposes?
This question should result in the identification of the key factors for creating business value using apps and an overview of the process of value creation.
RQ2: What type of value is created by start-ups that use apps for business purposes?
This question should result in the identification and categorization of the business value of apps, providing insight into the type of outcome that is created using apps.
Most studies investigating the value of IT have their roots in the field of production economics. Basically, these studies investigate what part of the value at the output of a production system can be accounted for by IT related inputs. However, more recent studies on IT business value refute the ‘black box’ production models, and aim at investigating what goes on inside the production process.
4
BACKGROUND:APPS &ITBUSINESS VALUE 4
2
BACKGROUND: APPS & IT BUSINESS VALUE
This section presents a working definition of apps and gives an overview of the economic activity related to the app ecosystem. Subsequently, a review is presented of the two main streams in IT business value research: (1) the production economic-based approach and (2) the Dynamic Capabilities approach.
2.1
A
PPS:
DEFINITION&
ECOSYSTEM2.1.1
W
ORKING DEFINITION OF BUSINESS APPSThe most popular and most frequently downloaded apps are related to gaming or social networking functions (Distimo, 2011b). However, apps may take on a large variety of functions, and it is therefore necessary to formulate a working definition of apps before taking a closer look at their business value. Bellman, Potter, Treleaven-Hassard, Robinson, and Varan (2011, p. 191) narrowly define apps as “software downloadable to a mobile device,” corresponding to the popular idea of what apps are. However, this definition may be too narrow. In the near future it is likely that it will not matter whether the software is installed on the mobile device or (part of) the code is stored on a central location and accessed using very limited software on the mobile device. This is the basic premise of recent developments termed ‘cloud computing’ (Armbrust et al., 2010). Additionally, it is expected that through the proliferation of HTML55, mobile websites will be able to behave as ‘native’ apps (i.e. installed on the device) behave today. HTML5 allows websites to be more interactive, further blurring the line between native mobile apps and web-based applications accessed through a mobile device’s web-browser.
Nickerson, Varshney, Muntermann, & Isaac (2007, p. 2) define apps in a broader sense as “a use of a
mobile technology by an end-user for a particular purpose.” This definition is more complete than
the previously mentioned one. Next to defining the form of an app as ‘a mobile technology’, the definition reflects the importance of the function and fit of the apps; namely, it includes a ‘purposeful use’ and a ‘user’. The latter two are especially important in the context of this study. Value is not created by just a technology, but it is rather created through the interplay of the technology, the user, and the purpose of use. However, the focus of the above definition is on mobile computing in general, as it would include all uses of a mobile technology. This includes mobile phones and tablet pc’s, but, for example, also WiFi-enabled laptops. A narrower definition may be more useful for the purpose of the current study. The definition by Nickerson, et al. (2007) is narrowed down through the following reasoning.
This study is interested in the activities that can be carried out on mobile phones and tablet pc’s. Laptops are excluded as they are more closely related to the desktop pc than to mobile phones and tablet pc’s, based on for example function, input/output mechanisms, and operating software. However, due to the technological convergence in the field of mobile computing, the line dividing desktop and laptop pc’s on the one hand, and mobile phones and tablet pc’s on the other, is becoming increasingly blurry. An important manifestation of this convergence is captured by the soon-to-be released operating system Microsoft Windows 8, that aims at running on many different forms of (mobile) devices, and providing a consistent delivery of functionality and user-experience on the different devices.
5
BACKGROUND:APPS &ITBUSINESS VALUE 5
The current study focusses on apps that potentially have a business value. From a business-user perspective, this includes, for example, the use of apps for providing information to employees and facilitating collaboration between employees. However, the end-user does not need to be within the boundaries of the organization for the app to hold business value. For example, an app could be used by organizations to communicate with suppliers, or reach and attract customers. Table 1 presents a functional taxonomy of business apps based on the level of interactivity adapted from Unhelkar and Murugesan (2010). This taxonomy gives an overview of the uses of apps that might hold the business value this study is aiming to assess. Five app types are distinguished with increasing level of interactivity between the user and the app, namely broadcast, information, transaction, operation, and collaboration apps. Table 1 gives a short description of each of the app types, providing an indication of the kind of business value that is associated with them. It should be noted that the different types are not mutually exclusive; one app could perform different functionalities and, therefore, fall under multiple categories.
TABLE 1. Functional taxonomy of business apps based on their level of interactivity (adapted from Unhelkar & Murugesan, 2010).
App type Description of delivered value
In
teractiv
ity
Collaboration Supports collaboration within and outside the enterprise
Operation Facilitates operational aspects of the business (e.g. inventory management, HR management)
Transaction Facilitates e-transactions, customer relationship management, and sales and marketing
Information Provides information sought by the mobile user (e.g. timetables, weather conditions)
Broadcast Facilitates large-scale information broadcast to mobile devices (e.g. advertisements, promotions)
The activity performed on the mobile device takes place through an interface governed by software. To get a better feel of the IT under investigation, the interfacing characteristic of apps is included in the definition. An app interfaces between front-end (i.e. end-user) and backend (e.g. phone software, servers) to exchange information. This shows that an app is embedded in a larger information system. The software governing the interface is either installed on the mobile device, or accessed through the device’s wireless connection. Through this understanding web-applications accessed through a mobile device’s internet browser are mobile applications as well.
On the basis of the former, the working definition of a business app for this study is given by: a use of an interface on a mobile phone or tablet pc by an end-user
for a purpose that potentially holds business value
2.1.2
T
HE APP ECOSYSTEMBACKGROUND:APPS &ITBUSINESS VALUE 6 Production of apps
App infrastructure
App developers App stores
Use of apps Equipment
developers & vendors
Wireless service providers
Users (private & business) App software
Services
Equipment App software Equipment
App software & content/output App input
Equipment Mobile OS
developers
Content & other service providers
App content
Software
Services
FIGURE 1. Actors and interactions of the app ecosystem (adapted from the mobile commerce lifecycle by Varshney & Vetter, 2002)
Three separate levels of economic impact can be identified from the three groups of actors showed in figure 1. The following list elaborates on some of the properties of the three levels of impact.
(1) The first level of economic impact related to the production of apps can be divided into two tiers. The first tier of impact lies with the creation of new business activity for app developers. Here, app developers are those that make an app, i.e., related to the software coding process. The second tier of impact is the economic activity created in the form of services provided in support of the production and use of apps. The app stores, such as the Apple App-store and Google Play, provide a distribution platform for the apps. Also, there are organizations that provide content and other services supporting the production and use of apps. Supporting services could be, for example, analytics on app use for app developers, mobile payment platforms mediating between users, or app related content services like weather forecasts or train schedules delivered through the wireless service providers.
(2) The second level of economic impact is related to the provision of the infrastructure allowing for apps to be produced and used. The proliferation of apps might affect the demand for equipment and services that enable apps to be produced and used. This level of impact is mostly characterized by building and maintaining the hardware and software infrastructure, and the services related to these activities.
BACKGROUND:APPS &ITBUSINESS VALUE 7 Mobile technologies in general are viewed as a disruptive innovation (Latzer, 2009). Therefore, in addition to these three levels of impact in the app ecosystem, apps might have a destructive effect on other industries. For example, gaming apps might negatively affect the traditional PC and console gaming industries. Studies that aim to assess the value created at a higher level of aggregation (e.g. country-level) should also account for the destructive economic effect of apps. This study will not focus on these effects.
2.2
A
PRODUCTION ECONOMICS APPROACH TOIT
VALUE RESEARCH2.2.1
IT
BUSINESS VALUE&
PRODUCTION ECONOMICSMost studies investigating the value of IT have their roots in the field of production economics. Productivity is a fundamental measure in this field, and is used to measure the contribution of a technology to economic performance (Brynjolfsson & Yang, 1996). Productivity reflects the efficiency of value creation. Higher productivity at the firm level results in more added value, which can lead to competitive advantage and better organizational performance. Higher productivity at the aggregate level (i.e. industry or macro-economic domain) can result in more employment and/or higher wages, which ultimately lead to better economic performance and more wealth. In the 1980s, the first studies investigating the impact of IT showed no relation between IT and productivity (Dedrick, et al., 2003). This so-called ‘productivity paradox’was famously described by Robert Solow: “we see computers everywhere except in the productivity statistics” (quoted from Brynjolfsson, 1993).
According to Brynjolfsson (1993), the productivity paradox was partly caused by deficiencies in research methodologies. Improved scientific analyses provided evidence of IT related productivity, refuting the paradox. Using the framework depicted in figure 2, Dedrick, et al. (2003) reviewed more than 50 empirical articles that successfully related IT to economic performance. The framework provides insight in some of the variables and relationships that are commonly investigated in empirical IT value research. Most of the empirical assessments used production economic-based models. In this type of research, the train of thought is to investigate what part of the outputs can be explained by input in the form of IT capital through regression analysis. If a significant effect is established, the impact of IT can be estimated as an outcome usually measured by increased productivity (i.e. the efficiency of converting input into output). Other frequently used outcome measures are growth and profitability. ‘Softer’ outcome measures, such as a firm’s competitive capability and consumer welfare, are less popular measures in production economic-based studies on IT value. The main reason for this is that they are harder to express quantitatively and as such harder to use in a regression analysis. The analysis can be done at different levels within a production system, i.e. firms or aggregate levels of firms. Studies have found a positive economic impact of IT on firms (for an overview see Kohli & Devaraj, 2003), industries (e.g. Stiroh, 2002), and the macro-economy (for an overview see Van Ark, 2002).
BACKGROUND:APPS &ITBUSINESS VALUE 8 process. Using a black-box production economic-based model will not serve this study to meet its research goal. Nevertheless, the following section will derive such a model to show why it is unfeasible to use this approach to answer the research questions.
Labor
Capital: - Non-IT Capital
- IT Captal
Economic value of products and
services Producing and delivering
a value proposition
- Productivity - Economic growth
- Profitability - Competitive capability
- Consumer welfare - Organization and management practices
- Industry organization and regulation - Economic structure, government policy,
and investment in human capital
COMPLEMENTARY FACTORS
INPUTS PROCESS OUTPUTS OUTCOMES
PRODUCTION SYSTEM
FIGURE 2. IT and economic performance (adapted from Dedrick, et al., 2003).
2.2.2
A
PRODUCTION ECONOMIC-
BASED MODEL FOR THE BUSINESS VALUE OF APPSA production function can be used to assess the business value of apps by estimating the impact apps have on the productivity of a production system. Production functions have their root in economic theory and are mathematical representations of a production system in which the outputs are explained by an algebraic combination of inputs. The productivity of a system reflects the efficiency with which the inputs are used to create the output. It has been demonstrated that the Cobb-Douglas production function best characterizes firm-level production in the context of IT (Gurbaxani, Melville, & Kraemer, 2000), and is commonly used in similar research (Brynjolfsson & Hitt, 2003). A basic Cobb-Douglas production function is given by equation (1).
(1)
where:
V = production value (i.e. output measure)
A = an efficiency parameter explaining variations in output not accounted for by the inputs, often captured by Total Factor Productivity,
L = labor input,
K = non-IT capital input,
IT = IT capital input, and
= output elasticity of the respective factor (i.e. a measure explaining how much the output changes for every unit change of the respective input).
Research explaining the business value of IT aims at estimating the output elasticity of IT ( ) to
BACKGROUND:APPS &ITBUSINESS VALUE 9
(2)
where:
= estimation error term.
In line with previous studies, it is possible to model a parameter capturing a specific IT in the production function (e.g. Aral, Brynjolfsson, & Wu, 2006; L. M. Hitt, Wu, & Zhou, 2002). For the purpose of this study, equation (3) includes a term for ‘app adoption’ in the model. IT capital and non-IT capital are summed as it is not necessary to estimate separate output elasticity measures for them ( ). Equation (3) also models year dummies to account for economy wide shocks, and industry dummies for controlling variations in performance due to industry differences.
(3)
where:
AA = app adoption,
Year = time control variable, and
Industry = industry control variable.
App adoption should be represented by one or more variables capturing the level of a firm’s implementation and use of apps for a business purpose. Although ‘investment’ in the IT is traditionally used as adoption variable (L. M. Hitt, et al., 2002), research has indicated that for the purpose of linking IT to the value it creates, it is necessary to dig deeper into the adoption of the IT by looking at its actual use (Aral, et al., 2006; Devaraj & Kohli, 2003). Before being able to quantify the value apps create by estimating in equation (3), it is needed to conceptualize an app
adoption variable. ‘Investment in apps’ as an adoption variable fails to include the way in which the apps are used. Logically, an organization can invest in apps, but if they are poorly developed or implemented, value creation could hold off. Looking inside the black-box of the production system and exploring how apps actually impact the production process is a first step in the direction of conceptualizing an app adoption variable. Furthermore, such an investigation is valuable in itself to provide guidance for businesses wanting to adopt apps.
An additional weakness of the model in equation (3) is the limited data available for estimation. This study would rely on the availability of secondary data to estimate equation (3) because of the cost and time involved in collecting the necessary firsthand data. The needed production data can be accessed through, for example, Statistics Netherlands or Eurostat, and are available until 2008. Although there are datasets available on the business adoption of apps from analytics companies, these data do not go further back than 2010. This limitation means that at present the datasets cannot be linked to each other, leaving an estimation of equation (3) unfeasible.
2.3
A
D
YNAMICC
APABILITIES APPROACH TOIT
VALUE RESEARCH2.3.1
C
ONSIDERATIONS FORIT
BUSINESS VALUE RESEARCHPrevious studies in the field of IT business value reveal several considerations to be made for researchers to advance investigation in this field. This section discusses some of these considerations to be made when investigating the business value of IT.
Use of firm-level data
BACKGROUND:APPS &ITBUSINESS VALUE 10 1993). Studies revealed differences in IT productivity among firms, indicating that some firms used IT more productively than others (Dedrick, et al., 2003). A study by Brynjolfsson & Hitt (1995) showed that about half of the productivity benefits generated by IT-investments depended on what they called ‘firm-effects’. This means that there are many complementary factors that influence the conversion of IT-investment into output. The approach to this study should account for the firm-effects to understand the impact of apps. Therefore, the individual organization will be the focus of the investigation, as firm-effects cannot be analyzed using aggregate data.
Account for complementary factors
Production economic-based impact models often relate IT measures to productivity through a black-box value production process. To explain the previously mentioned firm-effects and their relation to IT, the analysis should take a look at “what goes on inside the black-box of the firm” (Brynjolfsson & Hitt, 1998, p. 52). Firm-effects are shaped by organizational factors, such as management practices, complementary investments, and IT training (Brynjolfsson & Hitt, 1998; Dedrick, et al., 2003). Also environmental factors should be taken into account, such as the characteristics of trading partners, industry, and country (Melville, Gurbaxani, & Kraemer, 2007; Melville, et al., 2004). According to Brynjolfsson and Hitt (2000, p. 45), “both case studies and econometric work point to organizational complements such as new business processes, new skills and new organizational and industry structures as a major driver of the contribution of information technology.” To account for complementary factors in this study, the apps need to be analyzed in relation to their context. Section (2.3.2) explains the Dynamic Capabilities perspective in relation to app-enabled value creation, which focusses on looking at how complementary factors shape the process of value creation.
Look beyond productivity
The value that IT creates can manifest itself in many forms (Kohli & Grover, 2008). One of the shortcomings in the production economic-based models is that it fails to see the non-productivity impacts. For example, the use of IT can create business value which is passed on to customers in the form of price-reductions (Mithas, Tafti, Bardhan, & Goh, 2007). In addition, there might be manifestations that are hard to measure quantitatively, such as securing an organization’s competitive position (Avgerou, 2001). Schryen (2011, p. 4) calls this the “ambiguity and fuzziness” of the IT business value construct and calls for looking at different types of value, such as improved market-oriented capabilities. Section (2.3.3) explains what types of value are associated to the use of IT, and conceptualizes an ‘IT business value’ construct to capture many different manifestations of IT value.
Look at the long-run impact
BACKGROUND:APPS &ITBUSINESS VALUE 11
Account for spillovers
Research has also indicated the presence of IT-related spillovers (Chang & Gurbaxani, 2011). IT-related investment and knowledge can spill over from a firm’s trading partners and create value at the focal firm. Complementary factors like, for example, industry characteristics, have been shown to shape the spillover effects (Han, Chang, & Hahn, 2011). Investigating spillovers requires the analysis of a value producing network of businesses. This study is concerned with the value creation by start-ups, not the whole value-network of the start-up. Therefore, investigating spillovers will not be a focus in this study.
2.3.2
D
YNAMIC CAPABILITIES TO EXPLAIN APP-
ENABLED VALUE CREATIONThe body of research in the field of ‘IT business value’ has been in decline since it peaked around the turn of the century (Schryen, 2011), despite its fundamental contribution to the Information Systems discipline (Kohli & Grover, 2008). One of the reasons for this fact may be that much of the more recent work is not coined IT business value research, because it focusses more on what goes on inside the black-box of the production system (Melville, et al., 2004). This is in contrast to the earlier work attempting to pin a value to IT in the form of a percentage increase in productivity, as described in section (2.2). Recent literature suggests that it is also valuable to know how an IT can create value. For this purpose, most business value research has shifted from using production economics as theoretical basis, to employing a Resource-Based View (RBV) on IT (Santhanam & Hartono, 2003; Wade & Hulland, 2004).
Adopting an IT resource alone cannot provide a competitive advantage, because the resource will probably be easy to copy by competing firms. The RBV poses that the creation of valuable, rare, and
inimitable (VRIN) IT resources provides a competitive advantage (Aral & Weill, 2006). However, the
RBV does not seem to apply in dynamic markets (Eisenhardt & Martin, 2000), like the one concerning apps. The main reason for this is that competitive advantage from VRIN resources in fast-moving markets erodes because of the speed with which new technologies disrupt the market (Wheeler, 2002). To compete in dynamic markets, organizations need to continually build new, and reconfigure their existing VRIN resources to create novel forms of competitive advantage. This view is captured by the Dynamic Capabilities perspective, which is an extension of the RBV (Teece, Pisano, & Shuen, 1997).
The essence of the Dynamic Capabilities perspective is that competitive advantage comes from having strong capabilities in the form of routines that continually create and reconfigure VRIN resources (Teece, et al., 1997). Dynamic capabilities are “organizational routines through which firms achieve new resource configurations” (Eisenhardt & Martin, 2000, p. 1107). Examples of such capabilities are product development routines and strategic decision making. The capabilities themselves are not a source of competitive advantage; it is the effective evolution of the capabilities that provides long-term advantage (Wheeler, 2002). Learning mechanisms guide the evolution of the capabilities (Zollo & Winter, 2002). Because of market dynamism the effective evolution of the capabilities depends on a manager’s ability to assess and understand changes in the market and respond to them in a timely manner by reconfiguring organizational resources. Therefore, dynamic capabilities can be viewed as a combination of ‘simpler capabilities’ and their related routines for resource configuration (Wheeler, 2002).
BACKGROUND:APPS &ITBUSINESS VALUE 12 resource configurations and create value. For the purpose of answering RQ1, and providing a basis to answer RQ2, this study will use the Net-Enabled Business Innovation Cycle (NEBIC) formulated by Wheeler (2002). The NEBIC is a Dynamic Capabilities framework describing the creation of value through the business use of digital networks through four ‘simpler capabilities’ and related routines. The framework is explained in more detail and adapted to fit the context of app-enabled value creation in chapter 3.
2.3.3
T
HE DEPENDENT VARIABLE:
A
PP BUSINESS VALUEThe previous section argued that a Dynamic Capabilities approach is suitable to explain the process of app-enabled value creation by start-ups (i.e. RQ1). The outcome of this process, i.e. the dependent variable, is ‘app business value’. Section (2.3.1) explained that to capture different manifestations of business value, it is necessary to ‘look beyond productivity’. One of the aims of this study is to explain what type of value is created by apps (i.e. RQ2). Therefore, it is needed to formulate a categorization of the different manifestations of business value. Different conceptualizations of IT business value are present in the literature. For this investigation, app business value is conceptualized as a ten-dimensional construct obtained by combining four dimensions of the functional value IT can create, and three dimensions of the locus of the value creation within the value chain (figure 3). Below is an explanation of these dimensions.
Upstream Internal Downstream
Strategic
①
④
⑦
Outcome
Informational
②
⑤
⑧
Process & output
Automational
③
⑥
⑨
Infrastructural
⑩
Input
FIGURE 3. Ten-dimensional construct of ‘app business value’
Four different functional dimensions of IT business value are used as basis for conceptualizing the business value of apps (Aral & Weill, 2006; Mooney, Gurbaxani, & Kraemer, 1995; Weill, 1992).
Strategic value is related to transformational processes and refers to the capability of IT to gain competitive advantage through innovation and business transformation. Strategic value is created through, for example, increasing market share, meeting new demands, reducing cycle times, and improving products and services.
Informational value is related to decision and control processes and refers to the ability of IT to collect, store, process, and distribute information. Informational value is created through, for example, improving planning, control, information quality, and decision-making.
Automational value is related to operational processes and refers to the ability of IT to substitute labor for IT. Automational value is created through efficiency improvements and/or savings on labor costs.
BACKGROUND:APPS &ITBUSINESS VALUE 13 upstream while the other is downstream. Therefore, the infrastructural dimension forms the tenth business value dimension, which is independent of the locus of value described hereafter (i.e. upstream, internal, or downstream).
In addition to the above dimensions, three dimensions of electronic-business and mobile-business value can be found in the literature according to the locus of the value creation within the value chain (Kuo & Chen, 2008; Picoto, Palma-dos-Reis, & Bélanger, 2010; Zhu & Kraemer, 2005).
Upstream value lies on the supplier-side of the organization (business to business) and includes cost savings and/or efficiency improvements relating to procurement and supplier collaboration processes.
Internal value lies within the organization (business to employee and employee to employee) and refers to value created through the increase in efficiency and flexibility of employees and management.
Downstream value lies at the output-side of the organization (business to consumer, consumer to business, and business to business in the case of industrial customers) through, for example, facilitation of sales, customer driven innovation, and better customer service.
Combining the above dimensions conceptualizes app business value as a ten-dimensional construct as shown in figure 3. It should be noted that the four functional dimensions of the app business value construct can be related to each other. For example, purchasing a certain IT (i.e. infrastructural value) and using it to communicate with customers (i.e. automational value) can lead to the generation of useful customer-data. The gathered data can be used to improve decision making (i.e. informational value). The data combined with improved decision making could lead to better product and/or service innovation and more customer satisfaction (i.e. strategic value). In addition, the hardware and software used to communicate with the customers might also be used to communicate with suppliers in the future (i.e. infrastructural value).
The right half of figure 3 shows links between the four functional dimensions and some of the elements of the production system shown in figure 2. It is interesting to see that the app business value construct attempts to capture value associated to different elements of the production system. For obvious reasons, infrastructural value can result from the IT input to the production system. Automational and informational value are associated to the use of IT in business processes. The business processes can be split into operational and managerial processes (Mooney, et al., 1995). The operational processes are directly related to the ‘production’ of an organization’s value adding output (i.e. the product or service delivered). IT can produce automational value when production processes are automated. Managerial processes are related to the administration and control of an organization. Using IT for managerial processes can lead to informational value. Additionally, automational and informational value can also be associated to the product or service at the output of a production system. A product can be automated to perform certain tasks for customers, leading to repeat transactions without human interference. This leads to automational business value in the form of reduced delivery costs. Also, a product might allow customers to feedback useful ideas or recommendations, leading to the creation of informational business value.
The strategic value is associated to the outcomes of a production system, as it captures measures
such as growth, competitive capability, and customer satisfaction.
BACKGROUND:APPS &ITBUSINESS VALUE 14 the empirical investigation of the kind of business value that is created with apps. The indicators were extracted from the literature mentioned in this section. Overlapping indicators were combined to improve parsimony.
2.4
S
UMMARYSection (2) reviewed literature on apps and IT business value. The main points resulting from this review are described hereafter.
A working definition of apps for this study is formulated as follows: a use of an interface on a mobile phone or tablet pc by an end-user for a purpose that potentially holds business
value.
An ‘app ecosystem’ with different actors is given to provide an overview of the economic activity related to apps. This study focusses on the value related to the use of apps.
Studies on the business value of IT were reviewed and showed two main streams of research based on (1) production economics and (2) Dynamic Capabilities as an extension of the RBV.
A production economic-based model for the business value of apps is derived, but considered unfeasible to estimate because of data restrictions and limited knowledge on how to conceptualize an ‘app adoption’ variable.
More recent studies have revealed shortcomings in the production economic-based models, and several considerations resulting from these studies are formulated for guidance in designing the approach of this study. The main shortcoming is that production economic-based models are ‘black-box’ models, i.e. focusing on the relationship between in and output, hereby ignoring the process in-between.
The Dynamic Capabilities perspective on the creation of IT business value is useful to explain the process of how start-ups create value with apps. The NEBIC theory, a Dynamic Capabilities framework for net-enabled value creation guides the approach to answer RQ1.
FRAMEWORK FOR THE VALUE CREATION PROCESS:NEBIC 15
3
FRAMEWORK FOR THE VALUE CREATION PROCESS: NEBIC
This section presents the Net-Enabled Business Innovation Cycle (NEBIC). The NEBIC is a framework taking a Dynamic Capabilities perspective on internet-enabled value creation. The NEBIC will be used as an a priori framework to guide the data collection and analysis, and ultimately to support answering the research questions. The following section explains the premises of the NEBIC theory, followed by the adaptation of the NEBIC into an app-enabled business innovation cycle in section (3.2). Section (3.3) describes the role the ‘app’ plays in this model as the artifact under study.
3.1
T
HE NET-
ENABLED BUSINESS INNOVATION CYCLESection (2) has shown that this investigation should focus on the dynamic capabilities needed during
the process of value creation for the purpose of explaining how apps contribute to this value
creation (i.e. RQ1). There are multiple frameworks available that take a process perspective on IT business value creation (e.g. Melville, et al., 2004; Soh & Markus, 1995). Although most of these frameworks put emphasis on the interaction between IT resources and complementary factors, they fail to focus on the dynamic capabilities needed during the process of value creation. In other words, the routines with which IT resources are identified and used to generate value are ignored. The NEBIC is a framework made in the context of electronic-business that focusses on these value-creating routines during the IT adoption process (Wheeler, 2002). The NEBIC is an “applied dynamic capabilities theory for measuring, predicting, and understanding a firm’s ability to create customer value through the business use of digital networks” (Wheeler, 2002, p. 125). The theory describes four dynamic capabilities forming the cycle of value creation in net-enabled organizations (figure 4). Because of the focus on these dynamic capabilities as routines for value creation, and the closeness of net-enablement to app-enablement, the NEBIC model can prove useful as basis for the further investigation.
Choosing emerging/enabling
technology
Matching with economic
opportunities
Executing business innovation
for growth
Assessing customer value
Time Value
potential Value realized
Hi
Low
Hi
Low
External market
Internal organization
Conveying new IT insights
Communicating net-enabled initiatives
Taking value propositions to market
Feed-forward communication Market-based organizational learning Internal organizational learning
Legend:
FRAMEWORK FOR THE VALUE CREATION PROCESS:NEBIC 16 The NEBIC describes four sequenced capabilities that lead to the creation of customer value, and the processes that link them. The four capabilities reflect four activities described as follows (i.e. ovals in figure 4; for a more thorough discussion on the derivation of the capabilities see Wheeler, 2002).
Choosing emerging/enabling technologies: routines to identify, evaluate, and select promising technologies from the IT landscape. An IT is ‘emerging’ when it still needs development, and ‘enabling’ when it is commercially available and becoming pervasive.
Matching with economic opportunities: routines to combine the inputs from the choosing
capability, the business strategy, and the business context (e.g. customer trends). The result should be a revelation of new IT-induced economic opportunities.
Executing business innovation for growth: routines to (re)configure resources of the business to support business growth (e.g. set-up or adapt the organization, develop the product and/or service, set-up the supply chain and sales channels).
Assessing customer value: routines to measure and understand customers’ preferences and evaluations of the delivered value.
The processes (i.e. arrows in figure 4) describe learning from each of the four capabilities, communicating the results to the following capability, and feeding back market-based metrics. The dependent variable in the NEBIC theory is the outcome of the NEBIC in terms of ‘customer value’. This presents an incongruity with the dependent variable in this study, i.e. business value. Although customer value is not the same as business value, the two concepts are related (L. M. Hitt & Brynjolfsson, 1996). This also becomes clear by looking at the guiding business value indicators in appendix 1. The downstream business value dimensions include several indicators of customer value (e.g. improved customer communication and input possibilities, improved customer service and satisfaction). Additionally, Zahra and George (2002) suggest that researchers using the NEBIC theory incorporate outcome measures that are broader than customer value, for instance cost reductions attributed to net-enablement. Many of the downstream business value indicators are actually cost reductions associated to the use of IT for different purposes. This does not imply that apps do not hold upstream or internal value potential. However, it is arguably interesting to focus on the downstream dimension because of the recent proliferation of mobile devices among consumers. This is also the dimension where ‘branded-apps’, mentioned in the introduction, are struggling to create value. Following this reasoning, the NEBIC model is also applicable with ‘downstream business value’ as dependent variable, which is how the model is used in this study. The NEBIC model can be approached from both a variance and a process-based perspective. From a variance-based perspective, the model suggests that the four sequenced capabilities are discrete variables (i.e. can be high or low). The configuration of these variables will be related to the outcome in terms of created customer value.6 From a process-based perspective, the model suggests that effective feed-forward and feedback communication processes between the variables are necessary conditions to create value.7 In line with the discussion in the previous sections, this study takes a process perspective to explain how value is created and answer RQ1. By investigating what kind of value is created through this process, also RQ2 can be answered through this perspective. The theory will be used as an a priori framework to guide the collection and analysis of data. The data collected in this study will be used to confirm, refine, extend, or reject the proposed NEBIC process. This should result in a model explaining the entrepreneurial process of app-enabled value creation by start-ups.
6
For example, organizations with strong choosing, matching, and executing capabilities, but weak assessing capability, will create high levels of customer value unsustainable for longer periods of time.
7
FRAMEWORK FOR THE VALUE CREATION PROCESS:NEBIC 17
3.2
T
HE APP-
ENABLED VALUE CREATION CYCLE:
PROCESS PROPOSITIONSA series of theoretical propositions that explain the process of value creation follows from the NEBIC framework. However, the NEBIC framework describes processes that are valid for “particularly large firms” (Wheeler, 2002, p. 139). Therefore, the NEBIC propositions are adapted to fit the context of app-enabled start-ups before empirically validating them (see Wheeler, 2002, pp. 137-139 for the original propositions). The propositions are derived from the arrows of the NEBIC as shown in figure 4. The arrows represent the processes between the capabilities and explain the sequencing, as well as the mechanisms of interaction of the factors in the model.8 The propositions below will serve as basis for the empirical refinement and extension of the NEBIC.
Choosing emerging/enabling
technology
Matching with economic
opportunities
Executing business innovation
for growth
Assessing customer value
Time Business
value
External market
Internal organization
P1
P2
P3
Learning about emerging/enabling technologies
Learning about app-enabled economic opportunities
Taking app-enabled value proposition to market P7
P6
P5
P4
Feed-forward learning & communication Market-based learning
Internal feedback learning
Legend:
P8
FIGURE 5. Proposed app-enabled business innovation cycle (adapted from Wheeler, 2002;
P-numbers are references to the theoretical propositions discussed hereafter explaining the processes between the capabilities)
Almost all the original NEBIC propositions describe the processes between capabilities as organizational learning processes. There are different types of organizational learning processes9; the NEBIC theory focusses on intra-organizational learning through the distribution of knowledge and assumes that each of the four capabilities resides with different departments in an organization. The NEBIC processes are focused on communication routines involved in transferring knowledge from one department to the other, for example through memos, briefings, and business plans. In the case of the small start-ups, learning does not primarily focus on communication, because of the absence of a departmental organization. Usually, the entrepreneur alone, or with a small group, is involved in the initiative from beginning to end. As such, there is no direct need to
8
For example, choosing precedes matching, and they are connected to each other through learning processes.
9
FRAMEWORK FOR THE VALUE CREATION PROCESS:NEBIC 18 transfer the knowledge to a different group of people. Rather, entrepreneurs engage in ‘entrepreneurial learning’. This type of learning might include communication processes, but is primarily focused on cognitive learning processes. Entrepreneurs enhance their cognitive framework through this type of learning, which allows them to better identify, develop, and exploit opportunities (Baron, 2006). Therefore, the propositions below do not focus on communication as the learning process, but describe the processes as ‘entrepreneurial learning’. It is argued that entrepreneurial learning allows for ‘adaptive sense-making’ through the enhancement of cognitive frameworks, which is key for managers to cope in dynamic environments (Bogner & Barr, 2000).
The choosing capability includes routines to create insights on emerging and enabling technologies
that could support app-enabled value creation. These insights could relate to, for example, mobile technologies, internet technologies, or other technologies relevant to the app-enabled initiative. The resulting insights are input to the matching capability, which includes routines to combine technological insights, business strategy, and business context. The matching capability aims at revealing new app-enabled economic opportunities. To create business value through these economic opportunities, it is necessary to be able to effectively convey and use the technological insights from the choosing capability. For this purpose, the entrepreneurs need to engage in learning processes to create or change their understanding of the emerging and enabling technologies.
PROPOSITION 1. Effective entrepreneurial learning processes that create or change understanding are necessary between the choosing and matching
capabilities to create business value.
A similar feed-forward process as described above is needed between the matching and the
executing capability. Executing the business innovation needed for growth (e.g. building
organization, developing product) builds on the economic opportunities revealed by the matching
capability. To create business value, it is therefore necessary for the entrepreneur to engage in learning processes that clarify priorities and objectives of the app-enabled opportunities resulting from the matching capability. Only then will executing capabilities be able to effectively achieve business innovation.
PROPOSITION 2. Effective entrepreneurial learning processes that clarify priorities and objectives are necessary between the matching and executing capabilities to create business value.
The third feed-forward process represents taking a value proposition to the market. It is necessary
to communicate and deliver the value proposition that results from the (re)configuration of
resources to the marketplace. Failing to effectively communicate a value proposition to the market inhibits the realization of business value. Effective communication, for example, in the form of advertising, is a necessary condition to reach and attract the right customers. Failing to effectively
deliver a value proposition to the market also inhibits the realization of business value. For example,
failing to have reliable distribution channels and fulfill orders on time will lead to the loss of potential customers, even if the value proposition was effectively communicated to the market.
PROPOSITION 3. Effective communication and delivery processes are necessary from the
executing capability to the marketplace to create business value.10
10
FRAMEWORK FOR THE VALUE CREATION PROCESS:NEBIC 19 The two light dotted arrows in figure 4 are feedback processes in the form of internal learning. These learning processes help in understanding and conveying insights back to antecedent capabilities. These insights may come from, for instance, mistakes due to wrong choices that manifest themselves later on in the process, or the need for additional information from antecedent capabilities. Antecedent capabilities are strengthened by these insights, as it allows the capabilities to be carried out with a stronger frame of reference. Following are two propositions describing these processes.
PROPOSITION 4. The choosing capability is strengthened when entrepreneurial learning conveys insights from the matching capability.
PROPOSITION 5. The matching capability is strengthened when entrepreneurial learning conveys insights from the executing capability.
The four market-based organizational learning processes shown in figure 4 play an important role in the innovation cycle. Marketplace data gathered by the assessing capability can strengthen all the capabilities by providing guidance to the routines associated with the respective capability. Learning from, for example, customer preferences or behavior can help in adjusting the innovation cycle to a more favorable path. The marketplace data is conveyed to the four capabilities through learning processes. These processes include the selection and contextualization of the data resulting from
the assessing capability.
PROPOSITION 6. The choosing capability is strengthened when entrepreneurial learning is based on marketplace data.
PROPOSITION 7. The matching capability is strengthened when entrepreneurial learning is based on marketplace data.
PROPOSITION 8. The executing capability is strengthened when entrepreneurial learning is based on marketplace data.
The eight propositions presented above explain the mechanisms of interaction between the NEBIC capabilities. The propositions describe the processes depicted by the eight arrows in figure 4. They are essential to explain how entrepreneurs create or fail to create business value from net-enabled initiatives. This study will use the framework to guide the explanation of business value creation from app-enabled start-ups.
3.3
T
HE APP ARTIFACTFRAMEWORK FOR THE VALUE CREATION PROCESS:NEBIC 20 value creation that this study takes, i.e. apps are seen as an embedded system of value creation. To make it more concrete, consider the following. Apps could be seen as a commodity with monetary value because it has a sales price. For example, app developers can sell their app-software to individuals through the app stores, or to businesses, resulting in a financial transaction. Therefore, apps could be conceptualized through a financial proxy. However, this study aims at investigating the business value at the usage level, where it is embedded in an organizational context and leveraged in conjunction to the context to create some form of business value.
3.4
S
UMMARY The NEBIC theory, based on the dynamic capabilities perspective, will be used as an a priori framework to guide the collection and analysis of data. The aim is to answer RQ1 and meet the research goal by adapting the NEBIC model to result in a theory explaining the entrepreneurial process of value creation with apps.
The dependent variable of the NEBIC theory, i.e. customer value, can be justifiably adapted to fit the dependent variable in this study, i.e. downstream business value.
A series of theoretical propositions that explain the process of value creation are derived from the NEBIC model and adapted to fit the context of the app-enabled start-ups under study. These propositions will serve as basis for the empirical confirmation, refinement, and extension of the NEBIC.
METHODOLOGY 21
4
METHODOLOGY
4.1
R
ESEARCH STRATEGYThe previous chapter formulated eight propositions for the process of app-enabled value creation by start-ups based on the NEBIC theory. The propositions were used as a priori guidance for the collection and analysis of data. The focus lies on confirming, refining, or rejecting these propositions, or extending the theory with new propositions, for the purpose of providing a valid explanation of how start-ups create value with apps (i.e. RQ1). Combined with an assessment of the type of business value that results from the value creation process (i.e. RQ2), this study meets its main research goal, namely providing an explanation of the business value of apps.
The propositions provide a subjective understanding of reality as a basis to develop further understanding through empirical validation (Lee, 1991). To empirically validate this subjective understanding within the research setting, Wheeler states that a researcher could follow two distinct approaches via (1) positivist and (2) interpretivist research. A positivist approach would aim at describing cause and effect relationships among the NEBIC capabilities by using variance-based techniques such as regression analysis. An interpretivist approach focuses on explaining the relationships between the NEBIC capabilities and is concerned with interactions between capabilities and their sequencing. Using the insights from Markus and Robey (1988), Wheeler argues that the NEBIC process explanations as given by the propositions should be investigated using
interpretivist case studies, which is the research strategy this study follows. Interpretivist research
“attempts to understand phenomena through the meanings that people assign to them” (Klein & Myers, 1999, p. 69), and is “aimed at producing an understanding of the contextof the information system, and the process whereby the information system influences and is influenced by the context” (Walsham, 1993, pp. 4-5). As such, the aim of interpretivist research is in line with what this study attempts to accomplish.
There is an additional reason for not applying the model in a positivist fashion. It is likely that the four NEBIC capabilities play a role in the value creation process with apps. Nevertheless, the conceptualization of the NEBIC theory and the operationalization of the capabilities into empirical indicators are done in the context of net-enablement at large organizations. This study is set in the context of the smaller start-ups and a more specific form of net-enablement, namely app-enablement. It is yet unclear what the important factors are for value creation in this setting.11 As such, it remains also unclear how to operationalize the capabilities to appropriately measure them in the study setting. However, the results of this study include an identification of sample empirical indicators for the capabilities in the context of app-enablement. This helps future studies to create reliable measurement instruments that can be used in positivist studies.
An important issue to discuss is the use of theory in interpretive studies. There is a common notion in interpretivist research that the use of prior theory might blind the researcher and stifle the revelation of new and interesting understanding of a phenomenon (Walsham, 1995; Wheeler, 2002). However, if a researcher preserves the flexibility to modify a theory based on the interpretations of the data, theory can be