ISSN Online: 2161-7589 ISSN Print: 2161-7570
DOI: 10.4236/ojg.2017.78072 Aug. 11, 2017 1078 Open Journal of Geology
Analyzing Factors Affecting Erosion and
Sedimentary Deposits Using the Empirical
Method of PSIAC
Abdolreza Alijani
1*, Armita Alijani
2, Nader Kohansal Ghadimvand
3, Mohsen Aleali
41Geology-Sedimentary Lithology and Sedimentology, Department of Geology, Science and Research Branch,
Islamic Azad University, Tehran, Iran
2Offshore and Marine Structure Engineering, Science and Research Branch, Islamic Azad University, Tehran, Iran
3Department of Geology, North Tehran Branch, Islamic Azad University, Tehran, Iran
4Department of Geology, Science and Research Branch, Islamic Azad University, Tehran, Iran
Abstract
PSIAC empirical method is considered as one of the methods calculating and estimating the amount of erodibility and sedimentation of sedimentary depo-sits in sedimentary basins and dams’ reservoirs. This method is based on ana-lyzing nine influential factors including: surface geology, solid, weather, ru-noff, unpaved area, limited plant coverage, land usage, high lands erosion, river erosion and sediment transportation. These factors are rated according to their level of importance. The case study of this research is Lali Water Cat-chment, Khuzestan, Iran. The amount and intensity of adorability will be ranked as low, moderate and high. This research is based on field work, labo-ratorial studies and analyzing results obtained from statistics. Results indi-cated that the unpaved area and high land erosion are identified as the most effective factors, respectively. In contrast, runoff and surface geology are con-sidered as the lowest rate. Other factors reflect moderate effects. Since any significant studies have not been done in this regard, the current research can present a new method to scrutinize the empirical effects of these factors. It is noteworthy to highlight that different methods are compared with each other in order to scrutinize the amount of erodibility in most studies, but the present study has analyzed the influential factors of the sub-methods of one major method. This essay focuses on the affectability of each one of the nine factors, independently. In conclusion, the outcomes of this research can con-tribute to identify and determine suitable alternatives to stabilize sedimentary basins and increase the life span of dams and watershed management projects and also reduce the destructive effects of floods. Additionally, it contributes civil projects in such lands.
How to cite this paper: Alijani, A., Alijani, A., Ghadimvand, N.K. and Aleali, M. (2017) Analyzing Factors Affecting Erosion and Sedimentary Deposits Using the Em-pirical Method of PSIAC. Open Journal of Geology, 7, 1078-1093.
https://doi.org/10.4236/ojg.2017.78072
Received: July 6, 2017 Accepted: August 8, 2017 Published: August 11, 2017
Copyright © 2017 by authors and Scientific Research Publishing Inc. This work is licensed under the Creative Commons Attribution International License (CC BY 4.0).
http://creativecommons.org/licenses/by/4.0/
DOI: 10.4236/ojg.2017.78072 1079 Open Journal of Geology
Keywords
Erodibility, Sedimentation, PSIAC Empirical Method, Sedimentary Basins, Dams’ Reservoir
1. Introduction
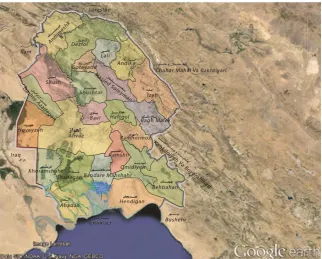
Since phenomena like erosion, sediment and sedimentation are regarded as sig-nificant factors in the rivers’ water catchments and the settlement of sediment load in sedimentary basins and engineering-civil projects, specifically dams’ re-servoirs, various studies have been done in accordance with the importance of project and different methods of estimating the amount of sediment. Few studies have been held to compare the methods applied to assess the amount and type of the parameters affectivity. Lali area is located in Khuzestan province, Iran. It is almost 200 km away from the north of Ahwaz, the province center; it covers ap-proximately 300 km2 surface areas (Figure 1). From geological aspect, it is si-tuated in the structural-sedimentary zone of the folded Zagros [1]. According to the fact that Lali area holds all the nine factors producing sediment and causing erosion, it is possible to investigate and measure them in this area using the em-pirical PSIAC method. Thus, all the effective parameters are easily available in this area so as to analyze them. That is why Lali area has been chosen.
[image:2.595.213.536.431.690.2]The surface quality and quantity contribute to consider erosion in rivers; however, engineering projects focus on the quality factors. Quality factors hold
DOI: 10.4236/ojg.2017.78072 1080 Open Journal of Geology determining the properties of water catchment and river bed, the amount and type of transported sediments and varying the bed gradation [2].
Morphological changes of the river rely on the amount of sediment entering into the river and the sediment removing from the water catchment basin. Moreover, it is essential to figure out how the rivers erosion is influenced by se-dimentary load transportation of upstream, the plant coverage and tectonic and geological phenomena to analyze the eroding pattern in rivers’ sedimentation and its effects [3] and [4]. Hence, it is possible to assess the sedimentary yield produced by erosion and sedimentation using PSIAC (Pacific Southwest Inter Agency Committee) PSIAC Empirical method and other similar quality methods practiced in this research [5].
The erosion amount of rock units and sediments transported into sedimenta-ry basins is identified as parameters specifying the geomorphologic properties and the characteristics of the accumulation and/or replacement of sedimentary masses. The surface percentage of rock units in the intended area is applied to calculate the erosion index of the area’s geological units and determine the se-diment frequency in Lali area [6].
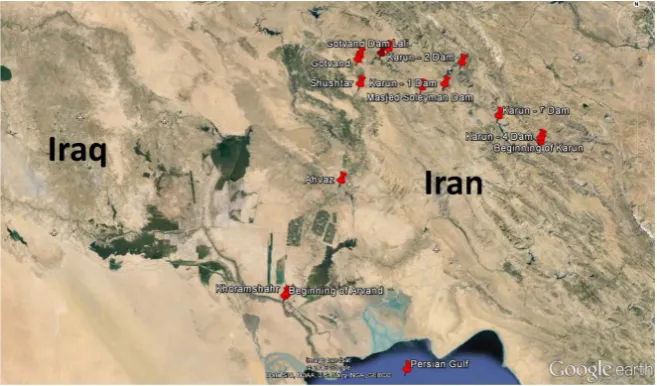
Both the quantity and quality made by sedimentation and erosion phenomena depend on the amount of its extension and the situation of water catchment. In the current research, the water catchment is Karun River, one of the largest wa-ter catchments in Iran (Figure 2).
[image:3.595.209.538.512.705.2]Regarding the trend of global warming process and the extreme extension of dry and semi-arid areas all across the world like Iran and irregular rainfall dis-tribution in these areas during a year, it is important to retain and store water resources in dams’ reservoirs. As a huge ratio of runoff in Iran flows into Khu-zestan Plain through Karun River, it is significant to investigate and store this amount of runoff to be used in dry seasons of year. In consequence, preserving dams’ reservoirs and lengthening their life span should be measured more in
DOI: 10.4236/ojg.2017.78072 1081 Open Journal of Geology order to store more water resources. Moreover, the amount of sedimentation in dams’ reservoirs and sedimentary basins should be inspected as well. Finally, factors influencing erosion and sedimentation in the intended areas should be analyzed and evaluated and the type and the amount of discharges with the ratio of water flowing into basins and reservoirs should be exactly specified.
Research Scope
This research aims at finding out the answers of the following questions:
- How much is the affectability of each one of the parameters in PSIAC me-thod?
- Which of these parameters affect the rate of erodibility the most?
- How can the climatic and geographical conditions influence erosion?
- How can the geological conditions and the formations of the area’s soil and stone affect sedimentation and erodibility?
- How the effective parameters influence each other?
2. Review of Literature
Several base studies have been done in this regard, for example, various investi-gations have revealed the relationship between sediments produced by water catchment basins with the climatic hydrologic and geomorphologic factors.
Norlan (1986) evaluated the amount of erodible formations as the origin of floating yield in California [7]. Kasimir, et al. (1995) indicated that small basins with the quantity of looser formations influence the load of floating sedimentary
[8]. Khojeini and Nezhadha Shami (1998) demonstrated the influence of erodi-ble formations on sediment production in water catchment of Taleghan, Iran
[9]. Ghadimi Arusmahalleh and Aminsobhani (1998) showed the effect of sedi-mentation on Shale and marl and erodible formations in Namak Lake of Iran
[10] and [11].
Alijani (2016) indicated that the type of lithology and formation of the area affect the amount of sedimentation and erosion. Stronger formations had less sediment than weaker ones like Bakhtiari conglomerate formation and Asmari lime formation [12] and [13].
3. Methodology
DOI: 10.4236/ojg.2017.78072 1082 Open Journal of Geology and the amount of plant coverage and the nine parameters of PSIAC method. For the next step, the data are analyzed and the scores are compared by empiri-cal formulas and simulated. Holistiempiri-cally, each one of the nine factors is classified as low, moderate and high from the aspect of sedimentation and erodibility based on the scores [15]. In consequence, the average of the scores is determined using statistical methods. Thus, the statistical values are figured out such as minimum, maximum, median, mode, standard deviation and the amount of se-dimentation and erodibility in the area.
Remarkably, this research has analyzed the effects of each influential parame-ter on sedimentation and erodibility, separately. For example; the effect of runoff phenomenon on the area’s plant coverage, the soil type depending on geological formations or the relationship between the area’s topography and the erodibility rate of the river and sediment transportation.
4. Setting of Empirical Estimation of Sediments
The minimum and maximum scores have been recommended for these nine important factors affecting the erosion. The amount of the erosion potential of the water catchment will be calculated by the sum of scores and determination of the whole score [16]. The statistical information mostly obtained through consi-dering the nine factors of PSIAC method affecting erosion and sedimentation. Analyzing and investigating each one of these nine factors can figure out which one of them is the most effective factor and which one is the lowest one. Surface geology, runoff, type of plant coverage, topography and unpaved areas consi-dered as the most influential ones [17] and [18].
It should be pointed out that the amended PSIAC method suggests using the above mentioned Empirical formulas along with identifying and evaluating the quality factors of all the nine factors in order to exactly determine the score re-lated to each factor. The main points affecting erosion are as the following: sur-face geology, soil, weather, runoff, unpaved areas, plant coverage, ground usage, high lands erosion, river erosion and sediment transportation [19] and [20].
Therefore, some tables have been presented to classify the erodibility of sedi-ments as the following.
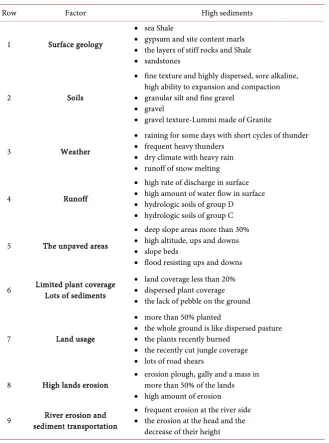
Table 1 presents the classification of the nine important factors affecting ero-sion and producing sediments erodibility based on high redundancy of sedi-ments.
Table 2 indicates the classification of the nine important factors affecting ero-sion and producing sediments erodibility based on moderate redundancy of se-diments.
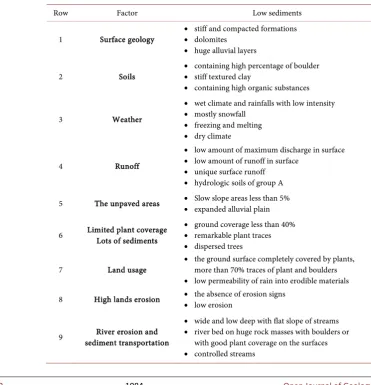
Table 3 shows the classification of the nine important factors affecting erosion and producing sediments erodibility based on low redundancy of sediments.
DOI: 10.4236/ojg.2017.78072 1083 Open Journal of Geology
Table 1. The classification of erodibility in case there are lots of sediments.
Row Factor High sediments
1 Surface geology
• sea Shale
• gypsum and site content marls
• the layers of stiff rocks and Shale
• sandstones
2 Soils
• fine texture and highly dispersed, sore alkaline, high ability to expansion and compaction
• granular silt and fine gravel
• gravel
• gravel texture-Lummi made of Granite
3 Weather
• raining for some days with short cycles of thunder
• frequent heavy thunders
• dry climate with heavy rain
• runoff of snow melting
4 Runoff
• high rate of discharge in surface
• high amount of water flow in surface
• hydrologic soils of group D
• hydrologic soils of group C
5 The unpaved areas
• deep slope areas more than 30%
• high altitude, ups and downs
• slope beds
• flood resisting ups and downs
6 Limited plant coverage Lots of sediments
• land coverage less than 20%
• dispersed plant coverage
• the lack of pebble on the ground
7 Land usage
• more than 50% planted
• the whole ground is like dispersed pasture
• the plants recently burned
• the recently cut jungle coverage
• lots of road shears
8 High lands erosion
• erosion plough, gally and a mass in more than 50% of the lands
• high amount of erosion
9 sediment transportation River erosion and
• frequent erosion at the river side
• the erosion at the head and the decrease of their height
Table 2.The classification of erodibility in case there are moderate sediments.
Row Factor Moderate sediments
1 Surface geology
• rocks
• crumpled or moderately weathered stones
• moderately fractured stones
• granites (igneous)
• fine limy stones
• conglomerate
• lime stone with thick layers
2 Soils
• moderate texture
• dispersed boulder
• limy layers
• pebble texture
[image:6.595.207.537.555.746.2]DOI: 10.4236/ojg.2017.78072 1084 Open Journal of Geology Continued
4 Runoff
• maximum moderate discharge
• moderate amount of runoff in surface
• hydrologic soils of group B
5 The unpaved areas
• plateau with moderate slope less than 20%
• expansion of flood resisting areas with fan shaped physiographic units
• slow slope areas less than 5 %
6 Limited plant coverage Lots of sediments
• ground coverage less than 40%
• remarkable plant traces
• dispersed trees
7 Land usage
• less than 25% planted
• less than 50% being extremely grazed
• less than 50% of the jungle coverage recently cut.
8 High lands erosion
• the presence of various types of erosion in about 25% of the lands
• wind erosion with sedimentation in water canals
• moderate erosion
[image:7.595.163.535.360.746.2]9 sediment transportation River erosion and • flow with depth and moderate continuity with frequent erosion at the river side or river bed
Table 3. The classification of erodibility in case there are low sediments.
Row Factor Low sediments
1 Surface geology
• stiff and compacted formations
• dolomites
• huge alluvial layers
2 Soils
• containing high percentage of boulder
• stiff textured clay
• containing high organic substances
3 Weather
• wet climate and rainfalls with low intensity
• mostly snowfall
• freezing and melting
• dry climate
4 Runoff
• low amount of maximum discharge in surface
• low amount of runoff in surface
• unique surface runoff
• hydrologic soils of group A
5 The unpaved areas •• Slow slope areas less than 5% expanded alluvial plain
6 Limited plant coverage Lots of sediments
• ground coverage less than 40%
• remarkable plant traces
• dispersed trees
7 Land usage
• the ground surface completely covered by plants, more than 70% traces of plant and boulders
• low permeability of rain into erodible materials
8 High lands erosion •• the absence of erosion signs low erosion
9 sediment transportation River erosion and
• wide and low deep with flat slope of streams
• river bed on huge rock masses with boulders or with good plant coverage on the surfaces
DOI: 10.4236/ojg.2017.78072 1085 Open Journal of Geology
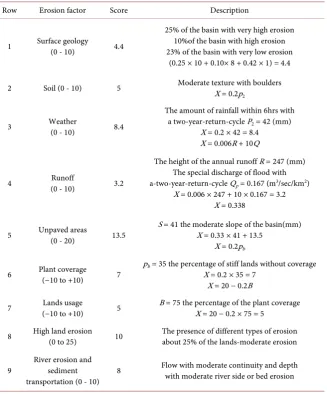
Table 4.Estimating the scores of erosion factors using PSIAC method in Harkesh river
catchment to the central situation of the intended area (basin surface = 323.5 km2).
Row Erosion factor Score Description
1 Surface geology (0 - 10) 4.4
25% of the basin with very high erosion 10%of the basin with high erosion 23% of the basin with very low erosion
(0.25 × 10 + 0.10× 8 + 0.42 × 1) = 4.4
2 Soil (0 - 10) 5 Moderate texture with boulders X = 0.2p 2
3 Weather (0 - 10) 8.4
The amount of rainfall within 6hrs with a two-year-return-cycle P2 = 42 (mm)
X = 0.2 × 42 = 8.4 X = 0.006R + 10Q
4 (0 - 10) Runoff 3.2
The height of the annual runoff R = 247 (mm) The special discharge of flood with a-two-year-return-cycle Qp = 0.167 (m3/sec/km2)
X = 0.006 × 247 + 10 × 0.167 = 3.2 X = 0.338
5 Unpaved areas (0 - 20) 13.5 S = 41 the moderate slope of the basin(mm) X = 0.33 × 41 + 13.5 X = 0.2pb
6 Plant coverage (−10 to +10) 7 pb = 35 the percentage of stiff lands without coverage X = 0.2 × 35 = 7 X = 20 − 0.2B
7 (−10 to +10) Lands usage 5 B = 75 the percentage of the plant coverage X = 20 − 0.2 × 75 = 5
8 High land erosion (0 to 25) 10 The presence of different types of erosion about 25% of the lands-moderate erosion
9 River erosion and sediment transportation (0 - 10) 8
Flow with moderate continuity and depth with moderate river side or bed erosion
Score sum: 64.5. Regarding the amounts, the total sum of the basin scores has been calculated 64.5. The av-erage amount of the annual erosion can be estimated in the basin. Qs = 38.77 exp (0.358 R). Where: R: the sum of the scores. Q = the erosion amount of the basin in m3/km2 per year.
5. Discussion
PSIAC empirical method is identified as one of the most significant methods es-timating the rate of sedimentation and erodibility in water catchments. This method has also been applied in this research to calculate the erodibility score of sedimentary basins in Lali area. This study has analyzed nine factors affecting erosion due to the area’s climatic conditions and has scored the maximum, minimum points. The total point achieved by adding up these scores altogether and the erodibility amount of the water catchment is estimated [21] and [22]. The limits of co-efficiencies and influential factors are presented in Tables 1-3. In addition, Table 4 presents the estimation of erosion factors using PSIAC me-thod in Harkesh river catchment to the central situation of the intended area.
iden-DOI: 10.4236/ojg.2017.78072 1086 Open Journal of Geology tifying the levels of the sedimentary levels mostly based on determining the type of sediment, the rate of sediment stiffness or looseness. In fact, harder sediments with more condensed grading are found on higher sedimentary levels like the sediments made up of lime stone. In contrast, looser sediments with weaker grading are observed in areas with low topography like the sediments produced by marl and silt. Moreover, it is essential to identify the type of soil based on pe-diology standards and the standards specifying the sediments gradation like ASTM (American Standard Test Material) and BSTM (British Standard Test Material).
As observed in the aforementioned tables, the scores related to each one of the factors affecting erosion are represented as formulas and relationships so as to determine them more properly in PSIAC method [23]. These empirical formulas and other specific qualities related to the nine factors include: surface geology, soil, weather, run-offs, unpaved areas, plant coverage, land usage, high land ero-sion, river erosion and sediment transportation [24] and [25].
Scores remarked for each of the erosive factors and the method or the reason of its quality amount is illustrated in Table 2.
1) Surface geology
Based on geological studies in the area of the case study, the coverage, rock units and geological formations are as the following:
- The lime stone of Asmari formation and somehow Sarvak with very low ero-dibility cover almost 42% of the under-study area.
- Shale and marl of Pabdeh Gurpi formations cover 10% of the area and have moderate to high erodibility.
- The quaternary alluvia deposits cover 7% of the area with very high erodibil-ity.
Consequently, the surface below Lali area water catchment covers about 25% of the area with potential of high erodibility, 10% of the basin reflects high ero-sion, and 23% holds low erodibility and almost 42% of the water catchment gas low potential of erodibility.
As observed in Table 2, very high sediments scored 10, high sediment got 8, the moderate one got 3 and the low sediments marked 1, then the score 4.4 out of 10 was estimated for surface geology.
2) Soil
Based on field work and local investigations on the soil type of water catch-ment area, it was evaluated that the soil texture of this basin is rated moderate from producing erosion point of view and it was scored 5. The dominant soil contains dispersed pebbles with lime layers. Therefore, soil holds a moderate texture.
3) Weather
The following empirical formula was used in PSIAC method:
2
DOI: 10.4236/ojg.2017.78072 1087 Open Journal of Geology P2 indicates a six-hour-rainfall of water catchment with a two-year-returning period. The thunder rate of this water catchment is varied due to time intervals and different turning periods. It is estimated that the maximum thunder inten-sity is 7 mm within 2 years. This number is actually equal to 42 mm within 6 hours in a two-year-frequency. Holistically, the score related to the weather will be 8.4 [26] and [27].
4) Run-offs
PSIAC method is also practiced for run-offs. Hence, the following relation is applied to determine the scores:
0.006 10 P
X = R+ Q
where
R = the height of the annual run-off
Qp = the special discharge of the basin flood within a-two-year-turning period. As there aren’t any measuring stations on the river of this area, the average of the flood runoff and the high discharge climax of the area’s hydrology specify the amounts of R and Q [27] and [28]. In fact, it is estimated at 3.2.
5) Unpaved Areas
As shown in Table 2, PESIC method and the given formula are practiced for this factor.
The relationship is as below:
0.33
X
=
S
where
S = the average slope of the basin in percentage
X = the score related to unpaved areas.
Based on the morphology of this area, the average slope of the area is 41% and the score given to unpaved factor is 3.5.
6) limited plant coverage
Due to local observations, it is estimated that the lands are stiff and have no plant coverage [29].
The relation below is applied:
0.2 B
X = P where
PB = the percentage of stiff land with no coverage
X = the score given to the condition of the land coverage.
It should be pointed out that plant coverage; stone and mush protect the soil. Most part of the soil is ready for stiffness and can’t have such coverage [30] and
[31]. Therefore, plant coverage is scored 7.
7) Land usage. The following relationship is used in PSIAC method: 0 0.2
X = − b
where b shows the plant coverage of high lands and X is the score. So, the score 6 is given to land usage.
DOI: 10.4236/ojg.2017.78072 1088 Open Journal of Geology Investigations specified that the amount of wind erosion is very low. It is con-cluded that most of the erosion is made by water in this area. Laminated layers are caused by this type of erosion. In fact, intense and short rainfall, deep steep and lack of plant coverage are the main reasons. The sol is almost made up of soft geological formations and the soil is erodible like marl and silt [32] and [33].
Based on the amounts estimated for each of the nine factors, the total annual volume is 1.3 m/ton. The amount erosion is 507 ton/y/m2.
Regarding to the outcomes of scoring nine effective factors of PSIAC method and analyzing the statistical results, the maximum, minimum, mode, medi 5 and standard deviation are as below:
Min = 3.2 Max = 13.50 Average = 7.167
Standard deviation = 3.22 Median = 7.9
Mode = 5
These scores indicate moderate erosion is dominant in this area. Moreover, it is not possible to depict a meaningful relationship between the erosive factors and the score based on the exponential relation of the equation, the high regres-sion and low amount of regresregres-sion number (R2). However, all the nine factors affecting erosion and sedimentation are evaluated as moderate [34] and [35].
Therefore, the three following graphs have been depicted in order to specify the factors affecting erosion and sediment production of the soil of the under study area and also determine the equation as well as the regression co-efficiency of the above mentioned parameters.
The Graph 1 indicates the role of the most effective factors on erodibility and sediment production.
Graph 2 Presents the curve changes of sediment erodibility-the scoring based on PSIAC method in Lali area Water catchment.
Graph 3 illustrates the relationship of the erodibility of the nine factors based on PSIAC method.
6. Conclusions
PSIAC empirical method is recognized as one of the most significant methods estimating the rate of sedimentation and erodibility in water catchment basins. This method has also been applied in this research to calculate the adorability number of sedimentary basins in Lali area.
DOI: 10.4236/ojg.2017.78072 1089 Open Journal of Geology
Graph 1. The curve changes of sediment and erodibility based on the most effective fac-tors including weather, runoff, unpaved areas and high land erosion-the scoring based on PSIAC method in Lali area Water catchment.
Graph 2. The curve changes of sediment erodibility-the scoring based on PSIAC method in Lali area Water catchment. 1-surface geology, 2-solid, 3-weather, 4-runoff, 5-unpaved area, 6-limited plant coverage, 7-land usage, 8-high lands erosion, 9-river erosion and se-diment transportation.
DOI: 10.4236/ojg.2017.78072 1090 Open Journal of Geology
Graph 3. The relationship of the erodibility of the nine factors based on PSIAC method. 1-surface geology, 2-solid, 3-weather, 4-runoff, 5-unpaved area, 6-limited plant coverage, 7-land usage, 8-high lands erosion, 9-river erosion and sediment transportation.
In areas where floods frequently occur, it is better to provide plant coverage or plant trees especially in watershed management projects.
The analyses of the results imply that this area has been situated in a moderate classification from the view point of adorability and sedimentation because there are both hard and strong formations along with the weak and loose ones. Con-clusively, weak and loose formations are more probable to be exposed to erosion and the balance of these two types of formations ranges this area as a moderate one from the view point of erodibility and sedimentation.
7. Suggestions
The following items are suggested regarding the studies and observations in ero-sion phenomenon, sedimentation and sediment accumulation in dams’ reser-voirs and sedimentary basins.
• Fundamental studies on the amount of sediment discharge into dams’
reser-voirs are led into identifying factors influencing the increase of sedimentary yield with water entering into reservoirs. Suitable alternatives are taken into account to diminish its harmful effects by analyzing the data of these studies.
• These basins are exactly assessed to scrutinize the amount of sediment
pro-duction in the geological formations located in water catchments leading into identifying formations ready to be eroded.
• Detecting factors affecting the erosion process is led into selecting the most
appropriate methods to diminish the effects of these processes and control its hazardous effects in the intended area before starting any civil project, spe-cifically dam construction studies.
Acknowledgements
DOI: 10.4236/ojg.2017.78072 1091 Open Journal of Geology and scientific experts who contributed to prepare this research, Islamic Azad University Science and Research of Tehran and the dean of geology department, Dr. Ali Solgi. The author also thanks the water and electricity organization of Khuzestan for the sake of their contribution. The author respectfully appreciates the head manager of Ab-Niru consultant engineering, Dr. Hussein Jalali and the technical exclusive manager of Ab-Niru consultant engineering, Engineer Hasan Nabavi.
References
[1] Nabavi, M.H., et al. (2005) Report on General Geology and Engineering of Taraz
Dam. Ab-Niru Consultant Engineers Company, Tehran.
[2] Govers, G. and Rauws, G. (1986) Transporting Capacity of Overland Flow on Plane
and on Irregular Beds. Earth Science Processes and Landforms, 11, 515-524. https://doi.org/10.1002/esp.3290110506
[3] Mavhima, G., Soropa, G., Makurira, H. and Dzvairo, W. (2011) Sedimentation
Im-pacts on Reservoir as a Result of Land Use on a Selected Catchment in Zimbabwe. International Journal of Engineering Science and Technology, 3, 6599-6608.
[4] Annandale, G.W. (1987) Reservoir Sedimentation. Elsevier, Amsterdam.
[5] Feiznia, S. (2008) Applied Sedimentology on Soil Erosion and Sediment Production.
Faculty of Agricultural Science and Natural Resources, Gorgan.
[6] Veatot, D., et al. (2005) Predicting Soil Erosion and Sediment Field at the Basic
Scale Issue and Sediment—Quantitatine Models. Earth Science Reviews, 71, 95-125. https://doi.org/10.1016/j.earscirev.2005.02.002
[7] Norlan, K.M., Janda, R.J. and Galton, J.H. (1986) Sediment Source and Sediment
Transport Curves. Processing of the Fourth Federal Interagency Sedimentation Conference, Las Vegas, 4-79.
[8] Kasimir, M., Besar, I. and Sowa, A. (1995) Influence of Geology of Erosion and
Se-diment Yield, Human Activities of the Environment in Selected Areas in Southern Nigeria. New Delhi.
[9] Khojeini, A. and Nezhadhashemi, M.A. (1998) A Study on Sediment Production in
Taleghan Watershed. Pazhuhesh and Sazandegi, 10-13, 39.
[10] Ghadimi Arusmahalleh, F., et al. (1998) Analyzing the Floating Sediments in
Na-mak Lake Watershed. Pazhuhesh and Sazandegi, 36-41.
[11] Aminsobhani, F., et al. (1998) A Study on Zone’s Sedimentation and Geological
Eras in Namak Lake Watershed. Pazhuhesh and Sazandegi, 36-41.
[12] Alijani, A.R., et al. (2016) A Study on the Types of Effective Climatic Conditions
and Parameters Producing Sediment and Sedimentation in Dams’ Reservoirs (Case Study: Lali Area, Khuzestan, Iran). Indian Journal of Science and Technology, 9, 1-
10.https://doi.org/10.17485/ijst/2016/v9i36/94556
[13] Alijani, A.R. and Alijani, A. (2017) Evaluating the Effective Climatic Parameters of
Temperature and Rainfall on Sedimentation and Settlement of Deposits at Lali Area in Karun Water Catchment in Iran. International Journal of Engineering Science Technology and Research, 2, 102-112. http://www.ijestr.com
[14] Chitata, T., Mugabe, F.T. and Kashaigili, J.J. (2014) Estimation of Small Reservoir
Sedimentation in Semi-Arid Southern Zimbabwe. Journal of Water Resource and
Protection, 6, 1017-1028.
DOI: 10.4236/ojg.2017.78072 1092 Open Journal of Geology New York.
[16] Alijani, A.R., et al. (2016) Evaluating the Amount of Erodibility and Sedimentation
by Comparing Sediment Weight Model and PSIAC Empirical Model (Case Study:
Lali Water Catchment, Khuzestan, Iran). Open Journal of Geology, 6, 691-702.
https://doi.org/10.4236/ojg.2016.68053
[17] Soleimani-Asl, S. and Aleali, M. (2016) Microfacies Patterns and Depositional
En-vironments of the Sarvak Formation in the Abadan Plain, Southwest of Zagros. Open Journal of Geology, 6, 201-209. https://doi.org/10.4236/ojg.2016.63018
[18] Colman, D.J., et al. (1986) Identification and Evaluation of Sediment. IAHS, New
York.
[19] Parker, G. (1990) Surface Based Bed Load Transport Relationship for Gravel Rivers.
Journal of Hydraulic Research, 28, 417-443 https://doi.org/10.1080/00221689009499058
[20] Sui, J., et al. (2009) Changes in Sediment Transport in Kuye River in the Loess
Pla-tean in China. International Journal of sediment Research, 24, 201-213.
[21] William, A. (2007) Erosion and Sedimentation. The Gale Group Inc., New York.
[22] Ristic, R., Ljujic, M., Despotovic, J., Aleksic, V., Radic, B., Nikic, Z., Milcanovic, V.,
Malusevic, I. and Radonjic, J. (2013) Reservoir Sedimentation and Hydrological Ef-fects of Land Use Changes-Case Study of the Empirical Dicina River Watershed. Carpathian Journal of Earth and Environmental Sciences, 8, 91-98.
[23] Alijani, A.R., et al. (2016) A Study on the Types of Effective Climatic Conditions
and Parameters Producing Sediment and Sedimentation in Dams’ Reservoirs (Case Study: Lali Area, Khuzestan, Iran). Indian Journal of Science and Technology, 9, 1-
10.https://doi.org/10.17485/ijst/2016/v9i36/94556
[24] Kramer, L.A. and Meyer, L.D. (1969) Small Amount of Surface Runoff Reduce Soil
Erosion and Runoff Velocity. Transactions of the American society of Agriculture
Engineering, 12, 638-648.
[25] Sharma, K.D. (1992) Runoff and Sediment Transport in an Arid Zone Drainage
Ba-sin. PhD Thesis, Indian Institute of Technology, Bombay.
[26] FAO (1987) Soil and Water Conservation in Semi-Arid Areas. Soil Bulletin, 17,
1-17. https://doi.org/10.1080/02626668809491261
[27] Mashkuti, A.H. (2015) The Application of Statistical Model in Evaluating Climatic
Changes and Its Effects. Islamic Azad University of Science and Research of Tehran Press, Tehran.
[28] Warren, J.K. (2006) Evaporates. Sediments, Resources and Hydrocarbons. Springer-
Verilog, 1035.
[29] Ragab, R. and Prudhomme, C. (2002) SW—Soil and Water: Climate Change and
Water Resources Management in Arid and Semi-Arid Regions: Prospective and Challenges for the 21st Century. Biosystems Engineering, 81, 3-34.
https://doi.org/10.1006/bioe.2001.0013
[30] Miller, C.R. (1951) Analysis of Flow-Duration. Sediment-Rating Curve Method of
Computing Sediment Yield. U.S. Bureau of Reclamation, Denver.
[31] Strand, R.I. and Pemberton, E.L. (1982) Reservoir Sedimentation. U.S. Bureau of
Reclamation, Denver.
[32] Moss, A.J., Walker, P.H. and Hutka, J. (1980) Movement of Loose, Sandy Detritus
DOI: 10.4236/ojg.2017.78072 1093 Open Journal of Geology
[33] Change, G.N. (1953) Fluvial Hydraulic OD Delta and Alluvia Fans. Journal of
Hy-draulics Division, 108.
[34] Wischmeier, W.H. and Smith, D.D. (1978) A Guide to Conservation Planning. U.S.
Apartment of Agriculture, Agriculture Handbook No. 282.
[35] Wischmeier, W.H. and Smith, D.D. (1965) Predicting Rainfall-Erosion Losses from
Cropland East of the Rocky Mountains. U.S Apartment of Agriculture, Agriculture Handbook No. 282.
Submit or recommend next manuscript to SCIRP and we will provide best service for you:
Accepting pre-submission inquiries through Email, Facebook, LinkedIn, Twitter, etc. A wide selection of journals (inclusive of 9 subjects, more than 200 journals)
Providing 24-hour high-quality service User-friendly online submission system Fair and swift peer-review system
Efficient typesetting and proofreading procedure
Display of the result of downloads and visits, as well as the number of cited articles Maximum dissemination of your research work