www.elsevier.comrlocatermolcata
Phase-transfer catalyzed allylation of sodium phenoxide in a
solid–liquid system
Hung-Ming Yang
), Ch’un-Min Wu
Department of Chemical Engineering, National Chung Hsing UniÕersity, 250 Kuo-Kuang Road, Taichung 402, Taiwan
Received 3 March 1999; received in revised form 15 May 1999; accepted 9 August 1999
Abstract
The kinetics for the O-allylation of sodium phenoxide with allyl bromide was investigated in the presence of phase-transfer catalyst in a solid–liquid system. The reaction was carried out in a stirred batch reactor under very mild operating conditions. The role of phase-transfer catalytic intermediate in the solid–liquid system was explored. Effects of various operating variables were performed. When the degree of agitation exceeded 200 rpm, the mass transfer resistance at the solid–liquid interface can be ignored. A kinetic model was proposed for the solid–liquid etherification and the experimental data were well described by the pseudo-first-order equation. The apparent activation energy was also obtained
y1 Ž .
as 60.92 kJ mol for tetra-n-butylammonium bromide TBAB as the catalyst. Experimental results also show that C-alkylation of sodium phenoxide with allyl bromide would not occur under the appropriate phase-transfer conditions.
q2000 Elsevier Science B.V. All rights reserved.
Keywords: Phase-transfer catalysis; Solid–liquid system; Allylation; Sodium phenoxide; Kinetics
1. Introduction
The reaction rate between two mutually in-soluble reactants was usually very slow. When applying a protic solvent in a severe condition for such a system, the conversion can be en-hanced but generally accompanied with some unfavorable side-reactions. Such drawbacks can be overcome by using phase-transfer catalysis. The advantages of applying phase-transfer cata-lysts are to give rapid reaction rates and higher product selectivity under very mild reaction conditions. Numerous reactions have been
in-)
Corresponding author. Tel.: q886-4-2852576; fax: q 886-4-2852576; e-mail: [email protected].
vestigated to explore the mechanisms and kinet-ics of phase-transfer catalysis especially for
w x
two-liquid system 1–4 . Nowadays,
phase-transfer catalysis is widely applied in manufac-turing pharmaceuticals, agricultural chemicals, perfumes, flavors, dyes and specialty polymers, and is extended to the pollution and environ-mental control processes.
When the reacting nucleophile is in a solid form with another reactant in the organic phase, the reaction system is called the solid–liquid
Ž .
phase-transfer catalysis SL-PTC . Several reac-tions performed in the liquid–liquid system that might lead to severe unfavorable side-reactions can be carried out efficiently in a solid–liquid system. The catalysts used in SL-PTC include
1381-1169r00r$ - see front matterq2000 Elsevier Science B.V. All rights reserved.
Ž .
tertiary amines, quaternary ammonium salts, di-amines and crown ethers, etc. Two distinct mechanisms for SL-PTC, the heterogeneous sol-ubilization and the homogeneous solsol-ubilization, were proposed by considering the solubility of
w x
solid salts in the organic phase 5 . Trace amount of water also plays an important role in SL-PTC. A thin aqueous layer called the ‘omega phase’ would be formed around the solid reactant to enhance the solubilization of solid reactant and the formation of catalytic intermediate. The cat-alytic intermediate was found to act as the key-reacting component in the solid–liquid phase-transfer reaction of dipotassium phthalate
w x
with benzyl bromide 6 . However, the behav-iors of SL-PTC are still scarcely studied. A model reaction of allylation of sodium
phenox-w x
ide 7 was used to investigate the character-istics of SL-PTC. The product, allyl phenyl ether, is used in the production of insecticides, herbicides, delation agent of coronary artery, dropping agent of blood pressure, tranquilizer and thermoplastic resins, etc.
In most studies on O-alkylation of phenolic salts in the protic solution, the C-alkylation of phenolic salts was also produced
simultane-w x
ously. Kornblum et al. 7–9 concluded that the
Ž .
ratio of O-alkylation to OqC -alkylation for
the synthesis of allylation product was small and varied with different solvents. Akabori et al.
w10 applied crown ether as the phase-transferx
catalyst to investigate the allylation of sodium phenoxide. In that study, the ratio of O-alkyla-tion was improved, but along with a quite slow reaction rate. The allylation of phenol by using polyethylene glycol as the catalyst in a two-phase system was also reported to enhance the
selectivity of OrOqC, but the reaction rate
decreased with increasing polarity of organic
w x w x
solvent 11,12 . Wu and Lai 13,14 investigated the allylation of phenol in the two-phase system
of organic solventralkaline solution in the
pres-ence of quaternary salts. They concluded that the O-alkylation was favored in the phase-trans-fer catalyzed reaction and the C-alkylation more sensitive for higher temperature. In the present
study, the kinetics of sodium phenoxide with allyl bromide was investigated in the presence
Ž .
of tetra-n-butylammonium bromide TBAB in the solid–liquid system.
2. Experimental
2.1. Materials
Reagent sodium phenoxide with trihydrate
ŽC H ONaP3H O, PhONaP3H O from Merk.
6 5 2 2
is used as the solid reactant without further
Ž .
treatment. TBAB Bu NBr, QBr , allyl bromide4
ŽC H Br, RBr , allyl phenyl ether3 5 . ŽC H -6 5
OC H , PhOR, used as the standard in the3 5
.
analysis and other reagents are all reagent-grade chemicals from Fluka, Lancaster and Aldrich Chemical. Tetra-n-butylammonium phenoxide
ŽPhOBu N, PhOQ4 . was prepared from the
aqueous reaction of tetra-n-butylammonium hy-droxide with sodium phenoxide. The formed PhOQ was extracted by dichloromethane, and purified by separating the solvent, dried and then identified.
2.2. Catalytic measurement
Known quantities of phase-transfer catalyst and allyl bromide together with a definite
quan-Ž
tity of diphenylmethane used as the internal
.
standard in the analysis were added into the organic solvent dichlorobenzene and agitated in
a 250 cm3 three-neck batch reactor which was
immersed in a constant-temperature water bath. For a batch run, a known quantity of sodium phenoxide was put into the reactor to start the phase-transfer reaction. The agitation speed and the reaction temperature were controlled at the
desired values. During the reaction, 0.2 cm3 of
the organic sample was withdrawn at the chosen
time and diluted into 4 cm3 of acetonitrile. The
ratio of methanolracetonitrilerwater to be
37r37r26. The flow rate was 1.0 cm3 miny1.
Ž .
The column was the C-18 5mm type.
3. The kinetic model
3.1. Independent reaction of PhONa with QBr
The formation of catalytic intermediate PhOQ plays an important role in the solid–liquid reac-tion system. The independent ion-exchange re-action is
PhONa s
Ž .
qQBr orgŽ
.
™PhOQ orgŽ
.
qNaBr s .
Ž .
Ž .
1This reaction would involve the following steps.
Ž .1 Dissolution of PhONa. The salt PhONa
with trihydrate was used as the solid reactant. Since a trace of water was present in the solid reactant, the omega phase around the solid par-ticle might be formed to enhance the solubiliza-tion of PhONa in organic solvent. Hence, the solid part of PhONa is in equilibrium with its soluble part. The expression is:
PhONa s
Ž .
°PhONa org .Ž
.
Ž .
2Ž .2 Reaction of PhONa with QBr.
Phase-transfer catalyst QBr would react with the solu-ble parts of PhONa to form PhOQ in the solid– liquid interface. The film reaction is usually reversible and is written as
K1
PhONa org
Ž
.
qQBr orgŽ
.
° PhOQ orgŽ
.
qNaBr org
Ž
.
Ž .
3with
CUPhOQCUNaBr
K s .
Ž .
41 U U
CPhONaCQBr
Ž . U
In Eq. 4 , the superscript represents the
component concentration in the layer adjacent to the surface of the solid reactant.
Ž .3 Mass transfer of PhOQ to the bulk phase.
The formed PhOQ then transfers from the solid–liquid interface to the organic phase in
which the solubility of PhOQ is limited. The expression is given as
dCPhOQ U
V sk A C
Ž
yC.
.Ž .
5org m s PhOQ PhOQ
d t
Ž .
In Eq. 5 , A denotes the surface area of solids
particle and is gradually reduced during the
progress of reaction. N denotes the number ofi
moles of component i. Thus, at time t, A cans
be expressed as
2r3
N yN
PhONa ,0 PhOQ
A sA
s s0
ž
/
NPhONa ,0
2r3
sA
ž
1yqC/
Ž .
6s0 PhOQ
NQBr ,0 CPhOQ
with qs and C s .
Ž .
7PhOQ
NPhONa ,0 CQBr ,0
The mass transfer coefficient km is also
depen-dent on the particle size. The mass transfer coefficient is inversely proportional to n power of the particle size, in which n is in the range of
Ž
0.25 to 1.0 from high degrees of agitation high
.
Reynolds numbers to low degrees of agitation
Žlow Reynolds numbers . Hence, k. m is
ex-pressed in a function of salt conversion as,
ynr3
N yN
PhONa ,0 PhOQ
k sk
m m0
ž
/
NPhONa ,0
ynr3
sk
ž
1yqC/
.Ž .
8m0 PhOQ
Ž . Ž . Ž .
Combining Eqs. 5 , 6 and 8 , we have
dCPhOQ Ž2yn.r3
sa
ž
1ybC/ ž
1yqC/
PhOQ PhOQ
d t
9
Ž .
CQBr ,0CUNaBr km0As0
where bs and as .
U U
K C1 PhONaCQBr bVorg
10
Ž
.
Ž .
Eq. 9 , with the initial condition, at ts0,
C s0, can be numerically solved by
intro-PhOQ
3.2. The oÕerall reaction of PhONa with RBr
By adding the organic substrate into the or-ganic solvent, the overall reaction in solid–liquid phases is expressed as
QBr
PhONa s
Ž .
qRBr orgŽ
.
™ PhOR orgŽ
.
qNaBr s .
Ž .
Ž
11.
The reactants, PhONa and QBr, conducted to form PhOQ, that then reacts with RBr to pro-duce the desired product PhOR. This intrinsic reaction is
kin
PhOQ org
Ž
.
qRBr orgŽ
.
™ PhOR orgŽ
.
qQBr org .
Ž
.
Ž
12.
The intrinsic reaction is a bimolecular elemen-tary reaction of second order, and the rate of change of PhOR is given as
dCPhOR
sk C C .
Ž
13.
in PhOQ RBr
d t
By taking mass balance for R group, the above equation is rewritten in terms of the product yield as follows.
dCPhOR
sk C C
ž
1yC/
Ž
14.
in QBr ,0 PhOQ PhOR
d t
CPhOR
where C s syield of PhORsY .
PhOR
CRBr ,0
The rate of change of PhOQ in the overall reaction is thus deduced as
dCPhOQ Ž2yn.r3
sa
ž
1ybC/ ž
1yqC/
PhOQ PhOQ
d t
yk C C
ž
1yC/
.Ž
15.
in RBr ,0 PhOQ PhOR
If the quantities of PhOQ were kept at near constant values after the induction period, the pseudo-first-order behavior would be observed.
Ž .
Therefore, Eq. 13 is simplified to the form dY
sk
Ž
1yY ,.
Ž
16.
appd t
where kapp is the apparent reaction rate constant
with k sk C C .
app in QBr,0 PhOQ
Ž .
Eq. 16 can be easily solved to give the
pseudo-first-order rate constant kapp by plotting
Ž .
yln 1yY vs. t from the experimental data.
4. Results and Discussion
4.1. BehaÕiors of catalytic intermediate
[image:4.595.290.499.428.600.2]Regarding the formation of PhOQ in SL-PTC, the independent experiments for solid PhONa reacting with QBr at different temperatures were performed. The experimental results are shown in Fig. 1. The near saturated concentrations of PhOQ were reached after about 20 min of oper-ation. The difference of PhOQ at various reac-tion temperatures was not significant. This shows that the catalytic intermediate PhOQ can be formed from tetra-n-butylammonium salt re-acted with PhONa even in a solid–liquid sys-tem. Transferred from the outside layer of the solid particle to the bulk organic phase, the produced PhOQ will then conduct the intrinsic reaction. The degree of agitation influences the mass transfer rate of PhOQ. By applying pseudo-first-order kinetics for different agitation
Fig. 1. Concentration of PhOQ for PhONa reacted with QBr. Operating conditions: dichlorobenzene, 50 cm3; PhONa, 0.002
mol; TBAB, 0.002 mol; agitation speed, 350 rpm; temperature
Fig. 2. Variation of PhOQ for different amounts of TBAB used. Operating conditions: temperature, 358C; dichlorobenzene, 50 cm3;
RBr, 0.005 mol; PhONa, 0.01 mol; agitation speed, 350 rpm; f
Ž . Ž . Ž . Ž . Ž .
value: I 0.075 ` 0.1 ^ 0.15 e 0.2 0.25.
speeds, the apparent rate constants for 100, 200, 350, 500 and 800 rpm were estimated as 0.015,
0.035, 0.038, 0.031 and 0.034 miny1,
respec-tively. The agitation effect is insignificant as the speed exceeding 200 rpm. Hence, the ion-ex-change reaction and the mass transfer resistance between solid and liquid phases are not the limiting steps in the overall reaction.
To evaluate the effect of catalyst amounts,
Ž
Different molar ratios of TBAB to PhONa
de-.
noted as f were investigated, and the product
yield was less than 2% in 2 h of duration for
fs0 at 358C. Increasing the catalyst usage up
to fs0.2, the yield of PhOR increased to 100%
for 2 h of operation. In addition, the
concentra-tion of PhOQ did not increase for f)0.2 due to
its limiting solubility in dichlorobenzene. The overall reaction rate was thus increased not too much. Such phenomena can be explained by Fig. 2. It is seen that the concentration of PhOQ increased to a near constant value as increasing molar quantity of TBAB after induction period. However, the concentration of PhOQ for f equal to 0.25 was only slightly higher than that for
fs0.2. In this solid–liquid reaction system, too
much catalyst is not appropriate for enhancing reaction rate. Pseudo-first-order kinetics can be well applied to describe the overall reaction. Moreover, the effect of induction period is more significant for lower quantity of catalyst used. The apparent rate constants as well as the prod-uct yields are shown in Table 1.
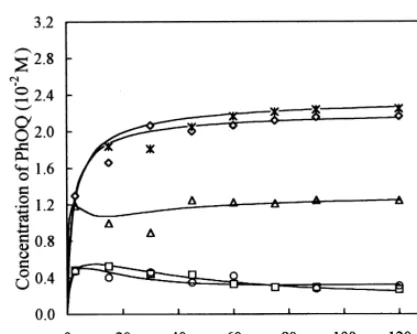
In principle, the reaction rate constant is not affected by the relative usage of reactants for an elementary reaction. In the present phase-trans-fer catalyzed system, several reaction and mass transfer steps were involved. The concentration of PhOQ in organic solvent was also dependent on the molar ratio of reactants, thus influencing the observed reaction rate. The yields as well as the profiles of PhOQ are shown in Figs. 3 and 4, respectively. By keeping constant usage of RBr, the yield decreased with increasing molar
Ž .
[image:5.595.47.502.507.631.2]ratio of PhONa to RBr denoted as M . These
Table 1
Effect of TBAB amounts and temperature on the apparent reaction rate constanta
2 y1
Ž . Ž . Ž . Ž .
Entry no. Temperature 8C TBAB mol 10 kapp min Yield of PhOR %
at 0.5 h at 2 h
1 35 0.00075 0.241 24.1 35.6
2 35 0.001 0.336 35.0 52.2
3 35 0.0015 1.402 47.2 84.9
4 35 0.0025 4.324 77.4 100
5 45 0.002 4.656 85.1 100
6 40 0.002 4.052 74.0 100
7 35 0.002 3.793 72.3 100
8 30 0.002 2.266 61.1 95.5
9 25 0.002 0.914 41.2 77.8
a
Fig. 3. Effect of different molar ratios of PhONa to RBr on the yield. Operating conditions: temperature, 358C; dichlorobenzene, 50 cm3; RBr, 0.005 mol; TBAB, 0.002 mol; agitation speed, 350
Ž . Ž . Ž .
rpm; M value: I 2 ` 3 ^ 4.
results are somewhat strange. However, such phenomena can be explained by the variation of concentration of PhOQ for various M. From the results in Fig. 4, the near equilibrium concentra-tion of PhOQ decreased with increasing M. The PhOQ concentration in the organic phase in-creased from zero to an approximate constant
value for Ms2. While for M equal to 3 or 4,
[image:6.595.290.500.431.598.2] [image:6.595.52.262.444.609.2]the PhOQ concentration first increased from zero to a maximum value, then decreased to a near constant. Such declines of PhOQ were
Fig. 4. Variation of PhOQ for different molar ratios of PhONa to
Ž . Ž .
RBr. Operating conditions as in Fig. 3; M value: I 2 ` 3
Ž^.4.
expected to result from the influence of extra solid PhONa. From the experimental observa-tion, the PhONa fine particles would aggregate
to form larger solid clusters for M)3 during
the agitated reaction. This leads to the effective surface area of PhONa particles reduced. The probability of contact of PhONa with TBAB as well as the mass transfer rate of PhOQ was then diminished in dichlorobenzene. Hence, the for-mation of PhOQ was inhibited due to the solid salt concentrated in the organic solvent. The lower PhOQ concentration in the organic phase caused to a lower intrinsic reaction rate for greater M. The rate-determining step was iden-tified as the intrinsic reaction of PhOQ with RBr.
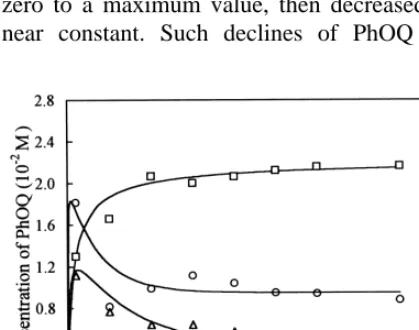
To further investigate the behaviors of forma-tion of PhOQ in this solid–liquid system, the independent reaction of solid PhONa and TBAB in dichlorobenzene without the addition of RBr
Ž
at different molar ratios PhONa to TBAB
de-.
noted as r were performed. The results are
shown in Fig. 5. From the profiles of PhOQ vs. time, the PhOQ concentration decreased with increasing r-values by keeping a constant TBAB
usage. At the condition of r)5, the PhOQ
concentration in dichlorobenzene increased to a
Fig. 5. Concentration of PhOQ for PhONa reacted with QBr. Operating conditions: dichlorobenzene, 50 cm3; PhONa, 0.002
Ž .
mol; TBAB, 0.002 mol; agitation speed, 350 rpm; r-value: ^ 5
Fig. 6. Plot of yield of PhOR vs. conversion of RBr.
maximum then decreased to a near constant value. From the experimental observation, the
Ž
initial fine particle of PhONa with particle size
.
in the range of 80–120 mesh aggregated to
Ž
finally form three larger clusters with particle
.
size about 10 mm after 1 h of operation for the case of r-value equal to 10. Some of the already formed PhOQ was also adsorbed on the solid clusters. A greater reduction of PhOQ concen-tration in the dichlorobenzene solvent was thus observed, compared to the case of r-value equal to 5. The degree of aggregation of solid parti-cles is believed to depend upon the relative usage of reactants and catalyst. This result strongly demonstrates that the PhONa aggregate retards the formation and transfer of PhOQ into the organic phase for greater molar ratio of PhONa to TBAB in the solid–liquid system.
4.2. Efficiency of phase-transfer catalyst
Experiments at different temperatures were performed to investigate the activation energy for TBAB in this solid–liquid phase-transfer reaction. The results are shown in Table 1. The yield increases as the temperature increases and follows the pseudo-first-order kinetics. The ap-parent activation energy for TBAB was
ob-tained as 60.92 kJ moly1 by applying the
Ar-Ž .
rhenius’ equation, k sA exp yErRT , and
app
the rate expression was correlated as k s
app 8
Ž .
6.058=10 expy60923rRT . The catalytic
efficiency of TBAB was quite high with very mild operating conditions in the present solid– liquid system. Moreover, the C-alkylation of sodium phenoxide with allyl bromide was not observed in the experimental conditions of
tem-perature below 458C as described above. Fig. 6
shows the plot of the yield of PhOR vs. the conversion of RBr for the above reaction condi-tions. The quite consistency of conversion and yield demonstrates that no other side reactions, e.g., the C-allylation, were conducted for the above appropriate experimental conditions.
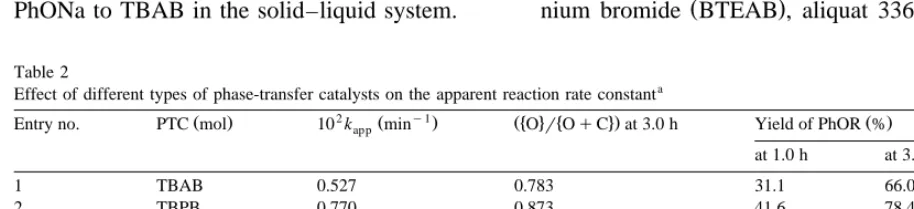
To identify the catalytic efficiency of cata-lysts, various phase-transfer catalysts with dif-ferent cations and anions were performed. The tested catalysts were TBAB,
tetra-n-butylammo-Ž .
nium iodide TBAI , tetra-n-butylphosphonium
Ž .
bromide TBPB , tetra-n-butylammonium
hy-Ž .
drogen sulfate TBAHS ,
benzyltriethylammo-Ž .
nium bromide BTEAB , aliquat 336 and PEG
Table 2
Effect of different types of phase-transfer catalysts on the apparent reaction rate constanta
2 y1
Ž . Ž . Ž 4 4. Ž .
Entry no. PTC mol 10 kapp min OrOqC at 3.0 h Yield of PhOR %
at 1.0 h at 3.0 h
1 TBAB 0.527 0.783 31.1 66.0
2 TBPB 0.770 0.873 41.6 78.4
3 TBAI 0.698 0.891 48.3 74.9
4 TBAHS 0.515 0.824 35.0 62.2
5 BTEAB 0.064 0.378 5.1 11.7
6 Aliquat 336 0.481 0.775 38.4 63.9
7 PEG 1000 0.903 0.934 61.7 83.7
a
Sodium phenoxide: 0.01 mol; allyl bromide: 0.01 mol; dichlorobenzene: 50 cm3; phase-transfer catalyst: 0.001 mol; temperature: 508C;
[image:7.595.46.503.516.620.2]1000. Unfortunately, at the higher temperature
greater than 508C, different degrees of
C-allyla-tion for various catalysts were observed. The pseudo-first-order rate constants, the degree of O-alkylation and the product yields are shown in Table 2. This might be due to the higher affinity for RBr with PhONa in another reaction
route at temperature greater than 508C. The
better operating temperature would be expected
below 458C for this system. However, at a
temperature of 508C, the best performance of
catalyst tested above was PEG 1000 with the least side-reaction and the highest reaction rate.
The reactivity sequence was PEG 1000)TBPB
)TBAI)TBAB)TBAHS)aliquat 336)
BTEAB. The different reactivity for catalysts with the same tetra-n-butylammonium group ex-hibits that the lipophilic property of anion group in catalyst governs the formation of the catalytic intermediate. In addition, the reaction mecha-nism for using PEG 1000 in solid–liquid phase-transfer reaction would be expected to be different from that for quaternary onium cata-lyst. A future research work would be worthy to investigate the phenomena of PEG 1000 as the phase-transfer catalyst in the solid–liquid reac-tion system.
5. Conclusion
In the present work, the kinetics for the O-allylation of sodium phenoxide with allyl bromide to produce allyl phenyl ether in the solid–liquid phase-transfer conditions was in-vestigated. The reactions were carried out in an isothermal stirred batch reactor. The role of phase-transfer catalytic intermediate in the solid–liquid system was explored. Effects of various operating variables were performed. A kinetic model was proposed to describe the overall reaction. The experimental data were well fitted by the pseudo-first-order equation. The apparent activation energy for TBAB was also obtained. Using the present reaction condi-tions, the side-reaction C-alkylation was not
observed for the appropriate conditions. Various types of phase-transfer catalysts were also em-ployed to compare their catalytic efficiency. This work provides an effective method for conducting allylation of sodium phenoxide and realizes the behavior of the catalytic intermedi-ate.
6. Nomenclature
A frequency factor in the Arrhenius
equation
A surface area of solid particles, dm2
s
Ci concentration of the i-component
CPhOQ dimensionless concentration of
Ž .
PhOQ defined in Eq. 7
CPhOR dimensionless concentration of
Ž .
PhOR defined in Eq. 14
E apparent activation energy, J
moly1
Ž .
K1 equilibrium constant for Eq. 4
kapp apparent reaction rate constant,
miny1
kin intrinsic reaction rate constant,
mol dmy1 miny1
km mass transfer coefficient for
PhOQ, dm miny1
Ni number of moles for component i
PhONa sodium phenoxide
PhOQ tetra-n-butylammonium phenoxide
PhOR allyl phenyl ether
Ž .
q parameter defined in Eq. 7
QBr tetra-n-butylammonium bromide
R gas constant
RBr allyl bromide
t time, min
X conversion of allyl bromide
Y yield of allyl phenyl ether
Greek Symbol
Ž .
a parameter defined in Eq. 10
Ž .
b parameter defined in Eq. 10
Subscript
Acknowledgements
The authors acknowledge the financial sup-port of the National Science Council, Taiwan,
Ž
Republic of China Grant No. NSC
88-2214-E-.
005-006 .
References
w x1 C.M. Starks, C.L. Liotta, M. Halpern, Phase Transfer Cataly-sis: Fundamentals, Applications, and Industrial Perspectives, Chapman & Hall, New York, 1994.
w x2 E.V. Dehmlow, S.S. Dehmlow, Phase Transfer Catalysis, 2nd edn., Verlag-Chemie, Weinheim, Germany, 1983. w x3 W.P. Weber, G.W. Gokel, Phase Transfer Catalysis in
Or-ganic Synthesis, Springer-Verlag, New York, 1977.
w x4 M.L. Wang, Kinetic Modeling of Catalytic Phase Transfer
Ž .
Systems, in: Y. Sasson, R. Neumann Eds. , Handbook of Phase Transfer Catalysis, Blackie Academic and Profes-sional, London, 1997.
w x5 J.B. Melville, J.D. Goddard, Ind. Eng. Chem. Res. 27 1988Ž .
551.
w x6 H.M. Yang, H.E. Wu, Ind. Eng. Chem. Res. 37 1998 4536.Ž .
w x7 N. Kornblum, P.J. Berrigan, W.J. Ie Noble, J. Am. Chem.
Ž .
Soc. 85 1963 1141.
w x8 N. Kornblum, R. Seltzer, P. Haberfield, J. Am. Chem. Soc.
Ž .
85 1963 1148.
w x9 N. Kornblum, P.J. Berrigan, W.J. Ie Noble, J. Am. Chem.
Ž .
Soc. 82 1963 1257.
w10 S. Akabori, S. Miyamoto, H. Tanabe, J. Polym. Sci., Polym.x
Ž .
Chem. Ed. 17 1979 3933.
w11 M.L. Wang, K.R. Chang, J. Mol. Catal. 67 1990 147.x Ž .
w12 M.L. Wang, K.R. Chang, Ind. Eng. Chem. Res. 30 1991x Ž .
2378.
w13 H.S. Wu, J.J. Lai, Ind. Eng. Chem. Res. 34 1995 1536.x Ž .