A COMPUTER SYSTEM FOR A CADASTRAL MAPPING APPLICATION
A thesis
submitt~d in partial fulfilment of the requirements for the Degree
of
Master of Science in Computer Science in the
University of Canterbury by
M. S. COLLEY
CHAPTER
1.
2.
3.
ABSTRACT
INTRODUCTION • 1.1 Purpose
-·
.
.
.
. .
.
.
.
.
.
. .
1.2 General Structure
.
.
. .
. .
.
.
. .
.
. . . .
A MAP PROCESSING PROBLEM •.
.
. .
.
.
2.1
2.2
2.3
Terminology • • • • • •
. .
.
. .
.
.
.
.
2 .1.12 .1. 2
2 .1. 3 2.1.4
Automated mapping and Computer mapping • Cadastral maps •
Thematic maps
Appellation systems
. .
Elements of a mapping system •
.
. .
2.2.12.2.2
Procedural steps • Hardware types • •
.
. .
. .
New Zealand Department of Lands and Survey • • • 2.3.1
2.3.2 2.3.3
Background • • • • • • • • • • • Computer mapping requirements Hardware configuration • •
.
.
MAP PROCESSING SYSTEMS •
. . .
.
.
3.1 3.2 3. 3 3. 4 3.5 3.6 3. 7Introduction • • •
.
.
British Ordnance Survey
.
.
.
The Canada Geographic Information System • . • • CLOTSGIMMS
.
. .
.
.
. .
4.
5.
DATA BASE DESIGN • 4.1
4.2
4.3
Requirements for a Data Base • Cartographic Data Structures • 4.2.1 Cartographic Spaghetti 4.2.2 Location Lists
4.2.3 Point Dictionaries 4.2.4 Polygon system 4.2.5 DIME
4.2.6 GEOGRAF • Proposed Structure • 4.3 .• 1 Data Base items •
4.3.2 Specfic Data Base requirements 4.3.3 Detailed design •
AN INTERACTIVE SYSTEM 5.1
5.2
5.3
Interactive Digitising • 5.1.1 Advantages
5.1.2 Menu Driven Digitising 5.1.3 Map Orientation •
5.1.4 Windowing . 5. 1. 5 MULTIMAP
5.1.6 Digitising sequence •
5.1.7 General Digitising Process Editing and Updating •
5.2.1 Editing • 5.2.2 Updating
5.2.3 Interactive Language Plotting Subsystem •
5.3.1 Introduction 5.3.2 Arc Generation
5.3.3 Chain Encoding/Decoding . 5.3.4 Character Set •
6.
7.
INFORMATION PROCESSING SYSTEM 6.1
6.2 6.3
Small Scale Map Production Additional Data Sets
Data Manipulation Subsystem 6.3.1
6.3.2 6.3.3
Feature Display-. Feature Aggregation Query Language
CONCLUSION ACKNOWLEDGEMENTS REFERENCES
APPENDICES
91 91
95
97
97
97
FIGURE 2-1 4-la 4-lb 4-2 4-3 4-4 4-5 4-6 5-l 5-2 5-3 5-4 5-5
LIST OF FIGURES
Configuration of Computer Hardware • Example of a Location List •
Example of a Point Dictionary The GEOGRAF Data Base Structure Structure of the CHAIN DICTIONARY Format of a POINT file word
Overview of the MAPPAK Data Base •
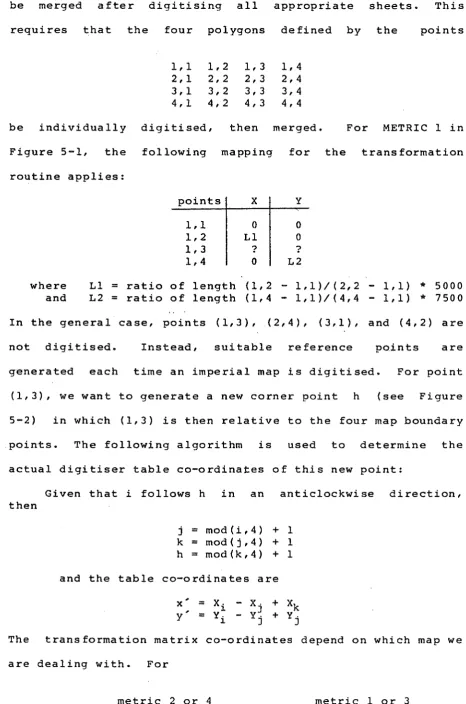
Flow chart for interpreting XY DICTIONARY codes Digitiser setup for Multiple Base Maps •
Example of generating the 4th co-ordinate for the affine transformation matrix •
Example of a digitising sequence •
Interactive VDU display of an arc generation • Format of Interactive Digitising Screen
displaying possible errors •
5-6 XY DICTIONARY codes before and after deletion
5-7 5-8a 5-8b 5-9a 5-9b 5-10 5-11 6-1 6-2a 6-2b 6-2c
of an arc
Example of non coincidence of common points Example of reproducing chain encoded data Example of effects of smoothing algorithm
applied to chain encoded data Interactive VDU character set Flatbed Plotter character set
Example used for calculating Visual Centres Transformation matrices
Small scale map production •
Drawing logic for an arc that starts and ends on the same sheet
Drawing logic for an arc that starts and ends on a different sheet •
Drawing logic for connecting chain features across sheets
ABSTRACT
In 1973, the New Zealand Government instituted a metric
measurement system and the New Zealand Department of Lands and
Survey (NZLS) implemented a new mapping grid and projection
system that permits the accurate representation of the whole
country on a uniform basis. These two related decisions
required the mapping division of the NZLS to assume
responsibility for the conversion of both topographical and
cadastral maps in the former imperial mapping grid system to
the new metric mapping grid system.
This thesis deals with the design of an automated
mapping system and identifies the techniques necessary to
automate the conversion of cadastral maps from the imperial
mapping system to the new metric system. The research
undertaken encompasses the following three major areas:
(a) the design of an efficient system to automate the
conversion from one mapping series to another,
(b) the identification and testing of techniques
necessary to generate computer produced maps to
cartographic standards,
(c) to design a data structure for graphical data and
its corresponding descriptive data in a format
suitable for use by a land information processing
.system.
Although this research deals with a specific problem,
the problems discussed in this thesis are of relevance to any
2
CHAPTER ONE
INTRODUCTION
1.1 PURPOSE
This thesis is concerned primarily with the application
of computers in cadastral mapping. Cadastral maps are used to
portray survey plan data approved by the New Zealand
Department of Lands and Survey. Plan data comprises both a
graphical description of the land parcels associated with each
plan, and the corresponding legal attributes such as plan and
section numbers. The research was undertaken in conjunction
with the requirements of the New Zealand Department of Lands
and Survey. A software system, referred to as MAPPAK (MAPing
PAcKage), was developed to demonstrate the ideas presented in
this thesis. MAPPAK is now at the stage where i t is being
used efficiently for cadastral map compilation.
This thesis:
(a) identifies the procedures necessary in the
auto-mation of the mapping process,
(b) explains the purpose of those procedures,
(c) describes the techniques used in the implementation
of a computer-assisted cadastral mapping system.
The work of this thesis centres around the conversion from an
existing manual cadastral mapping system to that of a
computer-assisted system in which i t is possible to produce
both cadastral maps and thematic maps with a computer.
Cadastral maps must be of a cartographic standard whereas
thematic maps have less stringent accuracy requirements but
greater information content.
(a) data capture subsystem,
(b) editing subsystem,
(c) update subsystem,
(d) plotting subsystem.
While the system has a cadastral background, much of what is
discussed here applies universally to any mapping situation.
Common problems are identified and solutions to these problems
are proposed.
The design of MAPPAK was influenced by two major
factors:
(a) the implementation of the experimental system was
restricted to the hardware system described in
section 2.3.3.
(b) the design was to result in a system that could be
used efficiently on a mini computer by
inexper-ienced persons with minimal training.
Therefore, the work here has been influenced by factors that
relate to the efficient use of a set of limited resources.
This does not, however, preclude the use of the results in
larger systems.
1.2 GENERAL STRUCTURE
Before designing a system, an understanding of the
fundamental components of the system is required to define the
system's "boundaries". Chapter Two introduces a mapping
system by establishing the difference between Computer Mapping
and Automated Mapping. The components of the system are then
identified as a set of sequential processes and their
functions, followed by an introduction to the particular
pieces of hardware required for a computer mapping
4
of Lands and Survey (NZ LS) , for whom this research was
undertaken, serves to define the scope of the system.
Chapter Three then reviews some existing mapping
systems, few of which are cadastrally oriented, and critically
analyses the techniques used in terms of cadastral mapping
requirements and the requirements of the NZLS. The discussion
here applies equally to any mapping application and identifies
possible approaches to the design of any computer mapping
system.
A common feature in any mapping application is the data
base. The data base contains files that comprise both the
graphical information of a map and its corresponding
descriptive data sets. For cadastral maps, the descriptive
data files serve merely as a means of automatically including
the text on a computer produced map. In thematic mapping,
these files are organised to permit detailed analysis of
geographic data and subsequent display of selected
information. However, the author contends that the two file
be mutually exclusive, provided that the
types need not
correct data structures are used.
general types of structure available,
Chapter Four looks at the
and then at specific
cartographic structures used in other systems. Finally, a
detailed description of the author~s structure is presented.
Chapter Five then describes the processes associated
with data manipulation: how data is entered into the data
inconsistencies, updated to reflect
base, edited for any
changes in the data base, and finally output to graphical
display devices. Graphical data is obtained by an interactive
digitising procedure that allows the user to monitor
constantly his digitising progress on a display terminal.
the digitising process. Some intermediate editing may be
necessary before plotting the map. The types of error which
may not be detected during the interactive digitising phase
are presented, with a description of the interactive editing
procedures used to amend the incorrect graphical data files.
No detailed discussion on editing descriptive data files is
necessary as this function is a clerical procedure requiring
little technical background. Much of the discussion on
editing relates equally to the update requirements of the
system. For example, the edit procedures necessary to include
a missing parcel are also used by the update process when
inserting new parcels.
Finally, Chapter Five discusses the production of
cadastral maps that are both aesthetically pleasing, and of a
standard comparable with a hand drafted cartographic document.
It describes the techniques and algorithms used to produce
smooth arcs and cartographically acceptable chain
reproduction. Techniques for presenting non positional data
are discussed. Both its physical location and appearance is
a major factor contributing to the acceptability of a
computer-produced cartographic document.
Chapter Six then examines the means by which the
cartographic data can be added to and manipulated, to produce
special purpose maps and display geographical relationships.
It discusses techniques to produce small scale maps from the
data base;s large scale base maps, as well as techniques for
manipulating cartographic and geographical data to produce
thematic maps.
The final chapter summarises the conclusions derived
from the experimental system MAPPAK, which is now currently
6
CHAPTER TWO
A MAP PROCESSING PROBLEM
Computer-assisted mapping systems are needed for three
basic reasons:
(a) to satisfy the ever increasing demands for
land-related information,
(b) to provide an economic method for rapid processing
of the large amounts of input to manual land
information systems,
(c) to assist in the conversion to, or adoption of, a
cadastral mapping base.
In every country, the need is now recognised for a system that
is capable of producing land-related information to satisfy
requests from both individuals and organisations. Countries
with a formal cadastral system have already begun to undertake
some computer-assisted mapping applications. Those lacking a
cadastral base for mapping purposes have first to consider the
transition from their present ad-hoc system to a cadastral
base.
base,
Irrespective of the presence, or lack, of a cadastral
a land system capable of fulfilling the above
requirements implies a need for a multipurpose cadastre. Such
a system should be capable of producing up-to-date maps, and
should correlate data on a parcel basis with current parcel
information such as legal status,
usage.
2.1 TERMINOLOGY
ownership, valuation, and
Definitions are now given for some of the terminology
2.1.1 Automate£ ~E£ing and £omp~ mapping
Taylor (1973) found i t necessary to distinguish between
automated mapping and computer mapping. He defined automated
mapping as the automation of the map making process - the
implication being that maps produced from automated mapping
were not inherently different in style or presentation to
existing maps. His definition of computer mapping referred to
the production of maps using the analytical power of the
computer to display spatially oriented relationships. Often,
the outputs of computer mapping were thematic maps whose
presentation neither reflected nor was required to reflect the
production standards of automated maps.
1973,
because
While this distinction may have been applicable in
the author believes that i t is no longer necessary
(a) the application of completely automated scanner
digitisers (Section 2.2) remove the need for
manually digitising source documents, and
(b) a cartographic data base can form the basis of a
system.
The cartographic data base can provide the elements for
producing maps of a cartographic standard as well as for
deriving thematic maps. In Chapter Six, the author describes
in more detail how a cartographic data base can be extended
for the purposes of thematic mapping.
Therefore, by "automated mapping", we refer here to a
process of map production which is completely automated. We
shall use "computer mapping" to refer to a system requiring
manual intervention but capable of producing both cartographic
2.1.2 Cadastral ~~
In its simplest form,
8
a cadastral map presents a
positive identification of all land parcels and their legal
status. It is compiled from survey plans that comply with
strict accuracy standards. Increasing demands for better land
use and greater planning to cater for expanding population
requirements, have led to the use of cadastral maps for such
purposes as the p~anning and administration of housing,
commercial and industrial development, and the protection of
the enviroment. Consequently~ the combining of fiscal
cadastre and juridical cadastre could create a multipurpose
cadastre capable of producing maps of cartographic quality
ai
well as containing the elements essential for a planning
system. The success of such a system is dependent on the
accuracy of the cadastral base map, its translation to digital
format, and its reproduction by a computer.
2.1.3 Thematic~~
A thematic map portrays primarily spatial data in the
form of relationships between different logical entities. For
example, logical entities may define soil, vegetation or
rainfall distributions, population densities, or any other
similar type of entity. Strict cartographic standards do not
apply for thematic maps, due mainly to the difficulties in
accurately defining the boundaries of thematic entities.
2.1.4 ~E£ellation ~~te~
An appellation system attaches to every parcel a legal
description and a means by which the parcel can be located on
the appropriate map. Within any land information system, i t
is essential that all parcels have a unique identifier (Moyer
(a) identification of the approximate
location,
geographical
(b) identification of the parcel in such a way that i t
cannot be mistaken for another,
(c) display nf the dimensions of the parcel.
In a computer system, a unique appellation or geocoding system
is needed as a source of secondary information by which
individual parcels can be referenced. In New Zealand,
although several appellation systems exist, all parcels have
a unique appellation. However, a common appellation
identifier is essential in a computer system to permit the
many aspects of land information to be sucessfully related to
the parcel.
2.2 ELEMENTS OF A MAPPING SYSTEM
All computer map processing systems have several
functions in common. Their fundamental elements can be
summarised as: data acquisition, storage, manipulation and
display. Depending on what type of hardware configuration is
used, several methods1
exist for performing each function. The
decision on how best to accomplish the basic processes depends
primarily on the nature of the system and its general
requirements, and not on the types of hardware available.
2.2.1 f!.2cedural ste~
The functions of data acquistion, manipulation and
plotting represent the flow of a document through a mapping
application. In the data ~uisition phase, there are at
least three methods available, all of which differ in both
their resource requirements and efficiency.
10 widely used to produce co-ordinate data. After digitising, a lot of post-processing is required to correct the many errors that are possible, for example, missing segments, faulty references, and non-coincidence of end points. As a result,
process is costly and inefficient.
this
is at present the most economical way, provided that the quality of the output on the interactive display device is reasonably close to the standard required for the final product. Online systems ensure that lengthy post-processing sessions to remove errors are avoided.
produces large amounts of geometric data requiring complicated processing of the raster data to generate the data base files.
expensive.
This process is both difficult and
The ~tora~ !~tion involves adding input data to the data base. This function should be transparent to the user as i t is concerned only with the internal processing of the external data. In an interactive system, this function is performed in real-time. On satisfactory completion of data acquistion, the data base should contain the new digital data without the need for post-processing to organise the data base.
The ~!£ulati2£ phase processes stored data which involves:
(a) editing the data base to remove any inconsistencies between the source data and its internal representation,
changes in the external data i t portrays,
(c) processing the internal data structures to display
the relationships between different geographical
attributes.
Finally, the £lotting phase processes the data files to
produce documents requested by the users. This may result in
either a special purpose map displaying some phenomena derived
from a request as in (c) above, or merely a plot of the
computer's copy of the source document.
2. 2. 2 Hardw~ !YE~
We now look at the two functions of input and output,
and the types of hardware available to accomplish these
functions.
A) Input. There are several methods for transcribing
existing source documents to digital format:
(a) Digitisers are now used for the bulk of
cartographic input because of their low cost, ready
availability, and ease of use. A digitiser
establishes geometric locations in terms of x and
y co-ordinates relative to the digitiser table
axes. The digitised data is processed into a form
suitable for inclusion in the cartographic data
base.
(b) Stereographic flott~ have now been modi fi.ed to
produce digital output, mainly to paper tape for
input to a computer system.
(c) Raste£ Sc~~~ (Boyle 1978) use a wholly automated
procedure for reading map information into a raster
matrix and then converting i t to vector format by
software. Unfortunately, maps are composed of many
12
consequence, the software needed to differentiate
between features is very complex. To overcome this
obstacle, maps are preprocessed to separate
features, and each feature is independently scanned
and later merged with the other features.
(d) Automatic Line Followers (Turke 1978) use an
optical array camera mounted on a flatbed plotter
and interfaced to a minicomputer. The camera is
positioned manually over the areas to be digitised
and i t then automatically follows the surrounding
segments. This method suffers from several
technical difficulties. For example, whenever an
intersection point for two possible paths is
detected, the system requires that the operator
decide upon the correct path to take. In the case
of processing annotated maps, the features must be
separated from the text prior to processing.
B) Output devices are of four types:
(a) Line Print~~ are often used for map display, but
are limited in their display capabilities. Maps
are restricted to having a character print position
represent a grid cell, symbols are limited by the
character set of the printer and to a fixed size.
Area definitions are possible only through choices
of characters and overprinting to obtain the
correct densities. Approximation of curved lines
is possible only through a connected chain of
printer cells. Generally, poor reproduction of
line features occurs. Printers are therefore not
suitable for cartographic maps but may be used to
(b) Plott~ have the ability to draw continuous lines and curves, but are not really convenient for shading regions to display toning patterns. Although i t is possible to differentiate areas by shading with different patterns, complicated procedures are required to calculate the boundary points of the areas to be shaded. Further differentiation of features is possible through the use of colour. Through appropriate software, different pens can be selected to provide either different colours or changes in lineweight.
(c) Dis£!~ Devi~ can produce maps faster than either printers or plotters. They generally have relatively small screens. Interaction with the screen is via a cross hair cursor, for example, which causes the xy co-ordinate pair of the identified screen ~ocation to be generated. There are two types of display devices - storage tubes and refresh tubes. On a storage tube, the information is written once only and the image is retained on the surface. The refresh screen, i f a raster scan, has a cathode ray beam that repeatedly scans the entire screen line by line. The storage scope gives good resolution and is flicker free, but i t is not possible to selectively erase parts of the screen as is the case with the refresh screen.
14
photochromic film cartridge which is continually
projected onto a large screen.
2.3 NEW ZEALAND DEPARTMENT OF LANDS AND SURVEY
The research work described in this thesis was done for
the New Zealand Department of Lands and Survey. This section
introduces their mapping requirements and describes the
hardware used for the experimental system.
2.3.1 ~~~round
The cadastral map has the primary function of
displaying land parcel boundaries annotated with their
appellation, area and survey plan reference. Its origins date
back more than 100 years. During this time, land surveys have been integrated in a single survey system and administered by
a single body - the NZLS. With the land parcel as the basic
unit, land title surveys are co-ordinated on a plane grid, the
survey plans prepared, and the cadastral maps produced to
display accurately the boundaries and description of every
land parcel. Besides the compilation of the cadastral map,
the Department must also provide an updated record through the
daily plotting of parcels and other information created by
approved survey data.
2.3.2 Compute_E !:!~El.!!S. Re~ire~nts
With a well established cadastral base,
requirements for land administration
resulted in a demand for greater cadastral
and planning
coverage of
the
have
the
country on scales larger than previously recorded.
Simultaneously, a new single grid using a metric projection
system was adopted by the NZLS. The result has been a
compiled from 12 different survey districts to the new metric
mapping grid. Continual demands for specialised maps
involving the conversion and adoption of existing maps for
purposes such as police geocoding schemes, statistical and
population analyses, and valuation recording, as well as the
requirement to convert to the new mapping grid, have provided
the impetus for a computerised mapping system in New Zealand.
Such a system will eventually give the benefits of:
(a) a large central data base~
(b) the ability to manipulate and interrogate the data
base,
(c) immediate updating facilities,
(d) the ability to provide special purpose maps at a
variety of scales,
(e) automatic conversion from an existing imperial
format to the new metric base map.
Since data is to be initially captured and subsequently
updated on a cadastral map basis, the map sheet will form the
basic unit within the system. The new cadastral sheets are
held at scales of 1:1000, 1:2000 and 1:10000 and are drawn
within a: 50cm x 75cm frame. The features on a sheet are land
parcels, roads and
feature is defined by
railways, and hydrographic features. A
its graphical form as well as its
supplementary descriptive data. All survey points on New
Zealand cadastral maps are restricted to:
(a) straight lines between points, for example, a road
boundary,
(b) surveyed arcs lying on the perimeter of a circle,
for example, the turning circle at the end of a no
exit street,
16
natural feature, for example, a coastline.
Every land parcel has associated with i t a plan number, lot or
parcel number, an area, and a certificate of title (C/T)
reference. ·In some instances, i t is necessary also to attach
to a parcel a gazette ~eference, which identifies the page
number and year of the gazette that describes the landis use,
for example, a recreational reserve or police station.
To incorporate descriptive text on the cadastral map,
we need some form of logical association between graphical
entities and their descriptive data. If this association can
be provided for in a well designed data base, then i t would be
possible to use this cartographic system as the basis for a
more generalised land information system. This would then
provide the capacity to interrogate and display certain
attributes in the data base and produce specialised maps such
as police geocoding schemes and census evaluation tracts.
Also, to assist in the conversion from the imperial
grid to the metric grid, the system must provide an effective
method for recording data from several imperial
documents and generating a single metric base map.
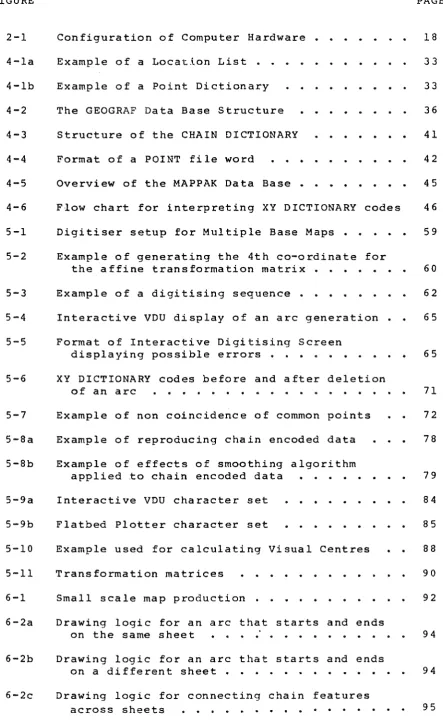
2.3.3 Hardw~ Configuration
source
The NZLS hardware configuration for the experimental
system is shown in figure 2-1. The graphical hardware
components are:
(a) DIGITISER: which is controlled by a micro
·processor and has inbuilt area, length, and skew
functions. When the cross hair cursor or pen type
stylus is used,
used are:
two of the six digitising modes
i) POINT: Single co-ordinates are recorded on
ii) SWITCHED STREAM INCREMENTAL: Co-ordinate
pairs are continuously updated if the last
point recorded differs from the previous
point by a user definable amount.
capture rate varies between 1 and
The
100
conversions per second depending on the user
selected setting.
(b) TEKTRONIX: which is a storage screen equiped with
a cross hair cursor and keyboard. It has 1023
addressable points on the X axis and 780 on the Y
axis.
(c) PLOTTER: which is on-line to the PDP 11/34 and has
a drawing surface of 78cm x 92cm. It is capable of
plotting high quality straight lines at 56cm per
second. Having a high repeatability factor, i t is
suitable for producing high quality cartographic
EDITING
and
UPDATING
>
a:
...
z
w
~
z
D
Summagraphics
ID 48 DIGITISER 36" X 48"
TEKTRONIX 4010 Graphics Screen
.._ DECWRITER l!.
.._ TTY
0
...1
n.
Broomall 430/101
FLATBED PLOTTER
31, X 3611
Figure 2-1
["-... "-...
I~
-
- ~-~
-
- -
--
--
-
-
-
- -
.
1\
PDP 11/34
48 K Words Memory
CONFIGURATION OF COMPUTER HARDWARE
<(
'\
18
TS03 9 Tract< Magtape
[image:23.607.41.526.54.694.2]CHAPTER THREE
MAP PROCESSING SYSTEMS
3.1 INTRODUCTION
This section reviews a number of mapping systems and
their specific application areas. A lack of formal cadastral
mapping bases in many countries results in a general absence
of cadastral systems such as that described in this thesis.
Therefore, the systems studied range from the very specific
applications area to large general purpose geographical
processing systems.
concerned primarily
The majority of systems developed
with information processing of
are
both
statistical and spatial data.
designed to serve the dual
None of the systems studied was
purpose of providing both a
with a parallel geographical
cadastral mapping base
information data base, as no description of such a system
could be found by the author.
The review of the systems is for the purpose of
formulating a set of design principles, rather than for a
critical analysis of the individual systems.
3.2 BRITISH ORDNANCE SURVEY
The prime function of the British Ordnance Survey (OS)
(Aktey 1975) is the maintenance of nearly a quarter of a
million large scale maps. In 1972, the OS embarked upon a
project to study automated techniques for digitising large
scale maps and to output the results graphically to the
accuracy attainable by conventional manual means. Their
20
maps.
The data capture subsystem uses manually controlled
cartographic digitisers to convert graphical data to digital
directly on magnetic tape. Source
form, and stores i t
documents are photographically enlarged by a 3:5 ratio to
provide maximum utilisation of the digitising surface. All
input is discrete points. No attempt is made to stream
digitise by following lines while periodically recording
co-ordinates. Points along curved lines are digitised at the
operator's discretion and a mathematical spline is applied in
subsequent processing to generate the additional points needed
to give a continuous curve. The generated points are then
stored in the data base. The following reasons were given for
adopting this approach rather than stream digitising:
(a) following lines with a cursor is difficult, and
therefore inaccurate. The gain in accuracy is
achieved through skilful selection of points for
the spline algorithm,
(b) i t is less tiring for the operator,
(c) selection of points puts skill, and therefore
satisfaction, into digitising,
(d) less complex digitisers are required,
(e) i t is more economic to to store only as much data
as is absolutely necessary to represent a line.
However, the author will describe a technique disputing the
assumption made in (a), and describe alternative techniques to
reduce the storage requirements for stream co-ordinates.
Before digitising, the document is pre-edited to assign
sequential numbers to all name and number positions on the
document. The digitising sequence requires these locations to
added at a later stage on specially designed forms.
All features are categorised by a descriptor denoting
their feature code. Prior to digitising a feature, the
feature code is recorded by digitising a point in a
pre-assigned me-11\1 area on the digitiser. The operator must
manually keep a record of digitised features to prevent
redigitisation. On map completion, the magnetic tape data is
processed and added to the OS data base. Data is held on a
map sheet basis with a header record containing information
about scale and origin. Each sheet is further subdivided into
1024 parts in both the x and y directions to:
(a) allow areas of a conventional size to be extracted
and plotted for specialised maps,
(b) allow packing of xy values into one computer word.
The data processing involves such items as:
(a) converting digiti sing table
tranverse mercator co-ordinates,
(b) producing points along a spline,
co-ordinates
(c) generating a parallel line for a railway.
to
An editing operation is necessary to check data for
•positional accuracy, completeness and correct feature coding"
(Atkey 1975). Accuracy and. completeness are checked by
superimposing the graphical plot over the original document.
A printer document lists feature serial numbers and their
descriptions to be matched with the plotter document.
Missing features are digitised while incorrect features
are edited by submitting their serial number and edit commands
on a card deck. The editing commands are:
(a) CODE: replaces a feature's code,
(b) DELETE: removes a feature from the data base,
22
junction with the boundary of another feature,
(d) PJOIN: replaces the end co-ordinate pair of one
feature with the co-ordinates of a second feature,
such that the two co-ordinates are the same.
Updating is implemented through the same mechanism.
The plotting subsystem uses a plotter fitted with a
light spot projector which plots directly onto photographic
film. Variable line widths are caused by changing the
projector;s aperture during the plot. After a few manual
operations which include the addition of slope and
ornamentation symbols, a printing plate is generated as the
final output from the system.
3.3 THE CANADA GEOGRAPHIC INFORMATION SYSTEM
The Canada Geographic Infbrmation System (CGIS) was
desiqned to "facilitate the use of data collected by the
Canada Land Inventory system" (Tomlinson 1976). Its primary
concern is with mapping the availability of land for various
uses. Although the system has a graphics display capability,
the emphasis is on the production of tabular displays.
The main storage unit is called a coverage; which
comprises data on such items as:
(a) soil suitability for agriculture,
(b) land capability for forestry,
(c) census boundaries,
as well as other land related information. Coverage data is
held on a polygon basis in the system and its descriptive data
is entered manually.
Image data in the form of polygons is entered by one of
two processes:
(b) offline digitising.
The scanner records one bit of information on a tape for every map square. A 76cm x 76cm map has 50 million map squares. Wherever lines are detected, a 1-bit is held for that square. A processing phase accepts 'clouds' of points and reduces them to lines one point wide using an algorithm called 'V-values' (Tomlinson 1973). The output from this process is basically a set of chain codes (see Chapter Four) representing the polygon. These are further processed and held in compact form in the Image Data Set file. Image data for each coverage is stored in an ordered hierarchy with descriptors linking all polygons of a specific coverage.
The retrieval and analysis of data requires the assistance of a programmer, a set of library programs, and any special purpose programs necessary to satisfy the request. The system will both plot maps and print tables produced by the manipulation subsystem. In 1975, the project designers were faced with the problem of automatically labelling maps without printing the labels on top of one another. The suggested solution was to move the label locations using an interactive display terminal. Another problem concerns detecting and discarding line segments which are not part of the polygons, but occur as a result of extraneous marks or dirt detected by the scanner. Finally, as a result of the method for holding data in the Image Data Set file, a saw-tooth effect is produced on the output of
boundaries.
3.4 CLOTS
polygon
24
in Southern Australia. The objective was to develop a general
acquisition system for land title office plans which would:
(a) allow mathematical che-cking of lodged plal)s,
(b) create a plottable file,
(c) create a data bank of all the plans,
(d) allow the amalgamation of plans or parts thereof to
generate a plottable file.
_The basic unit within the system, a lot, is ahy area on a plan
for which the boundary is known. Such areas include roads,
reserves and easements, all of which are restricted to
straight line segments.
The input subsystem accepts surveyed lot data on a plan
basis. Lot data must be entered clockwise around the plan.
Data is either corner co-ordinates and their sequence numbers,
or sequence numbers that delineate each lot, distances between
them, and the internal angles within the lot. In the latter
case, the data is processed to generate co-ordinates and
sequence numbers which are held in a co-ordinate file and
corner number file respectively. Both input and edit data is
entered using an interactive command language that issues
prompts for the required input. After an initial dialogue in
which the user supplies file names, plan numbers and other
.
initialisation data, the system is ready to accept lot data.The general format for input is
ptl/pt2:distance;bearing
where ptl and pt2 are two points connected by a line.
Variations of this format cater for instances where points are
already defined. A set of 12 commands provides the means for
building lot data records and editing existing records. No
graphical display is available as the data is entered.
options including plotting point numbers, specified lots, lot
numbers, and areas cater for various user requirements.
3.5 GEOGRAPHICAL INFORMATION -MANIPULATION AND MAPPING SYSTEM
The GEOGRAPHICAL INFORMATION - MANIPULATION and MAPPING
SYSTEM (GIMMS) was designed by Thomas Waugh (1977) to be a
general purpose geographic processing system, although its
primary use is in thematic mapping. It incorporates the basic
facilities of input, storage, and manipulation. A command
language provides the user interface to the system which can
run in batch or interactive mode. When using the system, the
user generally goes through three phases:
(a) establish locational data banks,
(b) establish non-locational data banks,
(c) manipulate the data banks to produce tables,
diagrams and maps.
The locational dat~ ba~ holds positional data related to
geographical entities. It uses three types of geographical
descriptions: points, line segments/networks, and area zones.
The generation of descriptions is on a hierarchical basis.
Locational data is prepared using a digitiser. Lines in a
network comprise a segment label and the points identifying
them. Area zones are constructed from line segments. Segment
referenced networks must be created with labels for each line
segment, reflecting the two areas for which i t is a boundary.
data banks
This mechanism for establishing locational
requires:
(a) the digitising of co-ordinates in an anticlockwise
direction around the zone corresponding to the left
26 (b) complex algorithms to construct area files after
having checked area zones to ensure geographical "completeness, correctness and consistency".
Example:
*
TYPE=POINTSx y co-ordinate
*
END*
TYPE=LINES /labell/ /label2/*
END*
TYPE=AREA• • • • • X m m y
••••• xn
yn/A/B/ ••••••• XmYm /A/C/
/AID/
/B/C/
IBID/
/C/D/
*
ENDD
Point q, for example, is at the junction of three segments and will be digitised three times. The system requires that the co-ordinates of the point be equal for boundary checking and area file creation.
Non locational data banks contain numeric and alphanumeric information related to geographical zones. Up to 100 variables can be specified for a zone. User-chosen names are associated with elements in the data set and using arithmetic and logical operations, new data items are created
from existing sets. For example, i f
Vl = number of rented dwellings, and V2
=
number of owned dwellingsSET PCRENT (Vl*l00/(Vl+V2))
Manipulation facilities also perform arithmetic and
logical operations on a zone~s non locational data set.
Output from the manipulation system includes printer listings,
tables, and histograms, printer maps using shading techniques,
and graphical plots. A variety of commands are included to
indicate the nature and format of the output, including
interfaces to such plotting packages as
GERBER. The system includes a range
character set
capabilities.
with both super-script
GINO, CALCOMP and
of symbols and a
and sub-script
The system in general suffers from the following
problems:
(a) symbol location uses a geographical centroid
calculation which may generate a point outside a
concave shaped zone,
(b) appearance of plotted circles is a problem as the
beginning and end points are visible, and small
circles tend to be square,
(c) non-locational data cannot be attached to line
segments, but only to line networks,
(d) hidden line removal is
overlapping regions.
not implemented for
Nevertheless, this system is used by a number of organisations
throughout the world.
3.6 POLYGON INFORMATION OVERLAY SYSTEM
The Polygon Information Overlay System (PIOS),
(Tomlinson 1977), was designed to provide data for computer
models to serve local and regional planners in Canada. Data
the co-ordinates of its vertices. Each polygon
classification data associated with i t such as floodplain
data, traffic zone data, or noise contour data for an airport.
The system uses polygon overlays to calculate areas and
produce primarily tabular results.
The land use inventory consists of maps showing
polygons interpreted from aerial photography rather than land
use by parcels. Data is entered via a digitiser .and keyboard.
The digitiser operator has to align each map so that the map's
co-ordinate axes are parallel to the digitiser axes. This
operation takes from 15 to 30 minutes for each map.
Digitising is also hindered in that points can be digitised
faster than the machine can read them and the digitiser origin
often shifts due to equipment malfunctions, voltage
variations, and insufficient insulation in the digitisers.
Once digitised, error correction requires redigitising
erroneous polygons from proof plots used to highlight errors.
Error free files are then merged for each classification data
variable and ordered by map number, classification data value,
polygon number and polygon type code. The type code
identifies polygons completely contained within other
polygons, which is required for computing the outer polygon's
area.
Data retrieval and analysis comprises the measurement
of polygon areas, and the overlaying of two sets of polygons
with calculations of the intersection area.
3.7 SUMMARY
The aim in this section has been to discover the
essential elements a mapping system should include, avoiding
rise to possible problem areas. This permits the compilation
of a list identifying the tools necessary to implement a
successful system. From the systems studied, the author
derived the following conclusions:
(a) Interactive systems provide better facilities for
the user than off-line systems,
(b) Dual cartographic/geographical processing systems
are possible provided the cartographic data is in
a form accessible to an information processing
subsystem,
(c) Preprocessing of input data prior to digitising,
digitising sequence restrictions, and entry of
descriptive data during digitising, should all be
kept to a minimum,
(d) Alignment of map axes with digitiser axes must not
be necessary,
(e) It can be expensive to store map co-ordinates as
actual grid co-ordinates in preference to holding
them as offsets from a false origin,
(f) Co-ordinate compaction for stream oriented data is
·necessary to reduce file sizes,
(g) Digitising from large scale maps is preferable to
generating large scale maps from small scale data,
(h) Some form of windowing is necessary for successful
graphical manipulations,
(j) Location of descriptive text requires user
controllable centroids and/or visual centres in
CHAPTER FOUR
DATA BASE DESIGN
4.1 REQUIREMENTS FOR A DATA BASE
During the design of a data objectives must often be resolved. result of:
30
base, conflicting These conflicts are a
(a) the limitations of the available hardware,
(b) the multiple requirements that the system must serve.
The data base design must result in a structure that organises the data elements in the files such tnat the
relationships between data elements is maintained.
logical
The following factors must be taken into consideration during the design phase, and are partly responsible for the conflicting objectives. No attempt has been made to organise the requirements in order of priority.
A general design principle is that all data be structured so that i t can be retrieved
"totally and flexibly" (Williams 1971).
preserve the present, logical associations between
data elements.
(c) Access. The structure should provide for quick
access to, and efficient updating of, data items.
In general, a data base must allow for
interrogation by data element attributes, for the
selective searching of data elements and for the
display of the results within a time period
acceptable to the user. The structure must also
allow for use of an efficient method for initial
data entry and subsequent updating.
(d) 212r~g~ Beguir~ts. Two types of structures:
i) external files which hold the data on mass
storage, and
ii) internal files which represent the memory
resident copies of external files,
must be considered in terms of storage
requirements. At this stage the designer must make
a compromise. Generally, storage requirements may
be reduced at the expense of additional processor
time to reconstruct the data element relationships.
The designer's problem is to specify a data structure which,
for a given situation, is satisfactory in terms of the above
factors.
4.2 CARTOGRAPHIC DATA STRUCTURES
Cartographic data bases contain two types of data:
(a) co-ordinate data necessary for the production of
linework,
(b) text data describing cartographic features and
32
Here we review existing techniques for the organisation of
co-ordinate data files and the methods by which cartographic
features can be defined by their co-ordinates. The techniques
range from the very simplest, referred to by Schmidt {1974) as
cartographic spaghetti, to sophisticated,
application-depend-ent structures such as DIME {Cooke 1967) and GEOGRAF {Peucker
1977). As well as the objectives described in 4.1, the
evaluation of each type of structure should take into account
the design criteria presented in section 4.3.2.
4.2.1 Cartog:_£aphic §,.E2,ghetti
This refers to any elementary technique that generates
an unstructured file of line data. The data cannot therefore
be manipulated and is useful only for reproducing maps. Such
a system was used by WORLD DATA BANKS I and II {Schmidt 1969).
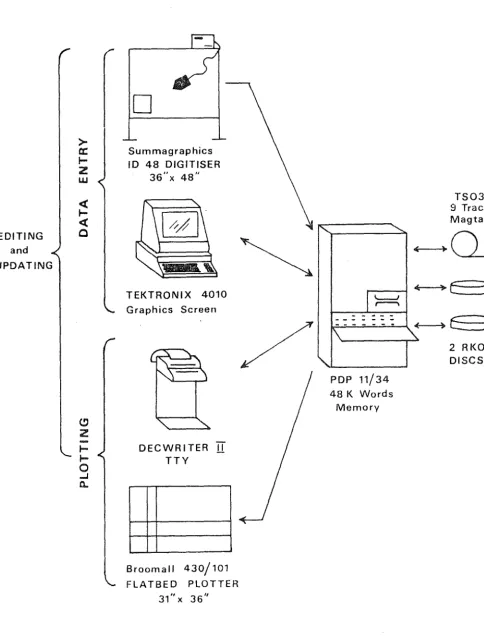
4.2.2 Location 1ists
With this technique, a feature is defined by specifying
each of the co-ordinates around its boundary. No allowance is
made for adjacent entities sharing common lines (see Figure
4-1) • Such a system has several shortcomings.. Boundary
segments between adjacent entities have to be digitised at
least twice, resulting in all but the boundary points being
stored twice. The problem of ~sliver; lines arises, as we get lines duplicated in slightly different positions. Also, i t is
uneconomical to encode entities independently because of the
time required after digit ising to edit out any
inconsistencies. Map Model (Arms 1970) is a system that uses
the above technique but searches for segment lines that are
common to two entities and removes one. Segments that have no
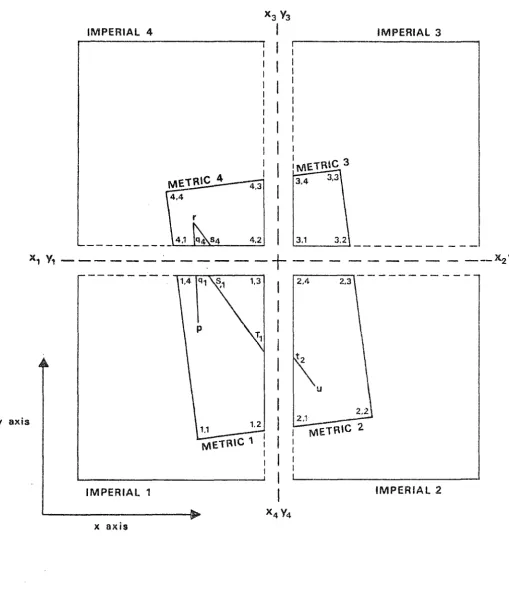
POLYGON 1 x,,, Y,, x1.2 Ytz
x,n Ytn
POLYGON 2 Xz.1 Yz,1
Xz.2 Yz,z
X z,n Yz,n
Figure 4-la
Example of a Location List
POINTS x, Y,
Xz Yz
20
Xn Yn
4
POLYGON 1 1, 2,3,4, 5, 6, 7, 1
1
3
POLYGON 2 12, 13, 14, 15,16,.6
POLYGON 3 1,2,3.4. 15, 14,13
5
Figure 4-lb
[image:38.595.62.538.98.589.2] [image:38.595.46.550.448.697.2]34
4.2.3 !oint .Q.ictio~ries
This technique uses two structures: Point Dictionaries
and Feature Boundary Lists. The Point Dictionary contains all
the co-ordinates on the map, and a Feature Boundary List
contains a list of all points that represent a given entity.
This approach is used in INTERMAP (Peucker 1973) and GIMMS
(Waugh 1977). The problem of 'sliver' lines is avoided but
the plotting problem is compounded as lines are arbitrarily
referenced. Unless some method for detecting duplicate lines
is applied, this technique suffers from the duplicate plotting
of lines.
4~2.4 folyg2£ Syst~
This is a similar technique to the use of Point
Dictionaries and i t is used by the Polygon Informatibn Overlay
System (see Section 3.6). The method is to digitise
neighbouring lines between two segments only once and store
these as separate co-ordinates in a Segment Definition file.
Polygons are then defined by a sequence of these segments
indexed by a number. A negative number indicates that the
segment was recorded previously. This method suffers from
duplicate plotting of common boundaries.
4.2.5 DIME
The DIME file is an application-dependent structure
that cannot be adequately used for cartographic systems. It
was developed for the US Bureau of the Census to provide
checking for errors in the address coding of the 1970 census.
Streets are decomposed into straight line segments and each
segment contains identifiers to:
(a) the end co-ordinates of the segment,
(c) the high and low street addresses.
Files are very large and i t is not possible to combine segments to form more complex objects.
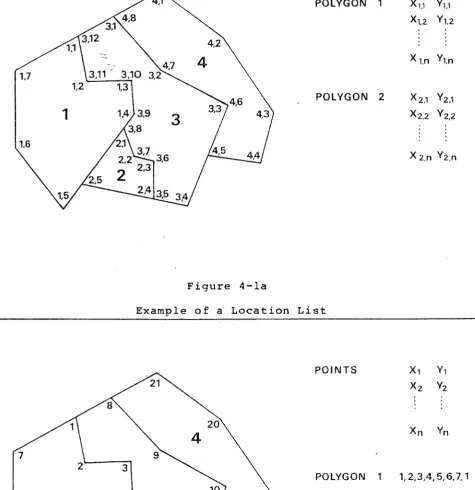
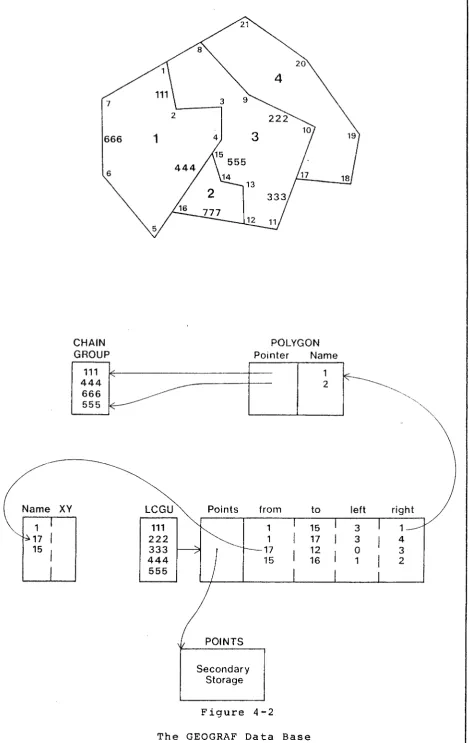
4.2.6 GEOGRAF
---This system is similar to the DIME in that i t defines a segment by a set of chains. Each chain has two nodes at its ends, separates two areas, but may be constructed from many points. However, for multiple polygon types that overlap, a chain that differentiates only two areas cannot remain the controlling unit. An additional structure called the Least Common Geographic Unit (LCGU) defines areas that are uncut by further partitioning and uses chains to define these areas. Polygons then comprise. 1 to n elements from this new set, and a complex hierarchy of relationships can be built (see Figure 4-2) • The data structure in section 4.3.3 uses a similar structure but uses a feature aggregation procedure (see section 6.3.2) to generate complex data sets.
Each of the methods described above has its particular disadvantages. In addition, none allows for graphical data types other than straight line segments. A requirement for a cartographic data base is that i t can hold all needed graphical data types.
4.3 PROPOSED STRUCTURE
Name
666
6
CHAIN GROUP
liiiV
XY LCGU
111
222 333 444 555
20
POLYGON Pointer Name
I I
i
~',,,~
Points
POINTS Secondary
Storage
from
1
1 17 15
Figure 4-2
to left right
[image:41.595.50.521.40.784.2]data base structure depends on the application requirements,
but within an interactive system i t is essential to have a
structure that allows rapid access to data elements.
4.3.1 Data Ba~ f.te~
Within any cartographic data base, two distinct data
structures are necessary. As stated in section 4.2, the first
structure contains the g~aphical data sets necessary for the
plotting of the map while the second contains data sets that
relate feature attributes and descriptions to the physical
features on the map. Appendix One contains a description of
the data set elements for the NZLS. The survey data on New
Zealand cartographic maps comprises features that are mad~ up
of:
(a) straight lines between two points,
(b) arcs lying on the circumference of a circle,
(c) irregular curves
rivers.
representing coastlines and
In section 4.3.3, we explain the techniques and structures
used to hold the above items.
4.3.2 ~~cific Qat~ Ba~ Re~irements
The major design criteria affecting the structures
outlined in section 4.3.3 are:
(a) The graphical data must be structured so that the
display of a map, or portions thereof, is fast
enough to allow generation during interactive
digitising, and so that the plotting algorithm is
efficient and not subject to error,
(b) Insertion of graphical data must be simple without
the need for any form of pre-processing prior to
38
ability to associate descriptive data files with
their co-ordinate data,
(c) Modification of the structure through editing and
updating should be accomplished with ease,
(d) The structure should allow additional data sets to
be incorporated with minimal difficulty,
(e) Storage requirements should be minimised subject to
the above requirements. For example, we should not
store multiple copies of the same co-ordinate.
4.3.3 .Q.etailed .Q~ign
In the data base there are two distinct file types; the
Graphical Data Set (GDS) and the Descriptive Data Set (DDS).
(A) The Gra££ical Data Set contains all the data
necessary for the reproduction of the three basic types of
linework (Section 4.3.1). Features such as coastlines cannot
be specified by a single mathematical curve fitting
approximation, and are held, in chain encoded form, in a data
structure called a CHAIN DICTIONARY. Straight lines and
circular arcs are held in a coded format in a single file
which is called an XY DICTIONARY.
The XY DICTIONARY contains x and y co-ordinates
relative to the bottom left hand corner of the map. Each
co-ordinate pair is coded in such a way that, in a single pass
through the DICTIONARY, the plotting algorithm can determine
whether the current co-ordinate pair represents:
(a) a point connected by a straight line to the next
point,
(b) the end of a straight line and:
i) the start of a circular arc,
ii) the next point is the start of a circular
(c) the end of a circular arc and:
i) the start of another arc,
ii) the start of a lLne,
iii) the· next point is the start of a circular
arc,
iv) the next point is the start of a new line,
(d) a point that has been deleted from the data base
(see Section 5.2.3).
In the coding scheme, a line is defined by two
consecutive co-ordinate pairs. Circular arcs are defined by
a starting point, any point on the circumference of the arc,
and the end point. The plotting algorithm uses the three
points to calculate the centre and radius df the arc, as well
as determining the starting point in order to generate an arc
through the three points. The circular arc algorithm draws
anticlockwise and must therefore establish from which point
(the first or third) i t must commence drawing in order to pass
through the second point. This apparently trivial problem is,
in many other systems, avoided by restricting the order in
which points are digitised, that is, they must be digitised in
a clockwise or anticlockwise order.
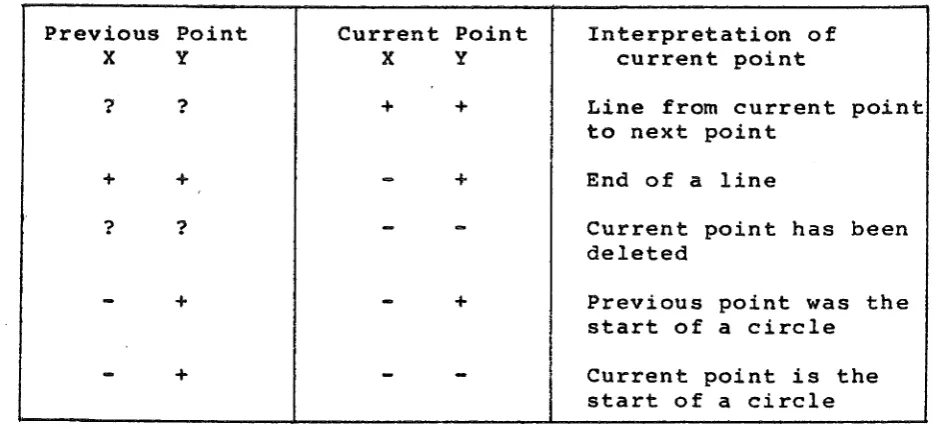
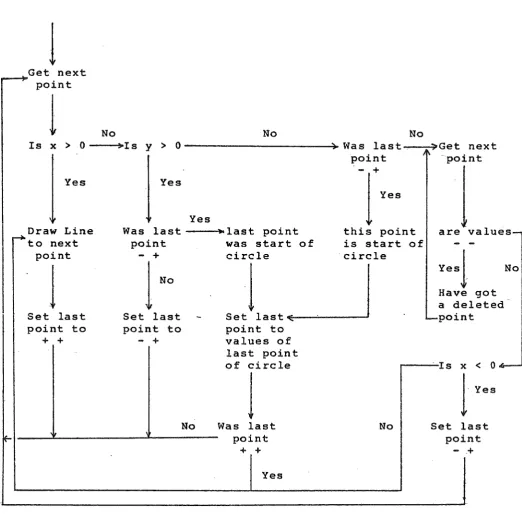
The coding scheme used in the XY DICTIONARY uses the
four possible.sign combinations available from two variables.
The table on the next page summarises the coding structure
interpretation. The algorithm to interpret the coding
structure is given in Figure 4-6.
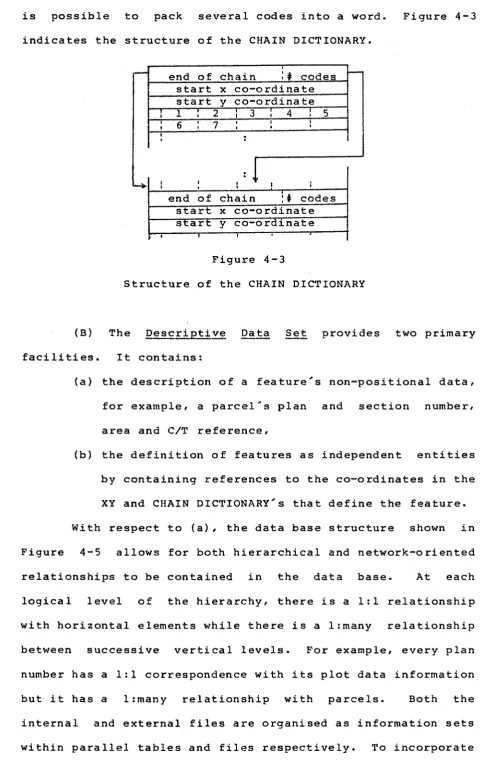
The second structure, the CHAIN DICTIONARY, is used to
hold all features composed of irregular curves. Chain
encoding was developed by Freeman (1962) and aids in the
40
Previous Point Current Point Interpretation of
X y X y current point
? ? + + Line from current point
to next point
+ +
-
+ End of a line? ?
-
-
Current point has beendeleted
-
+-
+ Previous point was thestart of a circle
-
+-
-
Current point is thestart of a circle
Table of XY DICTIONARY codes and their interpretation.
co-ordinates that define curves. The curve is approximated by
a sequence of vectors of a unit length in one of eight
possible directions from the end of the previous point.
Consequently, given a starting point, a scale defining the
unit length, and a series of chain codes, i t is possible to
reproduce the curve~
As the chain length decreases, the accuracy of the
approximation increases, but there is a corresponding increase
in the number of chain codes. An optimal chain length will
depend on the requirements of a specific application. With a
smoothing algorithm (see Section 5.3.3), i t is possible to
increase the chain length and still produce an adequate
cartographic reproduction of the feature. Chapter 7 describes
a technique developed by the author that further reduces the
amount of information necessary to reproduce a curve and
allows the user to specify the minimum change in direction
from the previous point.
[image:45.595.61.529.54.268.2]