ORIGINAL RESEARCH
A Validation Study of Multicenter Diffusion
Tensor Imaging: Reliability of Fractional
Anisotropy and Diffusivity Values
R.J. Fox K. Sakaie J.-C. Lee J.P. Debbins Y. Liu D.L. Arnold E.R. Melhem C.H. Smith M.D. Philips M. Lowe E. Fisher
BACKGROUND AND PURPOSE:DTI is increasingly being used as a measure to study tissue damage in several neurologic diseases. Our aim was to investigate the comparability of DTI measures between different MR imaging magnets and platforms.
MATERIALS AND METHODS: Two healthy volunteers underwent DTI on five 3T MR imaging scanners (3 Trios and 2 Signas) by using a matched 33 noncollinear diffusion-direction pulse sequence. Within each subject, a total of 16 white matter (corpus callosum, periventricular, and deep white matter) and gray matter (cortical and deep gray) ROIs were drawn on a single image set and then were coregis-tered to the other images. Mean FA, ADC, and longitudinal and transverse diffusivities were calculated within each ROI. Concordance correlations were derived by comparing ROI DTI values among each of the 5 magnets.
RESULTS: Mean concordance for FA was 0.96; for both longitudinal and transverse diffusivities, it was 0.93; and for ADC, it was 0.88. Mean scan-rescan concordance was 0.96 – 0.97 for all DTI measures. Concordance correlations within platforms were, in general, better than those between platforms for all DTI measures (mean concordance of 0.96).
CONCLUSIONS:We found that a 3T magnet and high-angular-resolution pulse sequence yielded comparable DTI measurements across different MR imaging magnets and platforms. Our results indicate that FA is the most comparable measure across magnets, followed by individual diffusivities. The comparability of DTI measures between different magnets supports the feasibility of multicen-tered clinical trials by using DTI as an outcome measure.
ABBREVIATIONS:CV⫽coefficient of variation; FA⫽fractional anisotropy;⬜⫽transverse diffu-sivity;储⫽longitudinal diffusivity; MPRAGE⫽magnetization-prepared rapid acquisition of gradient echo; TIM⫽Total Imaging Matrix
D
TI provides a quantitative measurement of the magnitude and direction of water diffusion within tissues.1,2Changesin water diffusion reflect alterations in tissue microstructure3
and thus make DTI a noninvasive technique to study diseases caused by tissue destruction, such as MS.2,4The extent of tis-sue injury is commonly evaluated by using DTI-derived mea-sures such as FA,储,⬜, and ADC.2,5Studies in patients with
MS revealed changes in DTI measures not only within MS lesions but also in normal-appearing white matter and gray matter, which are generally not discernible by using conven-tional T1- and T2-weighted imaging techniques.6-9
The sensitivity of DTI metrics to ongoing changes in the brain makes it an attractive outcome measure for MS
thera-peutic studies.10However, little is known about the validity of DTI measures between scanners. Recently, 2 independent studies11,12have attempted to address the reproducibility of
DTI measures. They assessed FA11,12and⬜11in the corpus
callosum across different centers, all by using 3T scanners. They both found DTI measures to generally be homogeneous across centers when measured with scanners from the same manufacturer.
However, 2 major issues that remain to be resolved are the following: the comparability of DTI measures across different brain regions and the comparability of DTI measures across different scanners. We thus sought to address these issues by comparing DTI measures obtained from 5 centers from 2 sub-jects. We addressed the following issues: 1) scanners from dif-ferent manufacturers, 2) multiple platforms from the same manufacturer, 3) DTI measures from different brain regions with a wide range of anisotropy, and 4) software upgrades.
Materials and Methods
MR Imaging Scanners
Two volunteers (both men and age 35, healthy controls) were imaged on five 3T MR imaging magnets located in different locations: 3 Trios (Siemens, Erlangen, Germany) and 2 Signas (GE Healthcare, Milwau-kee, Wisconsin). In addition, the same volunteers were imaged annu-ally during the course of 2 years (year 2 and year 3 on one of the Siemens magnets, Trio-1). During the course of the study, a scanner upgrade (TIM upgrade) on the Trio-1 alone between years 1 and 2 Received April 21, 2011; accepted after revision June 24.
From the Mellen Center for Multiple Sclerosis (R.J.F.), Diagnostic Radiology (K.S., M.D.P., M.L.), Quantitative Health Sciences (J.-C.L.), and Department of Biomedical Engineering (E.F.), Cleveland Clinic, Cleveland, Ohio; Barrow Neurological Institute (J.P.D.), Phoenix, Arizona; St. Luke’s Medical Center (Y.L.), Milwaukee, Wisconsin; Montreal Neurological Institute (D.L.A.), McGill University, Montreal, Quebec, Canada; and Genentech Inc. (C.H.S.), Seattle, Washington.
This work was supported by NIH K23 NS 47211 (R.J.F.), NMSS RG 4091 A3/1 (R.J.F.), and a research grant from Genentech.
Please address correspondence to Robert J. Fox, MD, Mellen Center for Multiple Sclerosis Treatment and Research, Cleveland Clinic Foundation, 9500 Euclid Ave, U-10, Cleveland, OH; e-mail: [email protected]
Indicates open access to non-subscribers at www.ajnr.org
Indicates article with supplemental on-line figures.
http://dx.doi.org/10.3174/ajnr.A2844
BRAIN
ORIGINAL
allowed comparisons across the upgrade (year 1 versus year 2) as well as independent of the upgrade (year 2 versus year 3). The other 2 Trio scanners (year 1) were used before the TIM upgrade.
Imaging Protocol
On the Siemens scanners, imaging included anatomic T1 MPRAGE (256⫻256 mm FOV, 256⫻128 matrix, 120 1.2-mm-thick sections, TE⫽1.71 ms, TR⫽1900 ms, TI⫽900 ms, bandwidth⫽490 Hz/Px) and twice-refocused spin-echo DTI with an EPI readout (256⫻256 mm FOV, 104⫻104 matrix, 3 slabs of sixteen 2.5-mm thick sections, partial Fourier factor⫽6/8, TE⫽100 ms, TR⫽2500 ms, band-width⫽1456 Hz/Px, 33 noncollinear diffusion-weighting directions withb⫽1000 s/mm2and 9b⫽0 acquisitions, 4 repeats for each slab).
We adapted these pulse sequences to the GE scanners, endeavor-ing to match the parameters. The imagendeavor-ing included anatomic T1 MPRAGE (spoiled gradient-recalled 256⫻256 FOV, 128⫻128 ma-trix, 124 sections, 1.2 mm thick, TE⫽1.3 ms, TR⫽2800 ms, TI⫽900 ms, bandwidth⫽977 Hz/Px) and twice-refocused spin-echo DTI with EPI readout (same as for Siemens, except TE⫽94 ms, TR⫽ 4200 ms, bandwidth⫽1954 Hz/Px). The diffusion-gradient direc-tions were explicitly matched to be the same on each scanner. The voxel size of DTI for both Siemens and GE scanners was 2.5⫻2.5⫻ 2.5 mm.
Data Analysis
Image Registration.Images were registered by using a
surface-based method, a modified version of the Iterated Closest Point algo-rithm,13which minimized the distance between automatically
seg-mented brain surfaces to determine the optimal rigid transformation (3 rotations⫹3 translations). Transformation parameters were de-termined between the DTI and MPRAGE images acquired at the same
site and between the MPRAGE images acquired at each of the 5 sites. These parameters were further combined to obtain a set of final reg-istration transformation parameters, which were used to map ROIs as described below.
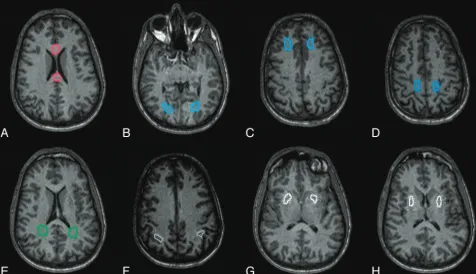
Mapping ROIs.For each subject, 16 ROIs were drawn on the
MPRAGE image from 1 of the magnets (Trio-1, Fig 1), which was used as a reference mask. The ROIs encompassed 5 major areas with differing anisotropic properties: 1) the corpus callosum (genu, sp-lenium), 2) periventricular white matter (parietal, occipital), 3) deep white matter (frontal, parietal, occipital), 4) cortical gray matter (pos-terior parietal, occipital), and 5) deep gray matter (putamen). ROI volumes ranged from approximately 182 to 742 mm3, with the
small-est ROIs located in the cortex. The final registration transformations (described above) were applied to coregister the reference ROI mask to each set of DTI images obtained from the other 4 centers. The ROIs were verified visually and adjusted manually to account for nonlinear distortions inherent to EPI data.
Calculation of FA,储,⬜, and ADC.Mean values for FA,储and
⬜, and ADC were calculated within each ROI. The diffusion tensor
and its properties (eigenvalues, FA, and ADC) were calculated by using software developed in-house. First, the diffusion profile for the 33 diffusion directions was calculated on a voxel-by-voxel basis by a standard linear-log fit.14The diffusion profile was fit to the 9-element
diffusion tensor by using least-squares. The tensor was then diagonal-ized to obtain the eigenvalues and eigenvectors by using standard routines to derive储and⬜.15ADC was calculated by taking the
mean of the eigenvalues, and FA was derived accordingly.1
Statistical Analysis
All analyses were performed by using SAS (SAS Institute, Cary, North Carolina). The Lin concordance correlation16was used to compute Fig 1.White and gray matter ROIs used for calculating DTI metrics in a single subject. Similar ROIs were used in the second subject.A, Anterior and posterior corpus callosum (red).
B–D, Deep white matter (left and right occipital, frontal, and parietal, respectively; blue).E, Left and right periventricular white matter (green).F, Left and right cortical gray matter (gray).
[image:2.594.57.534.45.319.2]concordance among DTI measures from all 16 ROIs. The following comparisons were made to evaluate the relationship between scan-ners: 1) overall mean concordance (ie, the mean of each paired con-cordance analysis) among each of the 5 magnets, 2) overall mean concordance within the 3 Siemens and within the 2 GE magnets (same-platform comparison), 3) overall mean concordance between the Siemens and GE magnets (cross-platform comparison), 4) longi-tudinal comparison (year 1–year 3) in Trio-1, and 5) before and after TIM upgrade in Trio-1. The CV was derived within each ROI among the 5 different scanners and longitudinally within the single scanner, and it was then averaged together across the ROIs and 2 study subjects.
Results
Overall Comparison among the 5 Magnets
The regional mean DTI values were comparable among all 5 scanners (Fig 2). The FA,储,⬜, and ADC values obtained
from regions of low (gray matter), medium (periventricular and deep white matter), and high (corpus callosum) anisot-ropy were very similar among the 5 scanners. As indicated by
[image:3.594.56.535.49.448.2]error bars in Fig 2, the储,⬜, and ADC values were more variable in the cortical gray matter compared with other re-gions, possibly because these ROIs were smaller and, there-fore, more sensitive to noise. Because FA is calculated as a ratio with diffusivities in the numerator and denominator, noise effects may partially cancel out. The overall mean concor-dance (Table 1) was highest for FA (0.96) and lowest for ADC (0.88), with the values for both⬜and储being 0.93.
Table 1: Mean concordance coefficients of DTI measuresa
Type of Concordance FA 储 ⬜ ADC
Overall mean concordance 0.96 0.93 0.93 0.88
Cross-platform mean concordance 0.96 0.92 0.91 0.86
Siemens mean concordance 0.96 0.93 0.93 0.89
GE correlation (1 comparison only) 0.97 0.94 0.94 0.90
Longitudinal mean concordance 0.96 0.96 0.97 0.96
Across-system upgrade 0.95 0.96 0.97 0.96
After system upgrade 0.97 0.95 0.97 0.96
aAverage Lin’s concordance coefficients comparing different imaging conditions across all regions from both subjects. Each value represents the mean of the different between-magnet concordance coefficients.
[image:3.594.299.533.505.592.2]Cross-Platform Comparison
To evaluate manufacturer differences, we compared the DTI measures obtained from the 3 Siemens platforms with those from the 2 GE platforms (On-line Fig 1 and Table 1). The concordance was strongest for FA (0.96), followed by储(0.92) and⬜(0.91), and weakest for ADC (0.86).
Within-Platform Comparison
We found better concordance in the within-platform than the cross-platform comparison (Table 1, On-line Fig 1). We found concordance to be the strongest for FA (0.96 for Sie-mens; 0.97 for GE). In addition, we also determined dance for the other 3 DTI measures and found strong concor-dance for⬜and储(0.93 for Siemens, 0.94 for GE) as well. As in earlier cases, we observed a weak concordance for ADC (0.89 for Siemens, 0.90 for GE).
Longitudinal Scan Comparison
There was a modestly higher concordance with储,⬜, and ADC when the 2 subjects were rescanned on the same Siemens magnet (Table 1 and On-line Fig 2), compared with findings between magnets.
Software Upgrade Comparison
The first longitudinal scan (year 1) was obtained before the Siemens TIM upgrade, and the subsequent 2 scans (year 2 and year 3) were obtained after the upgrade. There was excellent correlation both across and after the software upgrade (Table 1 and On-line Fig 2). We observed a small decrease in mean FA in periventricular and deep white matter regions, which was driven predominantly by a corresponding increase in⬜ (On-line Fig 2). There was also a small increase in ADC values following the TIM upgrade (On-line Fig 2); however, that did not appear to have any effect on concordance values.
CV
The CV across scanners varied from 4.8% to 9.1%, depending upon the DTI measure (Table 2). CV was less within-scanner with time, compared with across different scanners. CV was generally lower when evaluating white matter only.
Discussion
We evaluated the applicability of DTI in multicenter clinical trials by systematically comparing DTI measures obtained by scanning 2 subjects in 5 different 3T MR imaging scanners by using a standardized pulse sequence. Comparability of DTI measures is important when combining values from different magnets and different platforms together into a single dataset. We observed very strong concordances (Fig 2 and On-line Fig 1 and Table 1) for FA,⬜, and储values across different
mag-nets within different brain regions encompassing both white and gray matter.
Reliability of FA and⬜
We found the highest concordance for FA (0.96) followed by the 2 component diffusivities and the weakest for ADC. One explanation for the lower ADC concordance is that because ADC is the mean of the diffusion tensor eigenvalues, it can reflect variability due to changes in the overall magnitude of diffusivity, anisotropy of diffusivity, or a combination of the 2 effects. Therefore, fitting the diffusion profile to a single iso-tropic coefficient may lead to considerable variability. More-over, diffusion in the brain is not isotropic, thereby making the derivation of a precise diffusion coefficient value more com-plex. A previous simulation study had also predicted that cross-scanner comparisons would find greater variability in ADC than FA, due to the underlying properties of ADC calcu-lations as mentioned above.17The results of our study suggest
that ADC may provide less statistical power than the other metrics examined. However, our CV estimates found the greatest variability in FA and the least in ADC (Table 2). Be-cause FA is a unitless ratio of eigenvalues, variability in indi-vidual eigenvalues may compound when eigenvalues are com-bined to derive FA, leading to greater variability. Concordance values are a function not only of the absolute difference in values but also the range of values. As evident from Fig 2, there are more significant variations in FA values throughout the brain compared with ADC, thus having a positive impact on concordance, despite the higher CV. In addition, FA becomes non-Gaussian at high values, whereby the same amount of noise in individual eigenvalues will lead to less variability with high FAs compared with low FAs. This non-Gaussian behavior of FA may have contributed to its stronger concordance.
Two potential sources of error in our study are inaccuracies in image coregistration and variability in different diffusion pulse sequences across platforms. Inaccuracies in coregistra-tion would decrease the observed correlacoregistra-tions between ROIs, which is expected to be greater between platforms. FA,储, and
⬜have greater regional variability than ADC, which would suggest that FA and component diffusivities would be more susceptible to coregistration error and thus have weaker con-cordance correlations. We have, in fact, observed the oppo-site—stronger correlations with regional FA and component diffusivities than ADC. We used identical pulse sequences within platforms and matched the pulse sequences between platforms. The effect of a less well-matched pulse sequence is not known.
These observations regarding comparability suggest that in multicentered studies, it may be best to rank regional FA fol-lowed by component diffusivities as a higher priority outcome measure than regional ADC. Furthermore, our observations suggest that ROI analyses are sufficiently reproducible to apply in multicentered studies. This is of significance especially in MS, because subtle changes within small regions of the brain may go undetected in a whole-brain histogram analysis. Fur-thermore, changes in DTI values have been shown pathologi-cally to reflect alterations in tissue integrity.18We have
evalu-ated 16 ROIs in 2 healthy controls and found similar concordance in both individuals (Fig 2). Although it is un-likely that our observations would change with additional
Table 2: Mean CVs across ROIs
Scanner Comparison CV across ROIs FA 储 ⬜ ADC
Across 5 scanners Overall CV (%), white
matter only CV (%)
9.1 5.0 6.6 4.8
6.8 4.3 4.3 4.1
Same scanner with time Overall CV (%), white
matter only CV (%)
9.6 3.7 4.2 2.2
8.7 3.5 4.6 2.2
healthy controls, the cross-scanner comparability of DTI mea-sures in individuals with MS is not known. Most important, all the measures from 16 ROIs were used to estimate Lin con-cordance coefficient. Due to small sample sizes, we did not perform statistical comparisons among the concordance coefficients.
Partial volume averaging between fiber populations of ferent orientations can lead to systematic dependence of dif-fusion tensor properties on parameters such as voxel volume, shape, or location.19Although this study suggests the
feasibil-ity of a multicenter DTI trial, the concordances may vary with changes in scan parameters.
Longitudinal Scan and Software Upgrade Comparison
We included a longitudinal scan-rescan analysis, in which we found FA concordance similar to that observed between mag-nets. Component diffusivities and ADC values were modestly more reproducible on scan-rescan than between scanners. This difference likely reflects cross-scanner differences in the absolute measures of diffusivity, a difference that is greatly reduced when using a scalar measure such as FA. The similar-ity of FA concordance values between and within magnets suggests that the remaining variability is likely secondary to either biologic variability or errors in co-registration. Scan-rescan reproducibility of DTI measures with 3T scanners has been previously published and has been satisfactory for FA and ADC values (ⱕ5%).20,21In our study, we have
addition-ally determined regional values for diffusivity measures and found them to be comparable.
In the longitudinal scan-rescan component of our study, scanner upgrade led to a slight shift in FA values, which ap-peared to be driven predominantly by a small change in⬜. Despite slight changes in diffusion values, DTI scans retained good concordance following the system upgrade. This is im-portant because it is difficult to maintain specific platform software and hardware configurations during the course of a prolonged longitudinal study. This observation suggests that longitudinal control subjects may be useful in longitudinal studies of patients with disease, particularly across system upgrades.
Our studies used a high-field magnet (3T) and a high-an-gular-resolution pulse sequence (33 noncollinear directions), which have been found, in previous studies, to provide robust diffusion tensor estimates.17Because low-angular-resolution (eg, 6-direction DTI) decreases the reliability of tensor esti-mates, it is likely that concordance would be lower. A 1.5T system will, in general, demonstrate a lower signal intensity– to-noise ratio but less susceptibility-related artifacts than a 3T system. The choice of field may, therefore, hinge on whether the ROI is located in areas of brain that have susceptibility artifacts, such as the medial temporal lobe.9A previous
scan-rescan study of 8 healthy adults by using a single 1.5T magnet and a 60-direction DTI pulse sequence found 3%– 6% within-patient CV in FA and MD in different organized fiber tracts.22
When the authors re-analyzed their data by using only 12 di-rections, there was little change in CV, though the tracts were significantly smaller and had a higher FA and lower MD.
Another scan-rescan study on 10 healthy adults by using two 1.5T scanners, a 6-direction DTI pulse sequence, and an ROI approach found a within-scanner CV of 1.9% for FA in
the corpus callosum.23The non-Gaussian distribution of high
FA values in the corpus callosum may have contributed to the low CV. In the same study, CV increased to 4.5% when com-paring between scanners.23With the exception of FA, our CVs
across scanners within white matter are similar to those re-ported in these other studies.22,23Our higher CV for FA may relate to inclusion of a broad spectrum of FA values, whereas previous studies focused only on highly organized white mat-ter regions, which have high FA values.
Our results are in agreement with a recent small study re-porting greater homogeneity in corpus callosum FA and⬜ values compared with储and mean diffusivity across different
centers.11The authors’ observations were based on the
com-parison of 5 subjects on 2 Siemens scanners. Our experimental design expanded these observations by including the plat-forms of 2 different manufacturers in 5 different centers. Fur-thermore, in the same analysis, we have incorporated a longi-tudinal study and software upgrade, a situation that closely mimics real-life scenarios. We have also not limited our anal-ysis to the corpus callosum (high anisotropic region) alone but included other areas of the brain with a diverse range of aniso-tropic properties. A second study,12 which compared both
scan-rescan and intercenter reliability, also validated the ho-mogeneity of FA values. As with the previous one, this study did not compare platforms from different manufacturers, and the authors’ analysis was restricted to white matter regions of the brain.
A recent study that evaluated brain atrophy measurements in patients with MS, as estimated by 5 different centers, also reported an intercenter concordance value of 0.95 for the per-centage of brain volume change and 0.94 for normalized brain volume.24The concordance values for brain atrophy are very
similar to those observed in our analysis for DTI measures. Adequate characterization of variability among scanner plat-forms will prove important for multicenter DTI-based trials. Given a larger number of subjects, voxel-based methods such as those used by Takao et al25may prove to be more powerful. However, this study shows that even with a limited dataset, it is possible to assess the reproducibility of diffusion tensor mea-sures across a number of platforms.
Conclusions
We have observed strong correlations in DTI measures from different magnets and different manufacturers, with the stron-gest correlation observed with FA, followed by⬜, and储.
Despite significant pulse sequence differences between plat-forms, DTI values appeared to vary little between platforms. In scan-rescan comparisons on the same magnet, we have found excellent correlations in all DTI values. Our study provides strong evidence for the feasibility of multicentered DTI studies by using a 3T MR imaging and a high-angular-resolution pulse sequence.
Disclosures: Robert Fox—UNRELATED:Consultancy: Biogen Idec, Genentech, Novartis,
Biogen Idec, Pfizer, Genzyme, Wyeth;Grants/Grants Pending: Biogen Idec,* Genzyme,* Wyeth;*Payment for Lectures (including service on Speaker Bureaus): Biogen Idec, Teva. *Money paid to the institution.
References
1. Basser PJ, Pierpaoli C.Microstructural and physiological features of tissues elucidated by quantitative-diffusion-tensor MRI.J Magn Reson1996;111: 209 –19
2. Fox RJ.Picturing multiple sclerosis: conventional and diffusion tensor imag-ing.Semin Neurol2008;28:453– 66
3. Cassol E, Ranjeva JP, Ibarrola D, et al.Diffusion tensor imaging in multiple sclerosis: a tool for monitoring changes in normal-appearing white matter.
Mult Scler2004;10:188 –96
4. Ge Y, Law M, Grossman RI.Applications of diffusion tensor MR imaging in multiple sclerosis.Ann N Y Acad Sci2005;1064:202–19
5. Pierpaoli C, Basser PJ.Toward a quantitative assessment of diffusion anisot-ropy.Magn Reson Med1996;36:893–906
6. Bammer R, Augustin M, Strasser-Fuchs S, et al.Magnetic resonance diffusion tensor imaging for characterizing diffuse and focal white matter abnormali-ties in multiple sclerosis.Magn Reson Med2000;44:583–91
7. Werring DJ, Clark CA, Barker GJ, et al.Diffusion tensor imaging of lesions and normal-appearing white matter in multiple sclerosis.Neurology1999;52: 1626 –32
8. Filippi M, Iannucci G, Cercignani M, et al.A quantitative study of water diffu-sion in multiple sclerosis lediffu-sions and normal-appearing white matter using echo-planar imaging.Arch Neurol2000;57:1017–21
9. Ciccarelli O, Werring DJ, Wheeler-Kingshott CA, et al.Investigation of MS normal-appearing brain using diffusion tensor MRI with clinical correla-tions.Neurology2001;56:926 –33
10. Maldjian JA, Grossman RI.Future applications of DWI in MS.J Neurol. Sci
2001;186(suppl 1):S55–57
11. Pagani E, Hirsch JG, Pouwels PJ, et al.Intercenter differences in diffusion tensor MRI acquisition.J Magn Reson Imaging2010;31:1458 – 68
12. Vollmar C, O’Muircheartaigh J, Barker GJ, et al.Identical, but not the same:
intra-site and inter-site reproducibility of fractional anisotropy measures on two 3.0T scanners.Neuroimage2010;51:1384 –94
13. Besl PJ, McKay ND.A method for registration of 3-D shapes.IEEE Trans Pat-tern Analysis1992;14:239 –56
14. Basser PJ, Mattiello J, LeBihan D.Estimation of the effective self-diffusion tensor from the NMR spin echo.J Magn Reson B1994;103:247–54
15. Press WH.Numerical Recipes in C: The Art of Scientific Computing.2nd ed., New York: Cambridge University Press; 1992
16. Lin LI-K.A note on the concordance correlation coefficient.Biometrics2000; 56:324 –25
17. Jones DK.The effect of gradient sampling schemes on measures derived from diffusion tensor MRI: a Monte Carlo study.Magn Reson Med2004;51:807–15 18. Fox RJ, Cronin T, Lin J, et al.Measuring myelin repair and axonal loss with diffusion tensor imaging.AJNR Am J Neuroradiol2010;32:85–91. Epub 2010 Oct 14
19. Oouchi H, Yamada K, Sakai K, et al.Diffusion anisotropy measurement of brain white matter is affected by voxel size: underestimation occurs in areas with crossing fibers.AJNR Am J Neuroradiol2007;28:1102– 06
20. Bisdas S, Bohning DE, Besenski N, et al.Reproducibility, interrater agreement, and age-related changes of fractional anisotropy measures at 3T in healthy subjects: effect of the applied b-value.AJNR Am J Neuroradiol2008;29:1128 –33 21. Jansen JF, Kooi ME, Kessels AG, et al.Reproducibility of quantitative cerebral
T2 relaxometry, diffusion tensor imaging, and 1H magnetic resonance spec-troscopy at 3.0 Tesla.Invest Radiol2007;42:327–37
22. Heiervang E, Behrens TE, Mackay CE, et al.Between session reproducibility and between subject variability of diffusion MR and tractography measures.
Neuroimage2006;33:867–77
23. Pfefferbaum A, Adalsteinsson E, Sullivan EV.Replicability of diffusion tensor imaging measurements of fractional anisotropy and trace in brain.J Magn Reson Imaging2003;18:427–33
24. Jasperse B, Valsasina P, Neacsu V, et al.Intercenter agreement of brain atrophy measurement in multiple sclerosis patients using manually-edited SIENA and SIENAX.J Magn Reson Imaging2007;26:881– 85