UNIVERSITEIT
TWENTE
Faculty Behavioural Sciences
Master Psychology
Instruction, learning and development
Drawing based modeling and
simulating in primary school
science education
Bibian Rosink
S1116118
University of Twente
21-08-2012
Abstract
Forty-three eight graders of two intact classrooms of one elementary school participated in a
study investigating the extent to which simulating learner created drawings are effective
towards the acquisition of domain knowledge, attitude towards science, scientific attitude and
self-efficacy in science. Students used SimSketch to model a part of the solar system as a
drawing. In the control group students only drew; in the experimental group it was possible to
simulate the drawings of the solar system. Domain knowledge, attitude towards science,
scientific attitude and self-efficacy were measured. The study showed a positive trend towards
above variables between pre- and post-tests and differences between the scores of the control-
and experimental group. Only scientific attitude showed a significant improvement between
the pre- and post-test. Furthermore, children sometimes showed some misconceptions
regarding the solar system. On the whole, the experiences of children working with
1. Introduction
1.1 Science in primary schools
Good science education at primary schools is very important. Current research would
suggest that there are four shared rationales for science education. First, the economic
argument entails the view that we must ensure an adequate supply of scientifically trained
individuals to sustain and develop an advanced industrial society. The second argument, the
utilitarian argument concerns the view that knowledge of science is practically useful to
everyone. Third, the cultural argument concerns that science and technology are one, if not
the greatest, achievement of contemporary society, and that knowledge thereof is an essential
prerequisite for the educated individual. Finally, the democratic argument states that many of
the political and moral dilemmas posed by contemporary society are of a scientific nature and
educated citizens need a minimum of scientific knowledge to participate in debate about such
dilemmas (Osborne & Hennessy, 2003).
The economic argument is most frequently presented in the theory. Also Kind, Jones and
Barmby (2007), believed the main problem is a gap between needs and reality for the
discipline of science. The reality is a falling number of students choosing to follow the study
of science. There is mounting evidence of a decline in the interest of young people in pursuing
scientific careers (Smither & Robinson, 1988). This problem is a worry for governments all
over the world and questions have been raised about what should be done to increase
students’ interest in science.
The primary school curriculum ensures students a basic level of science gain. Besides
learning the contents of the domain, it is important that students have a positive attitude
towards science and gain insight into how science works. Developing a positive attitude
towards technology is important because the chance of choosing a technical or scientific
discipline in secondary education will increase. Even if a child does not make the choice of
further technical education, a positive attitude plays an important role in the pleasure
experienced in science (Dawson, 2000).
Therefore teachers need to develop an educational environment that emphasizes
understanding about memorization, inquiry learning, creating positive beliefs and attitudes
towards science and learning and allowing students some control over their learning. This can
be designed in different ways. In the current study, we implemented the method of
The theory is called “Experiential Learning” to underline the central role that experience
played in the learning process. The term “experiential” is used therefore to differentiate
experiential learning from cognitive learning theories, which tend to emphasize cognition
over affect, and behavioral learning theories that deny any role for subjective experience in
the learning process. Experiential learning theory defines learning as "the process whereby
knowledge is created through the transformation of experience. Knowledge results from the
combination of grasping and transforming experience" (Kolb 1984, p. 41). The Experiential
Learning Theory has been generally accepted as a useful framework for learning centered
educational innovation, including instructional design, curriculum development and life-long
learning.
In this study an example of experiential learning will be used namely, modeling and simulating of drawings. In this way students are actively engaged with the material and gain
more insight into how a phenomenon works.
1.2 Modeling in science education
Within science education modeling is an important way to implement experiential
learning. Researchers have presented models and the process of scientific modeling as core
components of science education because the heart of learning in science is the construction
and use of models of natural phenomena (Justi & Gilbert, 2002; Redish & Wilson, 1993;
Sherin, 1996; White & Frederiksen, 1998; Wilensky & Resnick, 1999). Science is the practice
of trying to make sense of the world around us.
According to Mayer (2011), there are different modes of models/modeling in learning and
teaching. First, you can learn with models; the second mode includes learning to model and
the third concerns learning by modeling. In this study we investigated learning by modeling.
This is the case that combines learning with and to model(s) to gain deeper insights in
complex phenomena by active participation in constructive processes. The focus of this study
is on the phenomenon ‘solar system’.
In different studies, like social studies, recommendations are offered for using drawings to
direct learners’ attention to illustrations, stimulate the use of imagery and visualization, and
increase content area knowledge (van Meter & Garner, 2005). The visual qualities of a model
are useful in making an explanation better understood and more easily remembered. It can
also contribute to the understanding of it and it can help the modeler think more deeply about
the domain (Sins, van Joolingen, Savelsbergh & van Hout-Wolters, 2007). Physical models
The most promising educational modeling tools that appear in literature are
computer-based (Kurtz dos Santos & Ogborn, 1994: Louca, 2004; Redish & Wilson, 1993; Sherin,
1996; White & Fredriksen, 1998; Wilensky & Resnick, 1999). The argument is made that
such tools allow students to use their current knowledge to express and construct their own
models (Penner, 2001).
Krajcik and Sutherland (2010) found in their research that the ability to make sense of
models, maps, diagrams, simulations and graphs is an important aspect of developing literacy
in science because many scientific ideas are very complex. In computer modeling, students
create their own executable external representations of a domain or subject.
1.3 Simulating in science education
Computer-based modeling can be a tool for students to understand their own way of
thinking (Doerr, 1995). Through modeling students can look at a dynamic simulation of their
own mental models, giving them insight in complex phenomena, helping them to coordinate
and integrate facts and scientific theory (Hestenes, 1987), and giving them a more integrated
and coherent view of science (Doerr, 1995; Hestenes, 1987).
Findings of research of Smetana and Bell (2012) suggest that simulations can be as
effective, and in many ways more effective, than traditional (i.e. lecture-based,
textbook-based) instructional practices in promoting science content knowledge, developing process
skills, and enabling conceptual change.
Computer simulations have the potential to make instruction more interactive and
authentic and make learning abstract concepts more concrete (Ramasundarm, Grunwald,
Mangeot, Comerford, & Bliss, 2005). They allow students to confront their own beliefs by
working with and receiving immediate feedback about and making personalized
problem-solving decisions (Lee, 1999; Rose & Meyer, 2002). This high degree of openness provides
students ownership of the learning process.
Simulations are valuable tools for exploring domain-specific topics. For example, White
(1993) developed a series of micro world simulations that support students' thinking about
such Newtonian concepts such as force and motion. These simulations have proven to be
powerful means for helping students develop sophisticated conceptual models.
Additionally, Marbach-Ad, Rotbain and Stavy (2008) compared the effectiveness of
computer simulations, textbook illustration activities and traditional lectures in contributing to
student achievement in molecular genetics. Multiple-choice assessment results indicated that
Further results from an open-ended questionnaire, indicated that the simulation group scored
significantly higher than both other groups. Also studies of Hounshell and Hill; Lazarowitz
and Huppert (as cited in Smetana & Bell, 2012), showed higher academic achievement
associated with the use of Computer Assisted Learning (CAL).
One of the main factors in learning science is the attitude of the students. The development
of positive attitudes toward science can motivate students’ interest in science education and
careers in science, Carey & Shavelson; Keeves; Norwich & Duncan (as cited in George,
2006).
As said before, simulations and modeling programs have a role to play in science
education. It does not only affect achievement but it can also play an important role in attitude
with respect to science. Learning has an affective component and developing positive
attitudes is important for students’ achievement (Kind et al., 2007). Results from different
research offered little support for any strong relationship between attitude and achievement.
However, he also cites studies that show no relationship (Gardner, 1975).
Attitude was traditionally seen as one of the main drivers in many processes related to
motivation and interest. An early notable influence towards its elaboration was made by
Klopfer (as cited in Osborne, 2003), who categorized a set of affective behaviors in science
education as:
the manifestation of favorable attitudes towards science and scientists;
the acceptance of scientific enquiry as a way of thought;
the adoption of ‘scientific attitudes’;
the enjoyment of science learning experiences;
the development of interests in science and science-related activities; and
the development of an interest in pursuing a career in science or science related work. Further clarity emerged with the drawing of a fundamental and basic distinction by
Gardner (1975) between ‘attitudes towards science’ and ‘scientific attitudes’. The latter were
in essence the features that might be said to characterize scientific thinking and are cognitive
in nature. ‘Scientific attitudes’ included constructs as rationality, curiosity, open-mindedness
and aversion to superstition (Billeh & Zakhariades, 1975). ’Attitudes towards science’, are the
feelings, beliefs and values held about an object that may be the enterprise of science, school
science, the impact of science on society or scientists themselves (Gardner, 1975; Osborne,
2003; Walma van der Molen, van Aalderen-Smeets & Asma, 2011).
Kiboss, Ndirangu and Wekesa (2004), conducted a study in the field of cell theory, in
experimental group through computer simulation activities. This study showed that students’
involvement in the computer simulation learning activities contributed to the effectiveness of
computer simulations in promoting secondary students’ academic achievement and positive
attitudes toward learning cell theory as compared to the control group.
In addition to an understandig of students’ attitude toward learning, measures of
self-efficacy have been determined to be very useful in measuring the value of teaching and
learning. Bandura (1977) defined ‘‘self-efficacy’’ as the belief that one can successfully
perform certain behaviors, such as graphing data. As such, self-efficacy is a belief in one’s
abilities to accomplish a task, not a measure of those abilities. Self-efficacy mediates
behavior, and it also affects outcomes. Students with higher self-efficacy in a particular
subject perform better and are more likely to be interested in a career in that field (Pajares,
1997).
Barab and Dede (2007), investigated the relationship between self-efficacy and data
gathering behaviors. Results suggest that collaborative simulations may act as a catalyst for
change in students’ self-efficacy and learning processes.
Baker and White (2003), investegated the effort that was formed to quantitatively measure
the impact on students’ attitude, self-efficacy and achievement. The control group used a
problem based learning (PBL) science unit with paper mapping to support data analysis
activities, wile the experimental group used a PBL-GIS model. The results of this study
showed positive and significant increases in science self-efficacy and technology attitudes,
compared to students in the controlgroup.
1.4 Current study
This study refers to the effect of simulating on domain knowledge, attitude and
self-efficacy of primary school children. The simulating task relates to the solar system. In
addition it is also important to discuss the role of existing misconceptions of the solar system,
because these misconceptions caused an effect on the process of modeling and simulating.
Previous research is done by Vosniadou and Brewer (1994), they investigated elementary
school children’s explanations of the day/night cycle. First, third, and fifth grade children
were asked to explain certain phenomena, such as the disappearance of the sun during the
night, the apparent movement of the moon, the disappearance of stars during the day and the
alteration of day and night.
The results, related to the day/night cycle, showed that children thought the sun is out in
stars are in the sky during the night, but not during the day. Most young children are not
aware that the moon is sometimes present in the day sky. Many children derive the beliefs that
day is caused by the appearance of the sun and the disappearance of the moon and stars; and
that night is caused by the disappearance of the sun and the appearance of the moon and stars.
If the sun is conceptualized as stationary, children can hypothesize that something else (e.g.,
clouds, moon, darkness etc.) comes and covers it up. Other misconceptions that emerged from
this study is that the sun moves around the earth, the sun goes behind the mountains and the
sun switches off at night.
This study also examines the misconceptions that emerged from the multiple-choice test
and the drawings. In addition, the drawings were analyzed and the quality of the drawings was
assessed. The majority of the study is quantitative in nature and will now be discussed.
The main purpose of this research was to understand the effectiveness of modeling and
simulating drawings on domain knowledge, scientific attitude, attitude towards science and
self-efficacy towards science.
The main question that this study tries to answer is; To what extent is simulating drawings
effective towards the acquisition of domain knowledge, attitude towards science, scientific
attitude and self-efficacy in science? To answer this main question several hypotheses were
prepared, which will be discussed below.
“Simulating drawings leads to more domain knowledge of science than not using simulating drawings.”
Following the results of the study of Marbach-Ad et al; Hounshell and Hill; Lazarowitz
and Huppert (as cited in Smetana & Bell, 2012), it is expected that simulating drawings was
more effective than just the modeling of drawings because students obtain a better
understanding. Simulating drawings gives an extra dimension to the learning process beyond
the modeling of drawings. Based on above literature it was supposed that scores on the
domain knowledge post-test of the experimental group were higher than the average scores of
students in the control group.
“Simulating drawings leads to a more positive scientific attitude, attitude towards science
and higher self-efficacy than not simulating drawings.”
Literature showed that learning had an affective component and that developing positive
attitudes is important for students’ achievement (Kind et al. 2007). It was expected that
children enjoy working with SimSketch. Therefore it was assumed that a positive experience
Research of Kiboss et al. (2004) had shown that students’ involvement in the computer
simulation learning activities contributed to the effectiveness of computer simulations in
promoting secondary students’ academic achievement and positive attitudes toward learning
cell theory. Therefore it was assumed that a positive experience with science leads to a more
positive attitude towards science.
Following the results of the study of Baker and White (2003) which pointed out that the
PBL-GIS treatment positively affected student science self-efficacy, it was expected that
simulating drawings leads to a higher self-efficacy towards science. Therefore it was assumed
2. Method
2.1 Participants
A total of 43 eight graders (26 boys and 17 girls) of two intact classrooms of one
elementary school participated in this study. All of the 43 participants completed the pre-tests,
experiment and post-tests. The age of the participants ranged from a minimum of eleven years
and three months to a maximum of thirteen years and three months, the average was eleven
years and ten months (SD= 25,09 month). The children were recruited from an elementary
school in Almelo.
2.2 Measurements
This study concerns a pretest-posttest design. Four tests conducted prior to the experiment
and five tests after the experiment. The questions of the pre-tests were the same as the
post-tests. These questions concerned domain knowledge of the solar system, attitude towards
science, scientific attitude and self-efficacy of children towards science, these were the
dependent variables of the study. Just listed variables were measured using a paper
questionnaire. First, the positions about self-efficacy, attitude towards science and scientific
attitude were presented and then questions about the solar system. A bad experience with the
multiple-choice test on the solar system, could affect the answers on self-efficacy and attitude
tests. Besides in the post-test some questions were asked about their opinion of working with
SimSketch.
The domain knowledge questions consisted of eleven multiple-choice questions. All
aspects of the attitude towards science, scientific attitude, self-efficacy and their opinion of
working with SimSketch were measured using different positions in which pupils were asked
to express their views on a scale ranging from 1 to 4 (1 = strongly disagree, 2 = disagree, 3 =
agree, 4 = completely agree). Chosen is to work with a four point scale instead of a five point
scale, because research of Enochs and Riggs (1990), showed that the middle response
‘uncertain’ is conceptually different from a middle response option between agree and
disagree. This response could also indicate that the respondent does not understand the
statement, is not sure about what to answer, or has no opinion on the topic.
The questionnaire and the experiment were developed through extensive pilot work. In
collaboration with the supervisor(s) an instruction was made to create a drawing set.
Following this, a pilot study took place with about five children and as a result of this,
2.2.1 Domain knowledge test
The students were pre- and post-tested of their knowledge about the solar system. These
consisted of eleven multiple-choice questions about the solar system. After the experiment
both the experimental- and control group received the multiple-choice questions again. All
participants completed the same knowledge test. For the pre-test and the post-test data of the
multiple-choice questions, the total possible score was eleven. The original questionnaire is
included in Appendix A. The multiple-choice questions in this study were based on the
questions in the study of Vosniadou and Brewer (1994).
2.2.2 Attitude towards science test
In the present study, we developed and used attitude scales to measure pupils’ attitudes
towards science. This study focused primarily on the attitudes towards the solar system
instead of science in general. A major justification for using an attitude scale is the use of
more than one question to measure the same construct to increase reliability, Gardner (as cited
in Kind et al 2007). The positions about attitude towards science in this study were based on
the questions in the study of Francis and Greer, 1999; Kind et al. 2007; Walma van der
Molen, 2007.
The children were pre- and post-tested on their attitude towards science. Examples of
positions about attitude towards science were; ’I think the solar system is interesting’ and ‘I think it is important that all children learn something about the solar system’. Seven items measuring attitude towards science. The Cronbach’s alpha of the pretest was 0.784 and the
alpha of the post-test 0.735. The total possible score for attitude towards science was
twenty-eight. The original positions of the ‘attitude towards science’ test are included in Appendix B.
2.2.3 Scientific attitude test
The participants of this study were pre- and post-tested on their scientific attitude.
Examples of positions about scientific attitude were; ‘I'm curious about things I do not know’
and ‘I like to think of new things’. Six items measuring scientific attitude. The Cronbach’s
alpha of the pretest was 0.689 and the Cronbach’s alpha of the post-test was 0.778. Both the
pre- and post-test of scientific attitude had a total possible score of twenty-four. For
measuring the attitude of individual pupils, items of the test were adapted from the research of
Kind et al. 2007; Walma van der Molen, 2007. The original positions of the scientific attitude
2.2.4 Self-efficacy test
The students were pre- and post-tested on their self-efficacy. This test consists of six
positions about their self-efficacy towards science. For measuring self-efficacy of individual
pupils, items were based on research of Kind et al. 2007; Walma van der Molen, 2007.
Examples of positions about self-efficacy were; ‘If I find a school assignment difficult,
then I can often think of something to solve it’ and ‘I'm good at solving school assignments’.
Six items measuring self-efficacy. The Cronbach’s alpha of the pretest was 0.658 and the
Cronbach’s alpha of the post-test was 0.689. For the pretest and the post-test data of
efficacy positions, the total possible score was twenty-four. The original positions of
self-efficacy are included in Appendix D.
2.2.5 Opinion of working with SimSketch test
In the post-test a number of positions were asked regarding their opinion about working
with the software. The scale consisted of seven statements. Examples of positions about their
opinion with the software were; ‘I liked it to work with the computer program’ and ‘The use
of a drawing (model) has helped me to better understand our solar system’. Seven items
measuring children’s opinion about working with Simsketch. The Cronbach’s alpha of the
post-test was 0.721. For the post-test data of their opinion about working with SimSketch, the
total possible score was twenty-eight. The original positions are included in Appendix E.
2.2.6 Activity with Simsketch
The experiment was performed using SimSketch (van Joolingen, 2010). This is software
that combines drawing, modeling and simulation features. The user can draw objects, assign
behaviors and watch the system being simulated. SimSketch allows students to make
drawings of phenomena, behavior attributable to the elements in the drawing and
subsequently simulate the drawing. The children in the control- and experimental group
received the same drawing-tasks.
They had to make a drawing concerning the 'solar system'. The control group had only
drawn the solar system and showed the movement of sun, moon, earth and planets by arrows
and/or words and shows how the solar- and lunar eclipse works. The experimental group
could simulate the drawing of the solar system and the solar- and lunar eclipse.
The drawings were stored in the system and were subsequently evaluated at certain points.
From the log files we extracted all models the students made in the course of the task, and all
the coding scheme was used to evaluate the inclusion of main points in the drawing. The total
possible score for the drawing-exercise was ten points. The original drawing-task is included
in Appendix F.
2.3 Design and procedure
As mentioned before, this study involved an experimental study that was organized in a
pretest-posttest design. The pre- and post-tests were identical and were given to the students
of both the experimental and control group a week before the beginning of the instructional
period and immediately after the experiment. Both the pre- and post-tests took about 15
minutes to complete. There was also a post-test for measuring the opinion of children of
working with SimSketch.
The students were randomly assigned to the experimental- or control group. Twenty-one
children were assigned to the experimental group and twenty-two to the control group. In the
experiment the students participated during regular school time. Participation was therefore
obligatory. This experiment was carried out in groups of eight children.
The experiment was carried out in a separate room, where individual worked without being
disturbed. The experiment per student lasted about 30 minutes. The students worked
individually on the task and were told not to communicate with other students about the
contents and their findings. The experiment leader briefly introduced herself and the study to
the children. The experiment leader also introduced the domain and asked the students to start
with the drawing test. After completing the experiment, the participants started with the
3. Results
3.1 Data analyses
The data were analyzed using SPSS. First the reliability of the constructs was analyzed
using Cronbach’s alpha. Based on this, items with low reliability were removed. Second a
t-test was performed to see if there are no significant differences between the experimental and
control group on the pre-test. The analysis showed that only a significant difference existed in
the scientific attitude test, not in the other tests. The results of scientific attitude should
therefore be seen in this light.
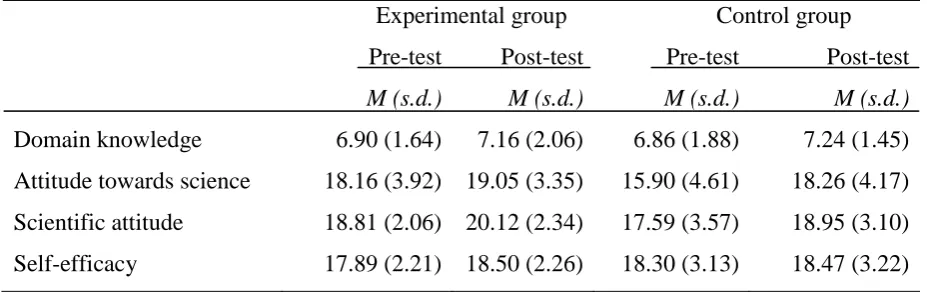
For the analysis of the data, an overall “repeated measures” is used to analyze these data
since it takes into account possible correlations among the four dependent variables. The
study showed a positive trend towards above variables between pre- and post-tests and
showed differences between the scores of the control- and experimental group (table 1). Only
scientific attitude showed a significant improvement between the pre- and post-test (p=0.018).
Neither a significant multivariate effect, indicating differences between the two groups (i.e.,
drawing vs. simulating). The children made no significant learning gains by participating in
the simulation-based learning environment. Furthermore no significant difference was found
[image:14.595.64.528.509.655.2]between boys and girls.
Table 1:
Group means (M) and standard deviations (SD) of pre-test and post-test scores of the experimental- and control group on the dependent variables
Experimental group Control group
Pre-test Post-test Pre-test Post-test
M (s.d.) M (s.d.) M (s.d.) M (s.d.)
Domain knowledge 6.90 (1.64) 7.16 (2.06) 6.86 (1.88) 7.24 (1.45)
Attitude towards science 18.16 (3.92) 19.05 (3.35) 15.90 (4.61) 18.26 (4.17)
Scientific attitude 18.81 (2.06) 20.12 (2.34) 17.59 (3.57) 18.95 (3.10)
Self-efficacy 17.89 (2.21) 18.50 (2.26) 18.30 (3.13) 18.47 (3.22)
3.2 Misconceptions
The analysis of the answers of the multiple-choice test showed that children had certain
misconceptions regarding the 'solar system'. Below most of the wrong answers were
believed that the earth orbits around the moon, seven children thought that the moon and the
sun rotates around the earth and two children believed that the earth orbits around nothing but
that the sun orbits around the earth.
The second part dealt with the misconceptions of the sun. Twenty-nine children knew that
the sun orbits around something else in the solar system. Nine children thought the sun is
behind the moon at night. Also, twenty-nine children gave the correct answer to the question
how the solar eclipse works, however, thirteen children thought that there is another planet
exactly between the earth and the sun and the shadow of the planet falls over the sun.
Finally they had some misconceptions about the moon. Eight children thought that the
moon orbits around the sun. Answering the question; ‘Where is the moon during the day?’
Nine children gave the right answer, twenty-four children, however, thought the moon is on
the other side of the earth during the day. In addition, only eighteen children knew how the
lunar eclipse works. Nine children believed that the lunar eclipse is caused by a planet
between the sun and moon, and that the shadow of the planet falls over the moon. Fifteen
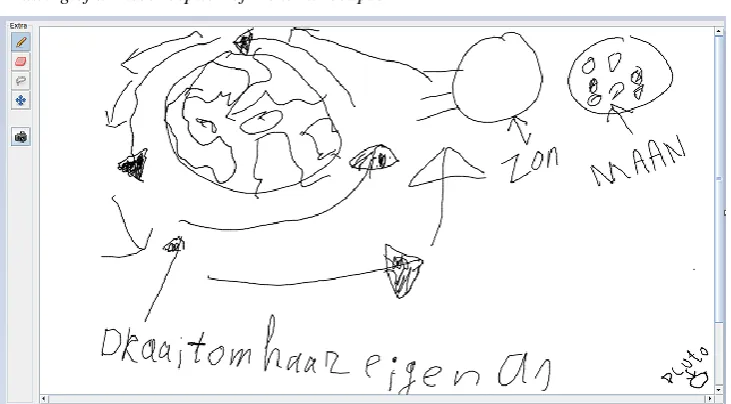
children thought the moon disappears behind the sun. In the drawings, this was also
[image:15.595.71.437.449.651.2]highlighted. Below a drawing of a misconception is shown, explaining the lunar eclipse.
Figure 1
Drawing of a misconception of the lunar eclipse
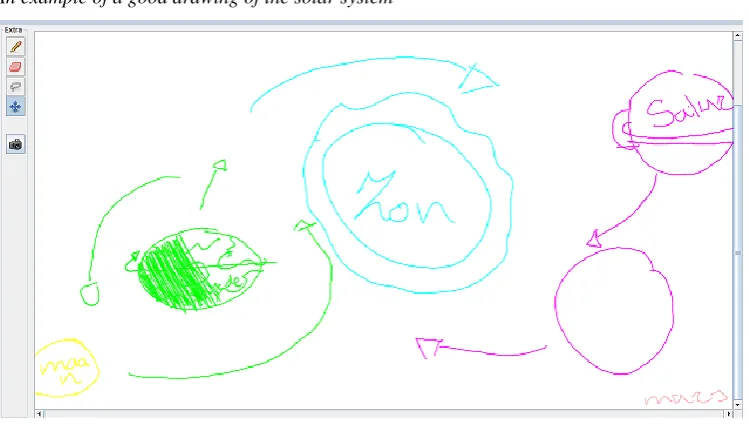
3.3 Review of drawings
The maximum possible score on the drawings were ten points. The experimental group had
a M of 6.14 with a SD of 1.15 and the control group a M of 6.95 and a SD of 1.25, no
children had drawn the sun, moon and earth. However it is striking that in both conditions,
few children indicated that the earth orbits around the sun, only 33.33% of the children of the
experimental group and 45.45% of the control group. Even fewer children indicated that other
planets orbit around the sun. Less than half of the children indicated that the moon orbits
around the earth.
Only 33.33% of the experimental group and 68.18% of the control group indicated that the
earth rotates around axis. More than 75% of children in both conditions showed correctly how
the solar eclipse works. In addition 50% of control group and 76.19% of experimental group
[image:16.595.74.449.299.513.2]showed correctly how the lunar eclipse works.
Figure 2
An example of a good drawing of the solar system
A complete overview of the scores on the drawings can be found in Appendix G. Three
striking misconceptions in the drawings showed that five children indicated that the sun orbits
around the earth and four children believed that the moon orbits around the sun. Besides,
seven children made a drawing of the lunar eclipse, in which the sun covered the moon.
3.4 Opinion of children of working with SimSketch
The observations showed that children working with SimSketch experienced it as really
nice. Drawing on a tablet was special for many children. Even the control group, who only
drew, were all excited. Furthermore the experimental group found it very interesting to see
how the drawings were moving. When they saw that it was not moving as they had intended,
these data. However, no significant differences were found between the control- and
experimental group in the post-test.
The maximum score for each proposition was four points. There were seven positions, so
they could achieve up to twenty-eight points. The average total score was 21.14 with a SD of
3.63. This means that the children have usually experienced it as very nice, given the high
score. In the statement, 'I liked to see how the drawings were moving’ there was an M of 3.76
with a SD of 0.44. In addition by the statement: "I enjoyed working with the computer
program' an M of 3.59 with a SD of 0.74. This means that the average scores are between
'agree' and 'completely agree'. A complete overview of the M-scores and SD-scores in relation
4. Conclusion and discussion
4.1 Conclusion
The main goal of this study was to investigate the effect of simulating on domain
knowledge, attitude towards science, scientific attitude and self-efficacy. Based on above the
main research question and hypothesis had been formulated. By answering these hypotheses,
the main research question could be answered.
With respect to the first hypothesis, namely; “Simulating drawings leads to more domain
knowledge of science than not simulating drawings.” was found a non-significant result. This
research had not demonstrated that simulating drawings leads to higher domain knowledge.
These findings are therefore not consistent with previous studies like; Marbach-Ad et al.
(2008), which demonstrated that modeling and/or simulating contributes to increased learning
gains. Furthermore these findings are not consistent with results of the study of Kiboss et al.
(2004) they suggest that involvement in computer simulation learning activities promotes
academic achievement. Besides findings of research of Smetana and Bell (2011) suggest that
simulations can be as effective, and in many ways more effective, than traditional
instructional practices in promoting science content knowledge. Finally, studies of Hounshell
and Hill; Lazarowitz and Huppert (as cited in Smetana & Bell, 2012), showed higher
academic achievement associated with the use of simulations.
However, the misconceptions of children were similar to the explanations identified in
previous research of Vosniadou and Brewer (1994). The results of this study showed
misconceptions with respect to the movement of the sun, moon and earth, and also of the
day/night cycle. Furthermore there were misconceptions with respect to the lunar eclipse and
the solar eclipse.
With respect to the second hypothesis, namely; “Simulating drawings leads to a more
positive scientific attitude, attitude towards science and higher self-efficacy than not
simulating drawings”, no significant effect was found either. This is in contradiction to
research of Kiboss et al. (2004), they showed that computer simulations promoted a positive
attitude towards learning cell theory. This study showed that there is no significant difference
in the scores on self-efficacy between the experimental- and control group. This is in
contradiction to the results of Baker and White (2003) which pointed out that the PBL-GIS
treatment positively affected student science self-efficacy. Furthermore, research of Barab and
Dede (2007) showed that collaborative simulations may act as a catalyst for change in
The main research question was; “To what extent is simulating drawings effective towards
the acquisition of domain knowledge, attitude towards science, scientific attitude and
self-efficacy in science?” The main conclusion is that in this study simulating drawings had no
positive effect on domain knowledge, scientific attitude, attitude towards science and
self-efficacy. The analyses showed a positive trend between the pre- and post-test and also
between the conditions. However, no significant trend was obtained. To further clarify the
effects of simulating drawings more research had to be done. In the next section,
recommendations are given.
4.2 Discussion
As a limitation of this study, it should first be noted that SimSketch did not work
optimally. There was an error in the system, because if the drawings had to be simulated than
the objects disappeared. As a result nine children of the twenty-one were not able to simulate
their drawings. As a consequence of this it could have led to a less positive experience with
SimSketch and this could also have influenced the answers given by the post-tests. Moreover,
because of the failure of the system it could not be traced if the children used the good ‘name
stickers’ and ‘behavior stickers’.
The above problem has also influenced the assessment of the drawings. The average score
of the control group was higher than the score of the experimental group; this was probably
caused by the failure of the system. It could not always be traced what they had drawn and
which behavior stickers they had joined to it, therefore they received fewer points. Besides it
was difficult to measure the drawings of the solar- and lunar eclipse. Children could save the
image by using the ‘camera button’. They were told to only press the button when they were
sure that it was the lunar- or solar eclipse. Though, several children pressed more than once.
This made it difficult to measure the images.
However, a follow-up study can be done in a similar way, but with an improved operating
system. In which the ‘behavior stickers’ and ‘name stickers’ worked well, the images do not
disappear when the drawing is simulated and that only one image can be stored using the
‘camera button’ instead of saving multiple images.
A second limitation concerns the importance of misconceptions regarding the solar system.
If children had some misconceptions, how are they adjusted? If they have misconceptions,
these are also reflected in the drawing and in the simulation. The results of this study raise the
question how these misconceptions can be tackled. Maybe this tool can be useful in other
A third limitation of this study regards a sample size of 43 participants, which is acceptable
but this can be improved in a future study. It might be possible that a larger sample results in
significant relationships for the relationships that are now close to significance. Furthermore,
when a larger sample size is used, the study will be more reliable and more generalizable.
Another limitation concerns the measurement of attitude towards science. Research of
Walma van der Molen (2007) showed that attitude towards science consists of many different
dimensions, such as; thoughts, feelings and behavior. This study focused explicitly on the
attitudes towards the solar system instead of science in general. However, further research is
recommended to measure all the dimensions; in order to get a more reliable measurement of
the construct ‘attitude towards science '.
Furthermore, modeling and simulating of drawings is very useful for complex phenomena. This study focused on the solar system but there are also other domains imaginable, for example
in the field of biology, biochemistry or geography. Besides, this study was conducted only
among students in the 8th grade of primary school, this also can be done in secondary education
or higher education in order to have more reliable results. SimSketch can made things clearer
and provide insight, this is regardless of age.
Finally, it was perhaps a bit too idealistic to expect that self-efficacy, attitude towards
science, and scientific attitude would change by an experiment which only lasted 30 minutes.
This could be improved by using the software for longer periods of time or working with
more assignments. However, whatever influences were involved, things did not seem to have
5. References
Baker, T.R., & White, S.H. (2003). The Effects of G.I.S. on Students’ Attitudes, Self-efficacy, and Achievement in Middle School Science Classrooms. Journal of Geography, 102, 243-254.
Bandura, A. (1977). Self-efficacy: Toward a unifying theory of behavioral change.
Psychological Review, 84, 191–215.
Barab, S., & Dede, C. (2007). Games and Immersive Participatory Simulations for Science Education: An Emerging Type of Curricula. Journal of Science Education and Technology, 16, 1-3.
Billeh, V.Y., & Zakhariades, G.A. (1975). The development and application of a scale for measuring scientific attitudes. Science Education, 59, 155-165.
Carey, N., & Shavelson, R. (1988). Outcomes, achievement, participation, and attitudes.
Indicators for monitoring mathematics and science education 147–191. Santa Monica, CA: Rand Corporation.
Dawson, C. (2000). Upper primary boys' and girls' interests in science: have they changed since 1980? International Journal of Science Education, 22, 557-570.
Doerr, H.M. (1995). An integrated approach to mathematical modeling: A classroom study. Paper presented at the Annual meeting of the American Educational Research Association, San Francisco, CA, April 18–22.
Enochs, L. G., & Riggs, I. M. (1990). Further development of an elementary science teaching efficacy belief instrument: A preservice elementary scale. School Science and Mathematics, 90, 694–706.
Francis, L.J., & Greer, J.E. (1999). Measuring Attitude Towards Science Among Secondary School Students: the affective domain. Research in Science & Technological Education, 17,
219-226.
Gardner, P. L. (1975). Attitudes to science: A review. Studies in Science Education, 2, 1–41.
Gardner, P. L. (1996). The dimensionality of attitude scales: A widely misunderstood idea.
International Journal of Science Education, 18, 913–919.
George, R. (2006). A Cross‐domain Analysis of Change in Students’ Attitudes toward Science and Attitudes about the Utility of Science. International Journal of Science Education, 28, 571-589
Hestenes, D. (1987). Towards a modeling theory of physics instruction. American Journal of Physics, 55, 440–454.
Justi, R. S., & Gilbert, J, K. (2002). Modelling, teachers’ views on the nature of modelling, and implications for the education of modellers. International Journal of Science Education, 24, 369-387.
Keeves, J. P. (1975). The home, the school, and achievement in mathematics and science.
Science Education, 59, 439–460.
Kiboss, J., Ndirangu, M., & Wekesa, E. (2004). Effectiveness of a computer-mediated simulations program in school biology on pupils’ learning outcomes in cell theory. Journal of Science Education and Technology, 13, 207–213.
Kind, P., Jones, K., & Barmby, P. (2007). Developing Attitudes towards Science Measures.
International Journal of Science Education, 29, 871-893.
Klopfer, L. E. (1971). Evaluation of Learning in Science. In B. S. Bloom, J. T. Hastings, & G. F. Madaus (Eds.), Handbook of Formative and Summative Evaluation of Student Learning. London: McGraw-Hill Book Company.
Kolb, D., A. (1984). Experiential learning: Experience as the source of learning and development. Englewood Cliffs, NJ: Prentice-Hall.
Krajcik, J.S., & Sutherland, L.M. (2010). Supporting Students in Developing Literacy in Science. Science, Language, and Literacy, 328-456.
Kurtz dos Santos A. C., & Ogborn J. (1994). Sixth form students’ ability to engage in computational modelling. Journal of Computer Assisted Learning 10, 182–200.
Lazarowitz, R., & Huppert, J. (1988). Computer assisted learning in biology; Student achievement by gender and cognitive operational levels. Computers in Education, 589–597.
Lee, J. (1999). Effectiveness of computer-based instructional simulation: a meta-analysis.
International Journal of Instructional Media, 26, 71–85.
Louca, L. (2004). Case studies of fifth-grade student modeling in science through programming: comparison of modeling practices and conversations. Unpublished doctoral dissertation, University of Maryland, College Park.
Marbach-Ad, G., Rotbain, Y., & Stavy, R. (2008). Using computer animation and illustration activities to improve high school students’ achievement in molecular genetics. Journal of Research in Science Teaching, 45, 273–292.
Mayer, R.E. 2011. Learning and Instruction (2nd ed.). Santa Barbara. Pearson Merrill Prentice Hall.
Osborne, J. (2003). King’s College London Sara Hennessy, University of Cambridge.
Literature Review in Science Education and the Role of ICT: Promise, Problems and Future Directions.
Osborne, J., Simon, S., & Collins, S. (2003). Attitudes towards science: A review of the literature and its implications. International Journal of Science Education, 25, 1049-1079.
Pajares, F. (1997). Current directions in self-efficacy research. Advances in Motivation and Achievement, 10, 1–49.
Penner, D, E. (2001). Cognition, Computers, and Synthetic Science: Building Knowledge and Meaning through Modeling. Review of Research in Education, 25, 1-35.
Ramasundarm, V., Grunwald, S., Mangeot, A., Comerford, N.B., & Bliss, C.M. (2005). Development of an environmental virtual field laboratory. Computers, 45, 21–34.
Redish, E. F., & Wilson, J. M. (1993). Student programming in the introductory physics course: M.U.P.P.E.T. American Journal of Physics, 61, 222-232.
Rose, D., & Meyer, A. (2002). Teaching every student in the digital age: Universal design for learning. Alexandria, VA: ASCD.
Sherin, B.L. (1996). The Symbolic Basis of Physical Intuition. A Study of Two Symbol Systems in Physics Instruction. Unpublished dissertation Thesis.
Sins, P.H.M., van Joolingen, W.R., Savelsbergh, E.R. & van Hout-Wolters, B. (2007). Motivation and performance within a collaborative computer-based modeling task: Relations between students’ achievement goal orientation, self-efficacy, cognitive processing, and achievement. Contemporary Educational Psychology, 33, 58-77.
Smetana, L.K., & Bell, R.L. (2012). Computer Simulations to Support Science Instruction and Learning: A critical review of the literature. International Journal of Science Education, 34,
1337-1370.
Smither, A., & Robinson, P. (1988). Technology in the national curriculum getting it right. Teaching Technology.
van Joolingen, W.R., Bollen, L. & Leenaars, F.A.J. (2010). Using Drawings in Knowledge Modeling and Simulation for Science Teaching. Studies in Computational Intelligence, 308,
249-264.
van Meter, P., & Garner, J. (2005). The Promise and Practice of Learner-Generated Drawing: Literature Review and Synthesis. Educational Psychology Review, 17, 285-325.
Vosniadou, S., & Brewer, W,F. (1994). Mental Models of the Day/Night Cycle. Cognitive science 18, 123-183.
Walma van der Molen, J. H., van Aalderen-Smeets, S. I., & Asma, L. J. F. (2011). Primary Teachers’ Attitudes Toward Science: A New Theoretical Framework. Science Education, 96,
158 – 182.
White, B. (1993). ThinkerTools: Causal models, conceptual change, and science education.
Cognition and Instruction 10, 1–100.
White, B.Y., & Frederiksen, J.R. (1998). Inquiry, modeling and metacognition: Making science accessible to all students. Cognition and Instruction 16, 3–118.
Appendix A: Domain knowledge test
MC-vragen
1. Waaruit bestaat ons zonnestelsel?
A. Alle sterren gezamenlijk.
B. Een zon met planeten die daar omheen draaien. C. Zon, maan en aarde.
D. Een aantal zonnen bij elkaar.
2. Wat is de aarde?
A. Een planeet. B. Een ster. C. Een maan. D. Een kleine zon.
3. Waar draait de aarde omheen?
A. De aarde draait om de zon heen. B. De aarde draait om de maan heen.
C. De aarde draait nergens omheen, maar de maan en zon draaien om de aarde. D. De aarde draait nergens omheen, maar de zon draait om de aarde.
4. Wat is de zon?
A. Een satelliet. B. Een planeet. C. Een maan. D. Een ster.
5. Waar draait de zon omheen?
A. De zon draait om de planeten heen. B. De zon draait om de aarde heen.
C. De zon draait samen met de maan om de aarde heen. D. De zon draait nergens omheen.
6. Waar is de zon ’s nachts?
A. De zon zit dan achter de maan.
B. De zon is dan aan de andere kant van de aarde. C. Wolken dekken de zon af.
D. De sterren staan dan voor de zon.
7. Hoe kan het dat de zon steeds op een andere plaats staat, gezien vanuit de aarde?
A. Omdat de aarde om haar eigen as draait. B. Omdat de zon beweegt.
8. Wat gebeurt er bij een zonsverduistering?
A. Dan verdwijnt de zon achter de wolken.
B. Een planeet staat dan precies tussen de aarde en de zon in, de schaduw van die planeet valt dan over de aarde heen.
C. De schaduw van de maan valt dan over de aarde heen, de maan staat dan precies tussen de aarde en de zon in.
D. Dan is de zon aan de andere kant van de aarde.
9. Waar draait de maan omheen?
A. De maan draait om de zon heen. B. De maan draait om de aarde heen.
C. De maan staat op een vaste plaats, het lijkt alsof hij beweegt omdat de aarde draait. D. De maan draait niet, maar gaat op en neer.
10.Waar is de maan overdag?
A. De maan zit dan achter de zon.
B. Je kunt de maan niet zien omdat het dan licht is. C. In de lucht, soms kun je de maan overdag zelfs zien. D. Aan de andere kant van de aarde.
11.Wat gebeurt er bij een maansverduistering?
A. Een planeet staat dan precies tussen de zon en maan in, de schaduw van die planeet valt dan op de maan.
B. Dan verdwijnt de maan achter de zon.
C. De aarde staat dan precies tussen de zon en maan in, de schaduw van de aarde valt dan op de maan.
Appendix B: Attitude towards science test
Helemaal niet mee eens
Niet mee eens
Mee eens
Helemaal mee eens
Ik vind het zonnestelstel interessant. 1 2 3 4
Ik vind het zonnestelsel ingewikkeld. 1 2 3 4
Ik wil weten hoe ons zonnestelsel in elkaar zit. 1 2 3 4
Ik vind het belangrijk dat alle kinderen wat over het zonnestelsel leren.
1 2 3 4
Ik denk dat de meeste kinderen het zonnestelsel ingewikkeld vinden.
1 2 3 4
Ik denk dat de meeste kinderen het zonnestelsel interessant vinden.
1 2 3 4
Ik vind het belangrijk dat er genoeg tijd wordt besteed aan het uitleggen van het zonnestelsel.
Appendix C: Scientific attitude test
Helemaal niet mee eens
Niet mee eens
Mee eens
Helemaal mee eens
Ik vind het leuk om nieuwe ideeën te bedenken. 1 2 3 4
Ik vind het leuk om over nieuwe onderwerpen te leren.
1 2 3 4
Ik vind het leuk om zelf dingen te onderzoeken. 1 2 3 4
Ik ben nieuwsgierig naar dingen die ik nog niet weet.
1 2 3 4
Ik verwonder me over dingen om me heen. 1 2 3 4
Als ik iets niet begrijp, dan ga ik door totdat ik het wel begrijp.
Appendix D: Self-efficacy test
Helemaal niet mee eens
Niet mee eens
Mee eens
Helemaal mee eens
Het lukt me meestal wel om een opdracht voor school goed op te lossen, als ik er genoeg moeite voor doe.
1 2 3 4
Als ik een schoolopdracht moeilijk vind, dan kan ik vaak wel iets bedenken om het op te lossen.
1 2 3 4
Ik vind dat ik een goede leerling ben. 1 2 3 4
Ik ben goed in het oplossen van schoolopdrachten. 1 2 3 4
Ook al vind ik een onderwerp op school moeilijk, uiteindelijk kan ik het wel leren.
1 2 3 4
Appendix E: Opinion of working with Simsketch
Helemaal niet mee eens
Niet mee eens
Mee eens
Helemaal mee eens
Ik heb al vaker gewerkt met dit soort computerprogramma’s.
1 2 3 4
Ik vond de opdracht interessant. 1 2 3 4
Ik vond het leuk om over ons zonnestelsel na te denken.
1 2 3 4
Ik vond het leuk om met het computerprogramma te werken.
1 2 3 4
Ik vond het moeilijk om met het computerprogramma te werken.
1 2 3 4
Ik denk dat ik de tekening over ons zonnestelsel goed heb gemaakt.
1 2 3 4
Het gebruik maken van een tekening (model) heeft mij geholpen om ons zonnestelsel beter te leren begrijpen.
Appendix F: Drawing exercise
Zonnestelsel
Wij leven met zijn allen op de aarde. Als we overdag naar buiten kijken dan zien we soms de zon. In de avond zien we geen zon meer, maar zien we soms een maan en sterren. De aarde, de zon en de maan bevinden zich allemaal in ons zonnestelsel. Ook heeft ons zonnestelsel nog een heleboel andere planeten.
1. Laat door middel van een tekening zien hoe ons zonnestelsel eruit ziet, teken hierbij in ieder geval de zon, aarde, maan en een andere planeet.
Zonsverduistering
Het kan gebeuren dat je de zon vanaf de aarde eventjes niet meer kunt zien. Dit noemen wij dan de zonsverduistering. Hieronder staat een plaatje van een zonsverduistering.
2. Kun je in de tekening aangeven wanneer zich een zonsverduistering voor kan doen. Zet het beeld stop wanneer er volgens jou sprake is van een zonsverduistering. Je kunt het beeld stop zetten door op de ‘fototoestel-knop’ te drukken.
‘Fototoestel-knop’
Maansverduistering
We hebben één keer in de zoveel tijd ook een maansverduistering, dan kun je de maan even niet meer zien. Hieronder staat een plaatje van een maansverduistering, de maan is hier nog net niet helemaal verduisterd.
3. Kun je in de tekening aangeven wanneer zich een maansverduistering voor kan doen.
Appendix G: Scores of the drawings
Experimental group Control group
% correct % correct
Earth 100% 100%
Sun 100% 100%
Moon 100% 100%
Other planet 66,67% 77,27%
Earth orbits around the sun 33,33% 45,45%
Other planet orbits around the sun 19,05% 18,18%
Moon orbits around the earth 38,10% 50,00%
Earth rotates around axis 33,33 % 68,18%
Sun eclipse 76,19% 95,45%
Appendix H: Overview of the M-scores and SD-scores in relation to their views about working with SimSketch
N Mean SD
Ik heb al vaker gewerkt met dit soort computerprogramma’s. 42 1.79 0.95 Ik vond de opdracht interessant. 41 3.51 0.68 Ik vond het leuk om over ons zonnestelsel na te denken. 41 3.34 0.76 Ik vond het leuk om met het computerprogramma te werken. 41 3.59 0.74 Ik vond het moeilijk om met het computerprogramma te werken 39 3.10 0.85 Het gebruik maken van een tekening (model) heeft mij geholpen om
ons zonnestelsel beter te leren begrijpen.
42 3.00 0.96