Abstract— In order to predict the durability of engineering components and improve performance, it is mandatory to understand residual stresses. The last decade has witnessed a significant increase of residual stress evaluation using diffraction of penetrating radiation, such as neutrons or high energy X-rays. They provide a powerful non-destructive method for determining the level of residual stresses in engineering components through precise characterisation of interplanar crystal lattice spacing. The unique non-destructive nature of these measurement techniques is particularly beneficial in the context of engineering design, since it allows the evaluation of a variety of structural and deformational parameters inside real components without material removal, or at worst with minimal interference. However, while most real engineering components have complex shape and are often large in size, leading to measurement and interpretation difficulties, since experimental facilities usually have limited space for mounting the sample, limited sample travel range, limited loading capacity of the sample positioning system, etc. Consequently, samples often have to be sectioned, requiring appropriate corrections on measured data; or facilities must be improved. Our research group has contributed to the development of engineering applications of high-energy X-ray diffraction methods for residual stress evaluation, both at synchrotron sources and in the lab setting, including multiple detector setup, large engineering component manipulation and measurement at the UK Synchrotron Radiation Source (SRS Daresbury), and in our lab at Oxford. A nickel base superally combustion casing and a large MIG welded Al alloy plate were successfully studied.
Index Terms— Aerospace engineering, eigenstrain, high energy X-ray diffraction, residual stress.
Manuscript received 22 March, 2007. This work was supported in part by the UK Department of Trade and Industry (DTI) and Rolls-Royce plc under project ATAP-10 (Advanced Turbines for Gas Aeroengines – Vision 2010); and by the UK Council for the Central Laboratory of the Research Councils (CCLRC) through the provision of research studentship and Programme Mode Access to Station 16.3 at SRS Daresbury.
Shu Yan Zhang, Willem J.J. Vorster, Tea-Sung Jun and Xu Song are doctoral students in the Department of Engineering Science, University of Oxford, Parks Road, Oxford OX1 3PJ, UK (e-mails: [email protected],
[email protected], [email protected], [email protected]). Mina Golshan and David Laundy are instrument scientists at the Synchrotron Radiation Source at Daresbury Laboratory, Warrington WA4 4AD, UK (e-mail: [email protected]).
Mike Walsh is Senior Professional– Mechanical Technology at Combustion Systems Engineering, Rolls-Royce plc, PO Box 31, Derby DE24 8BJ, UK (e-mail: [email protected]).
Alexander M. Korsunsky is Professor of Engineering Science in the Department of Engineering Science, University of Oxford, Parks Road, Oxford OX1 3PJ, UK (phone: +44-1865-273043; fax: +44-1865-273010; e-mail: [email protected]).
I. INTRODUCTION
Reliable prediction of safe life of modern structural assemblies, such as automotive and aviation engines, requires detailed experimental characterization and theoretical description of their response to complex cyclic thermo-mechanical loading experienced in service. Large scale industrial, national and international research programs are carried out aimed at collecting the necessary experimental data, and developing suitably sophisticated modeling tools.
In recent years it has been established that residual stresses and prior deformation (e.g. during fabrication) experienced by structural components can exert a strong influence on the deformation behavior, and hence durability of engineering structural components. This study focuses particularly on the subject of evaluation of residual stress states, and the procedures for the incorporation of the relevant findings in predictive modeling methodologies for (thermo-mechanical) fatigue life prediction.
Recent experimental studies [1-8] have demonstrated that the use of high energy X-rays (up to and exceeding 100keV) allows diffraction experiments to be carried out in transmission through thick sections (exceeding several millimeters, and up to several millimeters) of important structural engineering alloys based on magnesium, aluminium, titanium, iron and nickel. Since these materials find extensive use in various parts of aerospace and automotive engine and body assemblies, reliable knowledge of residual stress states in manufactured components is essential for developing reliable and suitably precise predictions of thermo-mechanical fatigue resistance and durability under complex service loading conditions.
The principle of diffraction strain measurement in polycrystalline alloys relies on Bragg’s law that establishes the relationship between the average interplanar lattice spacing d
within the sampling (or gauge) volume, on the one hand, and the wavelength (or energy) of X-ray photons and their scattering angle 2θ, on the other:
2dsinθ =λ =hc/E, (1) where λ is the photon wavelength, E is the photon energy, h is Planck’s constant, and c is the speed of light. In practice the determination of interplanar spacing can be carried out in one of two distinct modes, monochromatic or energy dispersive. In the first case the wavelength (and energy) of the incident beam is defined to high precision (usually better than ∆E/E = 10-3) by
High energy white beam x-ray diffraction studies
of residual strains in engineering components
suitable optics, and the scattering angle 2θ is determined by scanning a point detector, or via the use of a position-sensitive detector (PSD). In the second case the scattering angle 2θ is maintained fixed, but the detector used possesses the capability to resolve the energy of photons arriving, and to count their numbers by placing each instance into appropriate bin with the help of pulse-height discrimination and multi-channel analyzer. From the point of view of flux utilization and measurement efficiency, energy dispersive setup often turns out to be advantageous, since the total photon flux in the incident white beam (with wide energy spread) is vastly superior to monochromated beams. Furthermore, simultaneous collection of information about scattered intensity across a wide range of energies results in a diffraction pattern (that can be converted to intensity vs lattice spacing pattern using appropriate calibration, [8-11]) allows subsequent data interpretation that involves the refinement of a crystal lattice and scattering model (Rietveld refinement) through non-linear least squares fitting to the entire pattern containing multiple diffraction peaks. This allows the determination of average lattice parameters (e.g. a, c), and the corresponding lattice strains using the formula applicable to small strains:
ε =(a−a0)/a0. (2) Measurement arrangements and experimental studies described below demonstrate the capabilities of evaluating residual strains (and ultimately stresses) within large manufactured components using white beam high energy X-ray diffraction. In many cases the size and weight of real engineering components represents a challenge that can be addressed in one of several ways. On the one hand, suitably high capacity manipulation capabilities can be used to perform component scanning with respect to stationary beams. On the other hand, if a portable source can be chosen that provides radiation of sufficiently high flux and penetrating ability, then it is possible to make arrangements for the source (and the associated detection equipment) to be moved (scanned) with respect to large components, that in this case are maintained stationary. Finally, it is also possible to consider the possibility of performing controlled sectioning of large components into smaller parts in which residual strain measurements can be carried out, provided a suitable procedure can be identified for reconstruction of the residual stress state that existed in the entire component prior to sectioning. Eigenstrain procedures [12-13] provide a general basis for residual stress reconstruction from a series of measurements of residual elastic strains, e.g. by diffraction; or measurement of strain increments that occur within the object during stepwise removal of material or cutting.
II. EXPERIMENTAL SETUP AND DETECTOR ALIGNMENT
A. Diffraction instruments used
A laboratory high energy X-ray diffractometer for bulk residual strain evaluation (HEXameter) has been developed and built at Oxford University [14]. The principal difference between
HEXameter and the synchrotron energy dispersive beamline is
the nature of the X-ray source. Laboratory X-ray source was selected from industrial radiography range consisting of a high voltage X-ray generator (up to 225kV/4.5kW) equipped with a long-life metal-ceramic W target tube head.
Synchrotron X-ray scattering experiments reported here were carried out at the Daresbury Synchrotron Radiation Source (SRS), on Station 16.3. The station is a high resolution facility utilizing the centre section of the 6 Tesla wiggler fan and producing a smooth white beam spectrum with useable photons having energies up to 100 KeV.
The principle of the experimental setup was the same for both laboratory diffractometer and Synchrotron beamline. The diffraction spectra were recorded using high-energy solid state detectors in HEXameter and SRS station 16.3. A multi-channel analyzer was used for data acquisition.
B. Twin detector alignment procedure
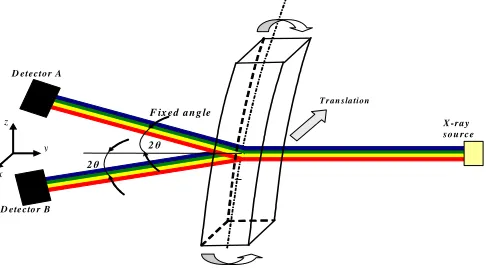
In most cases at least two mutually perpendicular directions of strains are needed for deduction of stresses. To increase data collection efficiency and obviate the requirement of rotating the sample, twin detectors setup was built in HEXameter and at SRS station 16.3. Fig 1 illustrated the principle of the twin-detector setup. Both detectors were positioned at small Bragg angles, but one was placed in the horizontal diffraction plane (spanning x
and y axes), while the other was offset in the vertical plane (spanning y and z axes). The detectors collected counts at the same time, allowing simultaneous determination of strains in two mutually orthogonal directions that lie almost within the plane normal to the incident beam.
The challenge that arises in the use of twin-detector setup is correct alignment, that must ensure that the two detectors are collecting the data from the same (or almost the same) gauge volume position. The alignment procedure uses incident beam of small cross-section (e.g. 0.1mm × 0.1mm ) to irradiate a thin film (less than 0.5mm) made from a fine-grained, strongly scattering material, such as copper. Provided adequate collimation is placed between each detector and the sample (detector slit and sample slit), strong diffraction signal will only be collected provided the collimators point at the small scattering volume.
We found it convenient to fix the scattering angle (e.g. by fixing it to be 10º) and scan the detector-collimation assembly perpendicular to the incident beam. Correct alignment of the detector corresponds to the position where the peak of total
D ete cto r B
X -ra y so u rce
T r an sla tion
y z
x z
F ix ed a n g le
2θ D etecto r A
[image:2.612.318.561.43.177.2]2θ
intensity is found. Fig. 2 illustrates the alignment procedure for the detectors.
C. Surface finding procedure
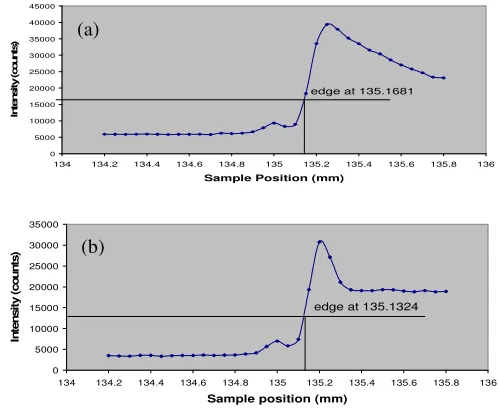
Both detectors were aligned using the procedure illustrated above. In order to check the accuracy of the alignment procedure, the two detectors were used to find the edge of an AlSiC bar of rectangular cross-section (illustrated in Fig.1). Figs. 3(a) and (b) show total intensity vs. sample position profiles for the vertical and horizontal detectors, respectively. The difference in the edge positions deduced amounted to less than 30 micrometres, suggesting that the accuracy of detector alignment that could be achieved using this approach was better than 1/3 of the incident beam cross-sectional dimension.
D. Manipulation of large components
The Oxford laboratory energy dispersive diffractometer
HEXameter consists of the carrying frame, or yoke, that houses
the source X-ray tube and associated collimation components, and the two energy dispersive detectors, with associated collimation components, as illustrated in Fig. 4. Co-alignment
and calibration of the two detectors must be carried out prior to strain measurement, by following the alignment procedures described above, followed by collection of diffraction patterns from a powder sample with well-known crystal structure and lattice parameter, such as NIST silicon standard. This allows simultaneous determination of the precise scattering angle and of the channel-to-energy conversion characteristic for each detector.
An important part of HEXameter is the high loading capacity (up to 100kg) translation-rotation system. to mount the component and a movable X-rays source. A motorized X-Y-Z-α
positioning table was designed and made by MicroMech Systems Ltd, Braintree, UK. The translation stage is driven by micro-stepping motors and provides translation ranges of 500mm and infinite rotation capability around the vertical axis.
Laboratory arrangement used in the HEXameter instrument provides an important aspect of manipulation flexibility, since the translation-rotation system can be used either to move the measured component with respect to the stationary ‘yoke’, or, alternatively, the ‘yoke’ can be attached to the translation-rotation system and moved with respect to the stationary sample. This setup flexibility will be used in the future to study large component, such as the combustion casing described below.
In contrast with the laboratory HEXameter setup, at SRS station 16.3 the only option available is that of moving the measured sample with respect to the stationary incident X-ray beam delivered from the insertion device. A high loading capacity translation system with X-Y-Z-rotation sample positioning table was installed, and used to perform scanning operations described below.
III. CASE STUDIES
A. Elasto-plastically bent Al/SiCp bar
Diffraction measurements of elastic lattice strain were carried out using HEXameter and validated by comparison with the results obtained for the same samples on Station 16.3 at the SRS (Daresbury, UK). Fig. 5 illustrates the comparison between Incident Beam
Copper thin film Diffracted beam
Position B Position A
2θ
1000 1050 1100 1150 1200 1250 1300 1350 1400
144 145 146 147 148 149
[image:3.612.52.300.47.222.2]Total intensity vs. detector position
[image:3.612.330.560.53.220.2]Figure 3. Schematic diagram of detector alignment procedure. Figure 2. Illustration of HEXameter ‘yoke’ carrying source tube and collimation ‘nose’ (left), and detectors (right).
Figure 4. Illustration of surface finding using two detectors
0 5000 10000 15000 20000 25000 30000 35000 40000 45000
134 134.2 134.4 134.6 134.8 135 135.2 135.4 135.6 135.8 136 Sample Position (mm)
In
te
n
s
it
y
(
c
o
u
n
ts
)
edge at 135.1681
0 5000 10000 15000 20000 25000 30000 35000
134 134.2 134.4 134.6 134.8 135 135.2 135.4 135.6 135.8 136
Sample position (mm)
In
te
n
s
it
y
(
c
o
u
n
ts
)
edge at 135.1324
(a)
[image:3.612.47.296.514.719.2]residual strain profiles within the alloy matrix of a bent 10×10mm2 cross-section bar of aluminium alloy matrix (AA2024) particulate (SiC) composite. Good quality of agreement between the two sets of measurements indicates that
HEXameter provides an excellent tool for laboratory
measurement of residual elastic strain in the bulk of specimens and engineering components.
B. Aeroengine combustion casing
[image:4.612.55.295.48.188.2]Research project devoted to the analysis of structural integrity and durability of gas turbine engine combustion components (ATAP-10) was co-funded by the DTI and Rolls-Royce plc. It focused principally on combustion liners and casings, aiming to produce a validated lifing methodology for the design and in-service support of a wide variety of gas turbine components. The casing has the dimensions of 880mm (maximum diameter) by 750mm (height), a mean wall thickness of about 3 mm, weighs over 50kg. It has complex geometry allowing for the mounting of fuel supplies and liners, and has been manufactured by using forging followed by machining, as well as electron beam welding. Combustion casings have circumferential flanges at their rear and front ends for the purposes of providing bolted connection to other engine components downstream and upstream from the combustor.
Table 1. Composition of nickel base superalloy IN718
Component Wt. % Component Wt. %
Al 0.2 - 0.8 Cu Max 0.3
B Max 0.006 Fe 17
C Max 0.08 Mn Max 0.35
Co Max 1 Mo 2.8 - 3.3
Cr 17 - 21 Nb 4.75 - 5.5
P Max 0.015 Si Max 0.35
S Max 0.015 Ti 0.65 - 1.15
Ni 50 - 55
The material of combustion casing is nickel base superalloy IN718. Its chemical composition is given in Table 1. Like many superalloys, this material retains strength to temperatures that constitute an unusually high proportion of its melting
temperature. Its strength is derived from the distribution of precipitates of γ' phase that provide effective obstacles to dislocation movement and thus increase the yield stress of the material and improve its resistance to high temperature creep deformation.
[image:4.612.309.564.49.232.2]The residual stress state within the casing is complex, and would be disturbed if the casing were to be sectioned to extract coupons of conveniently small dimensions. Due to the size and shape of the combustion casing considered here, experimental set up at Station 16.3 (SRS Daresbury, UK) required the use of large capacity manipulation stage described earlier. In particular, the casing was tilted on the table to a predefined angle in order to ensure that a carefully defined component of residual elastic strain was measured, and that the diffracted beam was not blocked from reaching the detector. The setup is illustrated in Fig. 6. Note that twin detector set up was used that Figure 5. Illustration of the setup of combustion casing on the large capacity manipulator at Station 16.3, SRS Daresbury.
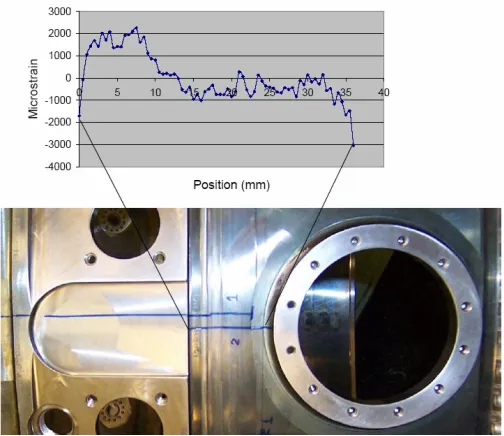
Figure 6. Detail of the combustion casing and the scan line (marked 2) and the corresponding measured residual elastic strain profile.
-1000 -500 0 500 1000 1500
-5 -4 -3 -2 -1 0 1 2 3 4 5
Position (mm)
M
ic
ro
st
r
a
in
[image:4.612.311.563.474.692.2]SRS 16.3 HEX
was similar to that shown in Fig. 1 for laboratory measurement using HEXameter diffractometer.
In our analysis we were particularly concerned with certain locations within the casing where the combination of geometric characteristics and the loading conditions experienced in service made the initiation of fatigue crack most likely. Fig. 7 provides a more detailed indication of the location within the casing at which a line profile of average macroscopic residual elastic strain was collected. The scan line extended from the round boss towards the circumferential weld joint line.
The hoop component of the residual elastic strain indicated in the graph shown in Fig. 7 shows the tensile region associated with the weld that is centered around the position 5mm. This tensile hoop residual elastic strain decreases to low (near zero) levels at distances of about 5mm each side of the weld center line, becoming slightly compressive towards the round boss seen in Fig. 7. Precise determination of the magnitudes of two significant stress components (hoop and axial) requires the collection of multiple strain components within the casing. Once such data is obtained, stress determination can be carried by a variety of techniques, e.g. using the sin2ψ method.
C. Aluminium alloy MIG welded plate
[image:5.612.44.298.59.183.2]Thin-walled aluminium structures find extensive use in aerospace and automotive engineering, due to their favorable combination of strength, stiffness and weight. One of the ongoing challenges in the fabrication of assemblies from aluminium alloys is the necessity to join components reliably and without reducing strength and fatigue resistance. A variety of joining methods are in use, including riveting that is used in combination with measures that impede fatigue crack initiation, such as e.g. cold expansion of rivet holes [15]. Welding presents an attractive alternative. However, most current welding methodologies suffer from limitations that prevent their widespread use in aerospace and automotive manufacture. As a consequence of welding operations the parent plate material undergoes complex thermo-mechanical treatment that may result in depletion of solute, over-ageing, micro-cracking, and also in the creation of locked-in residual stress states.
Table 2. Composition of aluminium alloy AA6082
Component Wt. % Component Wt. %
Cr Max 0.25 Mg 0.6 – 1.2
Cu Max 0.1 Mn 0.4 - 1
Fe Max 0.5 Zn Max 0.2
Si 0.7 - 1.3 Other, each Max 0.05
Ti Max 0.1 Other, total Max 0.15
Al 95.2 - 98.3
In the current study an example manual inert gas (MIG) weld of two plates of aluminium alloy AA6082 was considered. The welded plate had the nominal width of 450mm, height of 500mm and thickness of 3mm, and thus presented an example of a large engineering assembly. The chemical composition of aluminium alloy AA6082 is shown in Table 2.
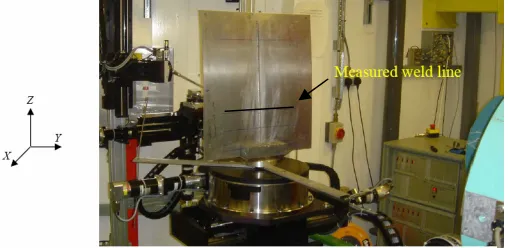
The plate was mounted on the large component translation-rotation table at Station 16.3, SRS Daresbury, as illustrated in Fig. 8.
Additional complication in the study of the welded plate arose from the fact that welding induces plate distortion that manifests in ‘deplanation’, i.e. in the plate assuming so-called ‘butterfly’ shape, being no longer flat. In order to ensure that during measurement the gauge volume remains centered at mid-thickness of the plate, careful surface finding procedures were carried out at several points along each scan line. Subsequently scanning was carried out involving coordinated movement in both x and y directions.
The result of the residual elastic strain component parallel to the weld is shown in Fig. 9. It is evident that the welding process introduced a complex stress field in the plate, with particularly high stresses arising in the heat affected zones (HAZ) adjacent to the weld line.
The magnitude of peak stress within the HAZ appears to reach the value of 800 MPa, which is well in excess of the yield strength of this alloy. It therefore appears that thermal processing during welding causes local change in the unstrained lattice spacing within the heat affected zone. Accurate determination of residual stress profile must therefore include experimental evaluation of lattice parameter variation across the weld. Alternatively, some suitably sophisticated interpretation procedure (e.g., based on eigenstrain) can be used that allows the lattice parameter variation across the weld to be backed out from strain measurements along the traction-free edge of a welded plate, where the stress component perpendicular to the Figure 8. Illustration of the experimental setup for
MIG-welded plate of aluminium alloy AA6082.
-600 -400 -200 0 200 400 600 800 1000
-40 -30 -20 -10 0 10 20 30 40
Distances from weld line (mm)
R
e
s
id
u
a
l
s
tr
e
s
s
(
M
P
a
[image:5.612.318.567.592.702.2])
free edge must vanish.
IV. CONCLUSION
The significance of the work described in the present study lies in the possibility of using the developments reported here to derive improved fatigue lifing procedures that must incorporate the influence of residual stresses on deformation behaviour, crack initiation and crack propagation under in-service conditions.
Large capacity manipulating equipment has become a standard requirement for dedicated engineering instruments at large research facilities, such as the engineering diffraction instrument ENGIN-X at the ISIS spallation neutron source at the Rutherford Appleton laboratory near Oxford, UK. Diamond, the new UK synchrotron light source that is located on the same site, will house JEEP, Joint Engineering, Environment and Processing beamline for monochromatic and energy dispersive diffraction and imaging. JEEP will have capabilities for precise and repeatable positioning of large components and loading devices weighing up to 1000 kg. Such capabilities will be combined with advanced detection systems, e.g. multi-cell energy dispersive detector systems allowing simultaneous collection of data from a fan of up to 23 different scattering vectors. This will open up the prospects of rapid and efficient acquisition of large data sets that can be used to refine and validate sophisticated numerical models of residual stress states within components possessing complex geometry.
The influence of residual stress (or internal hardening state) on fatigue resistance of materials represents a separate area of research not dwelt upon in the present study. Instead, in the present context the principal interest was placed on the ability to determine the residual stress distribution in greatest level of detail possible, and subsequently to incorporate this information in numerical models of entire components or assemblies. This task begins with experimental determination of residual strain state that in the present analysis was accomplished by diffraction of high energy X-ray beams.
Residual elastic strains may only ever be determined as average values within certain gauge volumes that are sampled at a certain finite number of measurement positions. Reconstruction of the complete residual stress state from this finite set of measured values, and incorporating this information within the finite element model of the component is the next task. The eigenstrain modeling approach seems to provide an efficient and convenient method of representing the sources of residual stress, allowing subsequent in-service deformation to be considered, and residual stress evolution to be considered.
Future development of residual stress analysis methods is likely to be progressively more closely linked with deformation modeling. It is also likely that the range of scales accessible to residual stress measurement techniques will expand, both towards larger objects (such as buildings, bridges, and other civil engineering structures) and towards smaller length scales (electronics components, micro- and nano-electromechanical systems, etc.) While measurement techniques suitable to these
vastly different scales must necessarily be different, some of the interpretation and analysis techniques, such as eigenstrain reconstruction procedures for residual stress states, possess sufficient generality to be useful across length scales, from macroscopic to micro- and nano- scales [16].
REFERENCES
[1] A.M. Korsunsky, S.P. Collins, R.A. Owen, M.R. Daymond, S. Achtioui, K.E. James (2002) “Fast residual stress mapping using energy-dispersive synchrotron X-ray diffraction on station 16.3 at the SRS.” J Synchrotron Radiat, 9, p.77–81.
[2] A.M. Korsunsky, W.J.J. Vorster, S.Y. Zhang, D. Dini, D. Latham, M. Golshan, J. Liu, Kyriakoglu Y., Walsh M.J. (2006) “The Principle of Strain Reconstruction Tomography: Determination of Quench Strain Distribution from Diffraction Measurements“, Acta Materialia 54 (8), p. 2101-2108.
[3] A.M. Korsunsky, J. Liu, M.Golshan, D. Dini, S.Y.Zhang, W.J. Vorster (2006) “Measurement of Residual Elastic Strains in a Titanium Alloy Using High Energy Synchrotron X-Ray Diffraction”, Experimental Mechanics, 46 (4), p. 519-529.
[4] W. J.J. Vorster, S. Y. Zhang, M. Golshan, D. Laundy, D. Dini and A. M. Korsunsky (2007) “Comparison of X-ray diffraction measurement of residual elastic strains using monochromatic image plate data and white beam energy-dispersive analysis”, Journal of Strain Analysis, v.42 (1), p. 23-37.
[5] M. Topic, R. Bucher, W. Vorster, S.Y. Zhang, P. McGrath, A.M. Korsunsky, “Residual stress in laser bent steel components”, Materials Science Forum (2006) 524-525, p. 299-304.
[6] A.M. Korsunsky, M.R. Daymond, K.E. James (2002) “The correlation between plastic strain and anisotropy strain in aluminium alloy polycrystals.” Mater Sci Eng A - Struct Mater Prop Microstruct Process, 334, p.41–48.
[7] A.M. Korsunsky, K.E. Jarnes, M.R. Daymond (2004) “Intergranular stresses in polycrystalline fatigue: diffraction measurement and self-consistent modeling.” Eng Fract Mech 71, p.805–812.
[8] J. Liu, K. Kim, M. Golshan, D. Laundy, and A.M. Korsunsky (2005) “Energy calibration and full-pattern refinement for strain analysis using energy-dispersive and monochromatic X-ray diffraction.” J. Appl. Crystallography, 38, p.661-667.
[9] P. Ballirano, R. Caminiti (2001) “Rietveld refinements on laboratory energy dispersive X-ray diffraction (EDXD) data.” J Appl Crystallogr 34, p.757–762.
[10] A. Steuwer, J.R. Santisteban, M. Turski, P.J. Withers, T. Buslaps (2004) “High-resolution strain mapping in bulk samples using full-profile analysis of energy-dispersive synchrotron X-ray diffraction data.” J Appl Crystallogr, 37, p.883–889.
[11] A.C. Larson, R.B. Von Dreele (2000) General Structure Analysis System (GSAS) manual.
[12] A.M. Korsunsky (2005) “On the modelling of residual stresses due to surface peening using eigenstrain distributions.” J Strain Anal Eng Des, 40, p.817–824.
[13] A.M. Korsunsky (2006) “Variational eigenstrain analysis of synchrotron diffraction measurements of residual elastic strain in a bent titanium alloy bar.” J Mech Mater Struct, 1(2), p.259-278.
[14] A.M. Korsunsky, S.Y. Zhang, D. Dini, W.J.J. Vorster, J. Liu (2006) “Oxford HEXameter: Laboratory high energy X-ray diffractometer for bulk residual stress analysis”, Materials Science Forum, 524-525, p. 743-748.
[15] Y. Zhang, M.E. Fitzpatrick, L. Edwards (2005) “Analysis of the residual stress around a cold-expanded fastener hole in a finite plate”, Strain, 41 (2), p.59-70.