Modeling and Simulating of Coordinated Multi- Point
(CoMP) Technology in LTE- A
Saad Ahmed Ayoob
Department of Electrical Engineering,
Mosul University
Iraq
Amina Nawfal Hammodat
Department of Electrical Engineering,
Mosul University
Iraq
ABSTRACT
LTE-A introduced many new features and techniques, one of these techniques is the Coordinated Multi-Point (CoMP) technique. This technology has a significant role in improving the performance of the cell, especially cell-edge throughput of users, by reducing the impact of Inter Cell Interference (ICI) and increasing throughput and spectral efficiency. This paper provided a modeling and simulation of CoMP technology, Where the CoMP Joint Processing (JP) is adopted. System level simulation (V1.9) is licensed by University of Vienna to model and simulate CoMP technique. It is known that the resource block (RB) is directly proportional to the increase in the bandwidth, but the bandwidth is not always available. Therefore, this paper considers the effect of changing the bandwidth on the mean number RB occupancy, average user throughout and spectral efficiency with changing the number of users per cell at different Transmission Time interval (TTI). The simulation results show the relationship between the bandwidth and the RB and other relationships.
Keywords
Modeling, CoMP, LTE-A, Resource Block.
1.
INTRODUCTION
The LTE-Advanced conditions are focused primarily on achieving higher capacity with increased the coverage of high data rates, ability to control a greater number of simultaneously active users, higher spectral efficiency and improved performance at cell edge throughput. As well as its role in improving the performance of mobile users within the network. To meet the growing need for wireless network users in conjunction with the evolution of the applications of these networks, Third generation partnership Project (3GPP) LTE-A has provided a significant impact on improving the coverage of these networks as well as improving spectral efficiency [1]. This improvement of performance as a result of overcoming the most common problems facing cellular networks that prevent the user from benefiting from the services of the network is the problem of ICI [2]. Which shows its apparent effect at the edge of the cell due to the reuse of the same frequencies with neighboring cells [3]. One of the most important techniques introduced by LTE - A, which was the most important to overcome the problem of ICI is CoMP technology [4]. This technology allows several BSs. to share their resources in a coordinated and jointly manner [5]. Cooperating BSs. (cells) must have common Resource Block (RB) to send the data together in a coordinated way to the user. The function that makes this technology highly efficient is that there is a scheduling process between users within the collaborating stations [4]. In order to exchange channel status information (CSI) and data between the cooperating stations in this technique requires a high-scale BW of backhaul networks. It also requires synchronization of the work among the BSs.
There are many factors that effect on the performance of CoMP technology, including factors depending on the user settings, such as the number of users within a single cell, the speed of movement of users, as well as how to distribute users around the Region Of Interest (ROI).Other factors depend on network settings, for example, type of network used, number of Base Stations (BSs.), cluster size, number of ports in transmission and reception, average transmission, system Bandwidth (BW)and MIMO used. In addition to the effect of both the type of deployment technology used and the scheduling algorithm on CoMP performance.
This paper touched on many aspects including RBs. occupancy and their relationship to BW in LTE-A. Another aspect including modeling and simulation of LTE-A with CoMP JP of downlink communication technology. The impact of changing the BW of CoMP model on both RB and the spectral efficiency when users’ number and TTI are changed. To illustrate this paper better, divided into sections: The section (2) made related works, section (3) include assumptions of CoMP modeling of LTE-A. In section (4) explain the most important principles of CoMP technology in downlink Communication. Simulation and discussion of the results submitted in section (5). Finally, the conclusions are drawn in section (6).
2.
RELATED WORKS
[5] investigated several CoMP schemes, focusing on clarifying the impact of using multi-antennas beamforming in improving the performance of cellular networks. It was based on combining flow-level analysis with network simulations to evaluate the performance in terms of average user throughput achievable under different traffic intensities, the results also provided a comparison between ideal beam and non-ideal beam in terms of throughput and system stability, also showed intra-site coordination in non-ideal beam achieves significant gains over the blind beamforming system where with ideal beams, intra-site interference is naturally avoided. comprehensive survey for CoMP technology introduced in [9] including its architecture, sets, and promising approaches also discussion deployment scenarios and CoMP types. It also presented some of the challenges faced by this technology and appropriate solutions that could be adopted in LTE-A, As well as the characteristics of CoMP that made it among the appropriate techniques in the deployment and implementation like lower cost, enhanced backhaul, high synchronization, low complexity, feedback accuracy among users and BSs.
In [10], supervised machine learning is used to propose a novel method for practical Joint Processing downlink coordinated multipoint (DL CoMP) implementation in LTE/LTE-A systems. It also relied on the use of support vector machine (SVM) classifier to improve edge user data rate and spectral efficiency through reducing average transmit power requirement to meet the target SINR required to achieve the data rate.
In [11] used the Coordinated Multipoint transmission to tight bound between small cells without interfere each other. The solution to this problem was based on this study through assign different frequency channel to macro-cell and small cell where used open frequency 2.6 GHz for macro and 3.5 GHz for small cell. Moreover, the process of analysis of the cooperative transmitter scheme is performed with respect to the Massive MIMO. The simulation results also showed better CoMP simulation scenarios compared to existed scenarios. In [12] focused on CoMP topology using different frequency spectrum design shared and dedicated for wireless communication systems, namely within the context of RRH antennas, and HetNet scenarios, and present one of the simplest ways of improving system performance is to enhance the signal power. This goal can be achieved using LTE system level simulator (SLS) to joint transmission down link CoMP scheme and the results showed the use of shared spectrum. increases the cell average throughput.
3.
MODELING AND SIMULATION OF
LTE-A.
LTE-A networks provide wide range of systems for modeling to simulate many scenarios that show their impact on the performance of cellular networks. System level simulation [13] is one of these systems, which is licensed by the University of Vienna for scientific purposes. This study is based on the work of a scenario model to simulate the effect of changing BW and its impact on the average user throughput and spectral efficiency, In addition to its impact on the mean RB occupancy with presents CoMP technology with varying TTI and number of users per cell.
3.1 Modeling assumptions
This model have a number of assumptions:1- The use of homogenous networks was adopted.
2- The number of BSs. used is 7. Each base station covers three sectors. This means that in this model there are 21 cells with a random number of users. The radius of each cell is 250m.
3- Number of transmit antenna port =4. 4- Number of received antenna port =1. 5- System frequency= 2.14 GHz. 6- Number of eNodeB rings=1.
7- CoMP – scheduler/ Round Ruben/ DB. 8- CoMP configuration/ Intra- site.
3.2 Simulation parameters
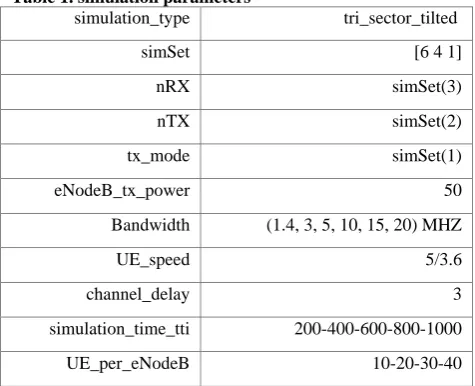
[image:2.595.310.548.265.458.2]The simulation parameters related to the network architecture that adopted to describe this model listed in table [1]:
Table 1. simulation parameters
simulation_type tri_sector_tilted
simSet [6 4 1]
nRX simSet(3)
nTX simSet(2)
tx_mode simSet(1)
eNodeB_tx_power 50
Bandwidth (1.4, 3, 5, 10, 15, 20) MHZ
UE_speed 5/3.6
channel_delay 3
simulation_time_tti 200-400-600-800-1000
UE_per_eNodeB 10-20-30-40
Figure1: Graphical User Interface (GUI)
4.
PRINCIPLES OF COMP
TECHNOLOGY
CoMP is one of the (3GPP) LTE- A Rel.11 techniques to solve one of the most important problems facing cellular networks, namely the ICI problem, the reason is to reuse the same frequencies with neighboring cells.
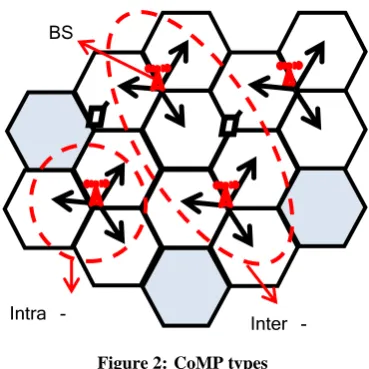
This technology had a significant impact on increasing spectral efficiency and throughput as well as increasing coverage areas, making it a technology used to improve the performance of cellular networks. With this technology, a group of BSs. collaborate in a highly efficient and coordinated manner to serve the use. This coordinate has a great impact on improving the requirements of users, especially users of the edge cell because the performance of the network is as low as possible [14]. CoMP technology according to the locations of the cooperating base stations is classified into two types, intra- site and inter site. In intra – site, the cooperating sectors return to the same BS. While in the second type (inter- site), the cooperating BSs. occupy different geographic locations. Figure 2 demonstrates both types [15].
[image:3.595.337.522.84.269.2]In downlink transmission with CoMP technology works with two modes, the first one called Joint Processing (JP), in this type; The data needed by the user is available at several points of the cooperating transmitter, also this mode may be either Joint Transmission (JT) or Dynamic Point Selection (DPS). The second model is Coordinated scheduling/ Coordinated beamforming (CS/CB). In JP with JT type, collaborating BSs. sharing users’ data and (CSI) among them. This type provides better results than other types, so it is used in the simulation of this study, although it needs high backhaul bandwidth.
Figure 2:CoMP types
With the increase in the number of users and the development of applications in cellular networks, the use of network resources and management has become a fundamental basis for evaluating the performance of these networks. These tasks are located on the BSs. within the networks, and to ensure the completion of this tasks efficiently, LTE-A added the scheduling process within these stations in order to ensure that users fully benefit from network resources according to certain scheduling algorithms [
1
6]. To ensure that communication between users and BSs. is synchronized, the term Resource Block (RB) is found. RB is defined as a unit of measurement of resources, which is consist of the Resource Element (RE), which represents the smallest unit of measurement of the resource. These elements come in the form of large groups to form RB [17].The RB consists of 12-sub channel (15kHz) or 24-sub channel (7.5 kHz) in frequency domain while in time domain be either 6 or 7. Also, the time the RB needs to occupy one slot is 0.5 ms, two-slot are represented the sub-frame with a time 1 ms, which also represents the time required for scheduling processing. While the frame is made up of 10 sub-frames [15]. In addition to the above when compared between (3G) and (4G) systems (LTE/LTE-A). The last used Orthogonal Frequency Division Multiple Access (OFDMA) in downlink transmission and Single-Carrier (SC-FDMA) in uplink. It also added the possibility of separating the uplink and downlink communication between both base stations and users within the cellular network through the two models (FDD) and (TDD). Figure 3 (a, b) show these two models.
In each sub-frame the number of RB depends on the system's bandwidth. The time that the scheduler required to handle the smallest resource unit is called Transmission Time interval (TTI). It consists of two consecutive RBs., and RB can be set for more than one user at the same time and simultaneously at each TTI [18]. ICI has a significant effect on the distribution of RB within the cell, the increase in ICI increases the proportion of RB and therefore the existence of CoMP technology in the simulation reduces the proportion of RB because the basic principle of work is to reduce ICI [2]. The following section provides a detailed explanation of this technique.
Inter - site Intra -
(a) Frame structure of FDD.
[image:4.595.323.537.65.507.2](b) Frame structure of TDD. Figure 3: Two models of the frame structure.
5.
SIMULATION AND DISCUSSION OF
THE RESULTS
The simulation results displayed on the GUI were divided into two categories:
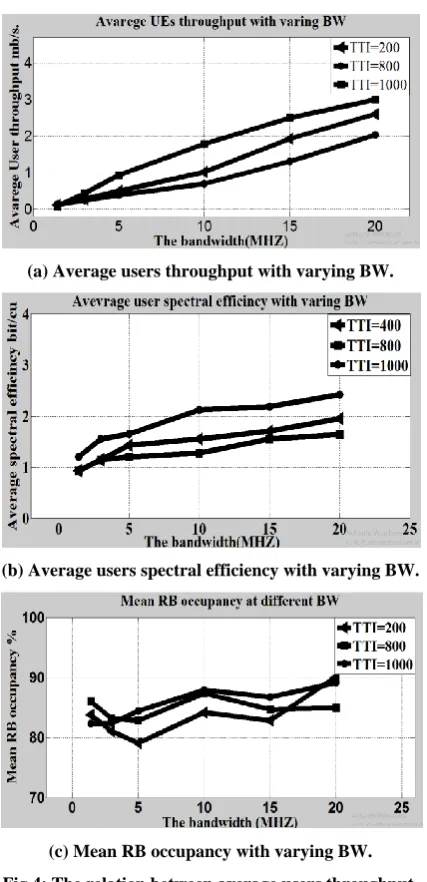
1. The first category contains the simulation results for the changing BW (1.4, 3, 5, 10, 15 and 20) MHz and its effect on the throughput spectral efficiency and mean RB occupancy at TTI (200, 400, 800 and 1000). This result was also represented in the curves in Figure 4 (a, b, c).
(a) Average users throughput with varying BW.
(b) Average users spectral efficiency with varying BW.
(c) Mean RB occupancy with varying BW. Fig 4: The relation between average users throughput,
spectral efficiency and mean RB occupancy with varying BW at TTI (200, 800, 1000). The curves in the Figure 4 (a, b) demonstrate that an increase both in throughput and spectral efficiency occurs when the BW increases. The increasing BW increases the value of RB because more RB’s are added. This leads to improving the network performance by increasing both throughput and spectral efficiency.
It is known that the value of the RB at the maximum value of BW (20 MHz) corresponds to (100 RB). The reason for not obtaining these results in the simulated to adopt CoMP technique that has a negative impact on RB is because of the fact that the principle of this technique is to reduce the impact of ICI. On the other hand, this interference has a direct relationship with the RB. The irregular distribution shown by curves in Figure 4 (c) is due to the use of the RR algorithm, which provides an absolute fairness in the distribution of RB among network users.
2. The second category adopted a change in the number of users per cell to obtain the simulation results for both the throughput and spectral efficiency for the users of the cell once and the users of the cell edge again. In addition, this category
1 Radio frame
.
R B
R E Su
bc arr ier (fr
eq
ue
nc
y)
OFDM symbol (Time)0 1 2 3 4 5 6 9
0 1 2 3 4 19
1slot 1sub-frame
0 1 - - - 4 - - - 9
Sub-fram e
Guard Period
Downlink Pilot Time
Slot UpPTS
Downlink Pilot Time
Slot DwPTS Downlink
Pilot Time Slot DwPTS
Downlink Pilot Time
Slot UpPTS
GP GP
0 – 4
5 - 9
Half
[image:4.595.57.269.78.374.2]includes a statement of the change of both BW and number of users per cell on the mean RB occupancy as shown in Figure 5 and 6.
(a) Average users throughput with varying BW.
[image:5.595.321.540.72.220.2](b) Average users spectral efficiency with varying BW. Figure 5: The relation between average users’ throughput
and spectral with varying BW at user numbers equal 20, 30 and 40.
From the Figure 5 (a,b), and in the same context in the first categories, the results also show increased throughput and spectral efficiency with increase in BW. It was found that increasing the number of users within the cell will negatively effect on the both values because the network resources will be divided on a larger number when increasing the number of UEs/cell.
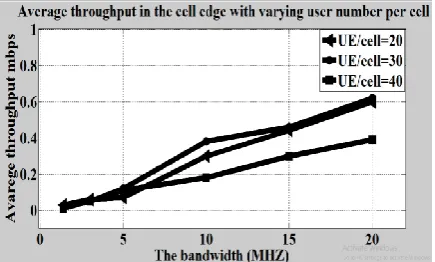
For the same parameters in Figure 5 (a,b), the effect of varying BW and number of users on the throughput and spectral efficiency of users of the cell edge was taken only, Figure 6 (a,b) shown that.
(a) Average throughput in the cell edge with varying BW
(b) Average user spectral efficincy in the cell edge with varying BW.
Figure 6: The relation between average throughput and spectral in the cell edge with varying BW at user
numbers equal 20, 30 and 40.
It is worth mentioning that improved the performance of users in the cell edge shown above is due to increasing BW of the packet and the use of CoMP technique that particularly serves cell edge users. Finally, Figure 7 shows the effect of changing the same parameters on the mean RB occupancy for different groups of users in the cell.
Figure 7: The relation between mean RB occupancy with varying BW at user numbers equal 20, 30 and 40. It is clear from Figure 7 that the mean RB occupancy is slightly affected when the BW is changed and the change is minimal when increasing the number of users in the cell. As mentioned in the first category, this is related to the fact that use an RR algorithm that provides relative fairness in the distribution of resources among cell users.
6.
CONCLUSION
[image:5.595.317.535.341.476.2] [image:5.595.59.277.582.713.2]little change in results with a change in BW. A proposed future work, is the possibility of conducting a study to investigate how to increase the efficiency of the system by increasing the bandwidth to 100 MHz and study its effect on throughput and spectral efficiency for the cell and for the users at the cell edge with presence CoMP technique. In addition to the possibility of using MIMO technology to improve the performance of the networks in terms of throughput, spectral efficiency and data rate.
7.
REFERENCES
[1] Liew J. T. and Fazirulhisyam H. 2014. Performance Analysis of Coordinated MultiPoint (CoMP) in Long Term Evolution-Advanced. 2nd International Symposium on Telecommunication Technologies (ISTT).
[2] Vlado S., Djordje B. and Dusan S. 2016. Intra eNB UL CoMP: Concepts, Performance and Field Trial Results. 24th Telecommunications Forum (TELFOR).
[3] Matteo A. and Henrik L. Ch. 2014. Modeling and event-driven simulation of coordinated multi-point joint transmission in LTE-Advanced with constrained backhaul. Proceedings of the Winter Simulation Conference.
[4] Ankit S. and Ravi S. 2016. Characterizing the effect of N-CoMP and CoMP with interference in LTE-A. International Conference on Computer Communication and Informatics (ICCCI).
[5] Ahlem. Kh., Thomas B. and Salah-Aldden E. 2015. Analytical Modeling of Downlink CoMP in LTE-Advanced. Vehicular Technology Conference.
[6] Sravanthi K., Shubhrika S., Deesha B., Adwait P. and Mayur G. 2013. Overview of LTE-A Technology. 2013 IEEE Global High-Tech Congress on Electronics, Shenzhen.
[7] Mohammad D. and Kamran A. 2014. LTE-Advanced, and the Way Forward. International Symposium on Communications and Information Technologies (ISCIT).
[8] Antonio V., Giovanni S. and Giovanni N. 2014. SimuLTE – A Modular System-level Simulator for LTE/LTE-A Networks based on OMNeT++. 2014 4th International Conference On Simulation And Modeling Methodologies, Technologies And Applications (SIMULTECH), Vienna, Austria.
[9] Faizan Q., Kaharudin B. D. and MHD N. H., 2017. A comprehensive review on coordinated multi-point operation for LTE-A. ELSEVIER journal.
[10]Faris B. M. , Senior M., Brian L. Evans and Fellow. 2018 Improving Downlink Coordinated Multipoint Performance in Heterogeneous Networks. Submitted to IEEE journal of selected topics in signal processing. Online. Available: https://arxiv.org/pdf/1608.08306.pdf . [11]Seetaiah K., 2017. Improving Spectral Efficiency of
Massive MIMO Network for Next Generation 5G Wireless Network. International Journal of Emerging Trends in Engineering and Development.
[12]Maryem N., Shahid M. and Jonathan R. 2017. Performance Analysis of Downlink CoMP Transmission in Long Term Evolution-Advanced (LTE-A). The Seventh International Conference on Advances in Cognitive Radio COCORA.
[13] https://www.nt.tuwien.ac.at/research/mobile-communications/vccs/vienna-lte-a-simulators.
[14]Ahnaf S. Ahmad, Md. Jamiul H. and Md. Farhad H. 2016. A Novel CoMP Transmission Mechanism for the Downlink of LTE-A Cellular Networks. 5th International Conference on Informatics, Electronics and Vision (ICIEV) 2016.
[15]Md. Shipon A., 2014. On the Evolution of Coordinated Multi-Point (CoMP) Transmission in LTE-Advanced", International Journal of Future Generation Communication and Networking.
[16]Christian M., Josep C. I., Michal S., Stefan S., Martin Wrulich and Markus R., 2011. The Vienna LTE simulators - Enabling reproducibility in wireless communications research", EURASIP Journal on Advances in Signal Processing.
[17]Neeraj K., and Dr. Anwar A., 2015. Resource Allocation in LTE Advanced for Different Services. Amity Journal of Computational Sciences (AJCS).