REVIEW ARTICLE
LIVELIHOOD DIVERSIFICATION: CASE STUDY OF SOME BACKWARD REGIONS
IN INDIA
*Soumyendra Kishore Datta and Krishna Singh
Department of Economics, Burdwan University,
ARTICLE INFO ABSTRACT
Now- a- days the rural economy is not based solely on agriculture but relies on a diverse array of activities and enterprises. This aspect is taken account of by recent evolution of the concept of livelihood diversification as a survival strategy of rural
countries and stabilize their incomes. It is now well recognised that peoples’ ability to engage in supplementary (and often better rewarding) non-agricultural activities is often governed by their relative access to a diversity of asset base. Access to this diverse form of assets is influenced by a complex web of socio
geographical environment in the concerned region. It is notable that access to different types of assets and socio
to differences in skill formation and income generation opportunities. In this backdrop, an analysis has been made pertaining to the issues of livelihood and diversification strategy followed by people in two very backward regions in W.B
-economic features. Greater diverg
status, outlook, opportunities and push and p
significant/insignificant difference in various parameters of
diversification across the study areas.
INTRODUCTION
There is no doubt that even after 60 years of independence in India there are a huge number of people in rural areas who live in abject poverty and for whom earning even a subsistence type of livelihood is a challenging job. Although a number of projects have from time to time been undertaken by the Govt. for poverty reduction purposes, the results have only been palliative without generating sustainable livelihood earning prospects.
*Corresponding author: [email protected]
Again apart from
infrastructure developments like housing, roads and communication, the Govt. has also passed legislation for providing benefit to rural people. For instance with the introduction of ‘Right to Information Act’ the Govt. has
accountable to the public in general in regard to provisioning of information related services. Thus under universal service obligation, each village has the right to clamour for installation of village public telephone with maintenance facilit However village community or civil society organization has often been unaware of or apathetic
ISSN:
0975-833X
International Journal of Current Research Vol. 33, Issue, 2, pp.139-151
Key words:
Livelihood, Diversification, Strategy.
Article History:
Received 17th December, 2010
Received in revised form
15th January, 2011
Accepted 30th January, 2011
Published online 11th February, 2011
ARTICLE
LIVELIHOOD DIVERSIFICATION: CASE STUDY OF SOME BACKWARD REGIONS
IN INDIA
Soumyendra Kishore Datta and Krishna Singh
Economics, Burdwan University, West Bengal, India
days the rural economy is not based solely on agriculture but relies on a diverse array of activities and enterprises. This aspect is taken account of by recent evolution of the concept of livelihood diversification as a survival strategy of rural households in developing countries and stabilize their incomes. It is now well recognised that peoples’ ability to engage in supplementary (and often better rewarding)
agricultural activities is often governed by their relative a diversity of asset base. Access to this diverse form of assets
is influenced by a complex web of socio- economic as well as geographical environment in the concerned region. It is notable that access to different types of assets and socio-economic factors, gives rise to differences in skill formation and income generation opportunities. In this backdrop, an analysis has been made pertaining to the issues of livelihood and diversification strategy followed by people in two very backward regions in W.B in India with different geographic and socio
economic features. Greater divergences/uniformities in socio-economic status, outlook, opportunities and push and pull factors explain
insignificant difference in various parameters of
ification across the study areas.
Again apart from channeling huge investments in infrastructure developments like housing, roads and communication, the Govt. has also passed legislation for providing benefit to rural people. For instance with the introduction of ‘Right to Information Act’ the Govt. has been made accountable to the public in general in regard to provisioning of information related services. Thus under universal service obligation, each village has the right to clamour for installation of village public telephone with maintenance facilities. However village community or civil society organization has often been unaware of or apathetic ternational Journal of Current Research
51, February, 2011
INTERNATIONAL JOURNAL OF CURRENT RESEARCH
to such provisions unlike similar organizations in urban centers. This has resulted in a gradual widening of the gap in rural- urban provision and
access to infrastructural facilities with a
concomitant weakening impact on rural peoples’ capability and access to better livelihood prospects. So the recent focus has been on the asset- process– activity framework. From the perspective of Sen’s analysis, the emphasis is put on the aspect of broadening the capability of rural people which leads to better access to assets and hence generation of activity and tempo of sustainable income. However there often exists sort of socio-economic inertia in rural areas that inhibit the process of better capability in terms of adoption of higher education and health service facilities. It is often said that rural sector is rigid and lacks in dynamism and adaptability to restructuring strategies. The long term perspective involved in the issue of promoting improved human capital often induce rural people to seek for quicker avenues for broadening their income bases. The short term solution for poor households in rural regions seems to be embedded in their adopting a diverse set of income yielding activities. But when pursued prudently, these activities may turn to be income generating on a sustainable basis with cumulative addition to asset base.
The farm sector although viewed as the safe and secured arena for absorbing a huge chunk of rural people, has a limitation as is evinced in the emergence of disguised unemployment and low productivity. In developing countries like India, the mindless application of fertilizers and pesticides in the eve of green revolution has seriously destroyed the fertility and productivity of soil. Hence the scope of increasing real income of farmers and bringing sustained improvement in their well being, solely through farming operations is seriously constrained. There is concern on the incidence of deep rooting of poverty amongst the households depending on single income from farm
activities (WYE Group, 2007). However mere
stress on the issue of poverty is rather narrow as it covers only some static aspects like low income, poor nutrition level etc without putting focus on
issues like vulnerability, poor capability etc. The
concept of Sustainable Livelihood (SL) is an attempt to capture the dynamic issues relating to
emerging out of poverty traps and it seeks to go beyond the conventional approaches to poverty eradication. Chambers and Conway (1992) proposed the following composite definition of a sustainable rural livelihood, which is applied most commonly at the household level: A livelihood comprises the capabilities, assets (stores, resources, claims and access) and activities required for a means of living: a livelihood is sustainable which can cope with and recover from stress and shocks, maintain or enhance its capabilities and assets, and provide sustainable livelihood opportunities for the next generation; and which contributes net benefits to other livelihoods at the local and global levels and in the short and long term. A somewhat modified definition was propounded by Ian Scoones (1998) of IDS, while he defines a livelihood as sustainable when it can cope with and recover from stresses and shocks, maintain or enhance its capabilities and assets, while not undermining the natural resource base. As an approach to understanding and facilitating rural development the ‘sustainable livelihoods approach’ captures the concern about food and nutrition security, income security, heath and education security as well as security of shelter and water resources. This is in conformity with a shift in stress from a materialist perspective focused on food production to a social perspective which
focuses on the enhancement of people’s
capabilities to secure their own livelihoods (Drinkwater and Rusinow, 1999).
are either to engender peoples’ capability though access to provision of better education, vocational training and health care services or to ensure sustainable asset creation through broadening access to easy credit and its effective productive utilization or a combination of both. Now a day the rural economy is not based solely on agriculture but relies on a diverse array of activities and enterprises. This aspect is taken account of by recent evolution of the concept of livelihood diversification as a survival strategy of rural households in developing countries and stabilize their incomes (Ellis, 1999). Diversification into the non-farm areas can be broadly categorized into the following heads: income from service related
activities, income from production related
activities, income from trade and that from remittances. It is now well recognised that peoples’ ability to engage in supplementary (and often better rewarding) nonagricultural activities is often governed by their access to a diversity of
asset base (Reardon, 1997); (Baker, 1995), (El Bashir, 1997) and (Tacoli, 1998). The asset
base encompasses a variety of forms like physical, human, natural, social and financial. Access to these diverse forms of assets is influenced by a complex web of socio-institutional as well as politico- economic environment in the concerned region. It is notable that access to different types of assets gives rise to differences in skill formation and income generation opportunities. Thus the earning potential from asset base requiring simply application of physical labour may not be at par with that requiring some amount skill and mental application as well. So people with low access to asset and devoid of any skill are likely to resort to
wider diversification to supplement their
subsistence level earnings. Further similarity in socio-economic features and access to asset in different villages with similar locational facilities is likely to lead to insignificant differences in the levels of diversification.
Hence we may proceed with the hypotheses that
(a)Average income diversity is higher in
households who have relatively less capital asset than labour and who are not trained in any specific area of occupation.
(b)Higher the differences in asset base and
socio-economic features across households in different locations, greater is the difference in the levels of diversification.
In this context the objectives of the analysis are
(a)To focus on the factors explaining the levels
of household diversification across the study villages.
(b)To investigate the effect of income
diversification index and other factors explaining individual income earnings across the study region.
(c)To analyse whether villages with different
socio-economic characteristics differ with respect to parametric values of diversification indices.
Opportunities are governed by factors like villagers’ awareness and availability of adequate income yielding jobs, endowment of local inputs / resources matched by corresponding rural skills and training, communication and marketing facilities etc. Broadening of education and health facilities with proper infrastructural support and ensuring their employment is basic to the empowerment of people, while security of employment and earning opportunities integral to the food security issue marks the importance of non-farm diversification. In India farm income earning prospect, especially for poorer households, still remain a gamble on monsoon and hence arises the importance of alternative jobs that can somehow enable the maintenance of at least the subsistence level earnings.
Data and Methods
In this backdrop, it seems imperative to analyse the issues of livelihood and diversification strategy followed by people in two very backward regions in W.B covering selected villages in the districts of Purulia and Bankura. For the purpose of study, two villages were selected in each of these districts. The study is based on entirely primary data collected from field survey. For the purpose of collection of data a mix of convenience and random sampling was adopted. Since at the time of survey, some households were not available (being away for work as migratory labour), we had to accordingly adjust our visit to houses marked by presence of household heads. The number of households covered in each of the villages figured round a size of 50. Thus altogether 107 households were covered in the 2 villages in Purulia while the corresponding figure in the context of Bankua district stands at 97.
Detail information were collected from each surveyed household about the family size, no of active workers, ownership of farm and non-farm asset, receipt of remittance from family members working elsewhere, beneficiary of social security schemes, amount of loans, caste etc. Apart from this, data about age, education, gender , migration features, occupational status and income earned from a diversity of occupations across the individuals in the family were also collected.
On the basis of analysed data, it is found that across the four villages the exhaustive set of farm and non-farm occupations can be categorized in the following dimensions.Farm sector encompasses categories like agriculture, livestock rearing and agricultural wage labour while non-farm income sources covers areas like service, business sector, migration / remittances, non-farm wage earnings and CPR related income.
Household livelihood diversification is measured by using the inverse of Hirchman-
Herfindahl (HH) index in the form 1 /Aij2 where
Aij represents the contribution of each activity j to
household i’s aggregate income. Since HH index is a measure of concentration, its inverse is supposed to indicate the relative spread of activities in contributing to total income. The less the value of HH index the greater is the measure of diversification and vice versa. The minimum possible value of the inverse is one when all income is obtained from one activity and maximum possible value equals the number of activities when there is equal contribution from each activity (Ellis, 2000). Since migration is considered as a diversification strategy and remittance by migrated family members adds to household income, it is recognized in the non-farm category. Again as villagers often collect CPR products for self consumption and sale for supplementing their livelihood, both are considered in CPR related income category, with imputed values for self consumption figures. Operational holding are divided into different size groups and across the activities to focus on the income-contribution of specific activities for different land holding groups. Multiple regressions is fit to explain household diversification indices on the basis of some logically hypothesized variables and its overall significance. ANOVA analysis is done to test the equality of mean and variance of household-diversification indices across the villages. Apart from this, the same measure of HH index is applied to indicate how diversified individuals are within
the same household. In this case Aij represents the
Background of the Study Villages
The two villages studied in Purulia district are Chitmu and Guridih located in the Jhalda block. These villages are situated at very remote areas
with very poor road connectivity and
communication facilities. Aside from a few general caste and muslim families, there exists dominance of OBC and ST people here. Most of the villagers are small or marginal farmers with complete dependence on rainfall. There hardly exists any irrigation facility and hence soil quality is rather low in terms of productivity. Both of these villages suffer from acute scarcity of water in summer. Having been located at a substantial ill-accessible distance from urban centers, there hardly exists good opportunities for alternative jobs through creation of assets for the residents here. Whatever alternative non- farm jobs are available, require little skill or productive assets on the part of the mostly low literate villagers. Accordingly non- farm assets found here are mostly non – productive in the form of cycle, motor cycle, TV, mobile etc. This lack of sound and sustained employment opportunities has led to some desperately risk-loving people pursuing migration to other states for earning a livelihood. Good railway links from nearest Kotsila or Pundag station to places like Bokaro, Dhanbad Ranchi etc in Jharkhand region, acts as an incentive for such migration. Apart from this, there are some agents in Jhalda, who act as linkmen in moving people out of these villages to outside states in getting alternative jobs.
In Bankura district the villages selected for analysis are known as Domnisole and Benechapra, which are located in Joypur block. Domnisole is not far off from metal road, with a moderately developed transport and communication facility. All the 48 villagers residing here belong to SC category with a distinct form of backwardness. The villagers here are extremely poor with only a few families having little amount of land. Majority are agricultural wage labourers, having little education and hardly any skill and training to do specialised jobs. They usually migrate to nearby villages twice a year for getting works as wage labour, each phase of work spanning over about 15 to 30 days. Due to lack of education and communication skill and link- intermediaries like work agents, people here
are averse to migrate to other states. The village is surrounded by dense forest which provides CPR based wherewithal to a large number of village people. Many people here directly depend on the forest resources for earning almost every part of their livelihood. Preparation and sale of leaf plates by collecting and stiching sal leaves, or sale of fuel woods happen to be the important occupations in protecting from the onslaught of dire poverty. Forest dependence assumes extreme form when the people feel deprived of locating opportunities of getting emploed. In times of necessity loan are taken mostly from moneylenders or farmers. Besides this, sometimes loans are also obtained from grocers and it is repaid by providing agricultural labour on his land without payment. These loans are mostly unproductive being utilized either for self consumption, disease treatment, daughters’ marriage etc. Again non- farm asset here also are mostly non –productive in the form of mobile phones, radios, cycles etc. Hence in the absence of tangible productive asset creation, the villagers’ condition remains largely static over time.
Broad Features of Diversification
The Table 1 above shows the percentage distribution of sample households in the 4 study villages according to different categories of their adopted occupational features. The fact that diversification in varying degrees, has become an important instrument of earning a livelihood becomes evident from the above Table. In order to focus on the issue of diversification we categorise the households for purposes of expositional convenience into three broad categories (i) households that solely depend on farming (ii) households that adopt both farm and non-farm activities and (iii) households having only non-farm occupations.
Table 1 suggests that pure farm dependence is rather on a lower side in all the villages. There is substantial dependence of the households on non-
farm activities in combination with farm
occupations as this combined figure appears to be 62.26%, 83.33%, 89.58% and 73.47% respectively for Chitmu, Guridih, Domnisole and Benechapra. If pure non-farm as well as the aforesaid combined
dependence is clubbed together then the
[image:6.504.86.418.76.214.2]percentages stand respectively as 92.44, 88.89, 89.58 and 79.59, thus establishing the importance of diversification into non-farm sector for livelihood purpose. The figures however indicate that in Domnisole, there is no household having only non-farm occupation.
Table 1. Percentage Dependence of Sample Households on Farm and Non- Farm Sectors
Village Name
Chitmu Guridih Domnisole Benechapra
Percentage of Household With Only Farming 7.55 11.11 10.42 20.41
Percentage of Household With Farming and One More Occupation
45.28 44.44 62.50 48.98
Percentage of Household With Farming and Two More Occupations
15.09 37.04 27.08 20.41
Percentage of Household With Farming and Three More Occupations
1.89 1.85 0.00 4.08
Percentage of Household Without Farming and Only One Occupation
20.75 5.56 0.00 4.08
Percentage of Household Without Farming and Two Occupations
[image:6.504.75.436.450.657.2]9.43 0.00 0.00 2.04
Table 2. Percentage of Income Across Size Group of Operational Land Holdings in Terms of Bigha (Domnisole and Benechapra)
0 0.1 – 1.99 2 – 2.99 3- 3.99 4 and above
Dom Bene Dom Bene Dom Bene Dom Bene Dom Bene
Crop production 0 0 1.69 11.11 5.93 13.45 0 27.49 0 39.41
Agg-labour 30.21 27.74 28.2 28.16 48.37 13.33 0 27.33 0 22.16
Livestock 2.07 3.64 10.8 7.48 3.98 2.65 0 4.18 0 4.11
Total 32.28 31.38 40.69 46.75 58.28 29.43 0 59.00 0 65.68
Service 0 4.68 0 0 0 21.53 0 0 0 0
Wage-labour 9.1 13.78 7.2 5.58 0 0 0 13.38 0 7.26
Migration 7.82 3.83 3.91 6.62 0 3.97 0 0 0 0
Business 0 2.75 0 0 0 20.06 0 0 0 8.45
CPR Income 50.8 43.58 48.2 41.05 41.72 25.01 0 27.62 0 18.61
Households falling in category (ii) have been further classified into different groups depending on the number of non- farm activities that they pursue together with farming activity. A great majority combine one non-farm job with farming job, while some combine two non- farm activities and a few combine three such activities together
with their traditional farming occupation.
Households without farming activity adopt either one or two non-farm jobs. It is interesting to find that in neither of the study villages percentage of households depending solely on farming activity exceeded 20% of the surveyed number. In case of Chitmu and Guridih in Purulia region, the percentages are only 7.55 and 11.11 while in case of Domnisole and Benechapra in Bankura region, the figures are respectively 10.42 and 20.41. Land quality in Chitmu is extremely poor and hence such meagre dependence on farm sector alone. Majority of the households however seek to combine agricultural job with one non-farm activity in all the study regions, the respective percentages being 45.28, 44.44, 62.5 and 48.98 for the aforesaid villages. The percentage of people diversifying into two non-farm activities together with farming job is also not negligible with the figures being respectively 15.09, 37.04, 27.08 and 20.41. However there are few households who combine three activities with farming job. Since farming involves a great deal of their available working time, most of them can manage to combine either one or two non- farm jobs for earning a livelihood. The percentage of people without farming and adopting either one or two non -farm jobs is rather low in all the sample villages excepting Chitmu where people take to migration or service related jobs.
The villagers in the surveyed villages were also classified according to size group of operational holdings. The incomes of the villagers were arranged in a disaggregated form into farm and
non-farm sectors, matched with classified
operational holding group. Further sub-sector classification was also done for each of the major two sectors. Thus as mentioned earlier , we consider three farm based sub-sectors like crop production, agricultural labour and live-stock rearing and five non –farm based sub-sectors like service, wage labour, migration, business and CPR
income. The villagers were classified according to
the following groups of operational holdings
(bigha) (i) 0.00 (ii) 0.1 – 1.99(iii) 2 – 2.99 (iv)
3- 3.99 (v) 4 and above. In Domnisole there is no household belonging to the last two groups and so the corresponding columns are left blank. Barring exceptional cases, the table reveals the increasingly significant contribution of non-farm income towards maintaining livelihood of people falling in landless and marginal groups. This is mainly due to rather increased livelihood contribution of CPR activities at lower land holding classes. In case of Domnisole, the contribution of non-farm sector is higher at lower land holding groups and gradually lessened as the household’s operational holding status rises. In case of Benechapra also, with the exception of group (iii), non-farm share in income of the villagers gradually declined from 68.62% to 53.25% to 41% and 34.32% alongside upgraded holding status for groups (i), (ii) (iv) and (v) respectively. A good number of people falling in group (iii) however have diversified in service and business related activities leading to an increased share of non- farm income. In case of Chitmu also with the exception of land holding size group, 4 and above the share of non-farm sector gradually goes on diminishing as the holding size rises. The possible reason is the increased earning source from agriculture related activities as ownership holding increases in size. At the highest size-group, affluence of people presents increasing educational opportunities and accordingly a sizable number of them take to service and business related occupations. This raises the non-farm share to about 87.49% for the biggest size group compared
to the immediate previous group.
Regression Analysis for Household Diversification
Household livelihood diversification (HHLD) is likely to be on a wider scale with increase in the number of working hands. When the number of such workers is large there is likely to be a variation in skill and degree of liking for traditional farming activities among the members. Hence some may opt for pursuing traditional farming or
related occupation while other relatively
farm areas. The risk of failure from a single activity based income is thus minimized. So with increased number of working members in the family it is expected that there would be positive relation with diversification in occupations.
Age (AGE) is also an important factor determining the level of diversification. At younger ages people usually have high zeal and aptitude to learn and pursue diverse occupations and are relatively agile in shifting from one occupation to other in non- farm sector. At this earlier ages, they are relatively dynamic in order to try their luck in a number of non- farm jobs while gradually narrowing down their choice as experience rises. With increasing age after a certain time, people become more specialized and with repeated application develop liking for specific areas of job. Hence the extent of diversification is likely to be negatively related with average age of workers. Level of education (EDU) reflected in average years of schooling, is also supposed to be an important factor influencing villagers’ orientation towards adopting a diversified portfolio of activities. As education rises, awareness about potential employment and earning from different nontraditional areas also increases amongst people. Besides with rise in education, link with urban sector gets enhanced and scope of training and acquiring skill widens thus furthering the likelihood of getting employment in high end non farm sector with possible entry barriers. All these imply that higher education level is supposed to lead to a positive linkage with diversification outcome.
The relationship between loan and
diversification in non-farm jobs is rather
ambiguous. Usually there are two sources of loan, formal with a relatively lower interest and informal with a rather higher interest. Presence of potential formal credit usually drives people to take loan in case of staring self business or enterprises. But in its absence, high interest bearing informal credit usually saps peoples’ drive to undertake a risky diversified form of activity, be it business, traveling expense for migration to outside states or SHG related activity in diverse form of crafts or services. On the contrary with rise in informal loan often incurred for defraying medical expenses,
daughters’ marriage or specific family
consumption purposes, the yearning for a diversified income generating activities is likely to be lessened. Hence with formal loan there is likely to be a positive linkage with diversification while negative relation in case of informal loan sources.
Access to non- agricultural asset values (NAAV) are also likely to cater to peoples’ aptitude and capability to take to diversified mode of activity and accordingly a positive relation is the expected outcome. However in case these assets constitute mostly unproductive assets providing recreational facilities, younger generation of people attracted by such recreational service are often likely to grow averse to diversify their activities. Thus there is likely to be a negative association between non performing non - farm assets and diversification.
Livestock (LV) are usually linked with farming activities. With an increase in livestock sizes and their values, it is expected that they will either be utilsed in more intensive farming activities or the increased income earned from a larger livestock might lessen the drive to higher diversification status. Consequently there is likely to be a negative relation between livestock size and diversification status. In village spheres social status of a family is often reflected in its caste position. The backward castes like SCs and STs often have poor rights to land holding and other agricultural assets. In order to cope with reduced access to farm income
opportunities these poor backward caste
households are likely to diversify more to non- farm sector compared to general caste families. When caste is considered as a dummy variable with value (o) for SCs and STs and value (1) for general caste people, there is expected a negative relation between caste and level of diversification.
The following model is used for OLS regression
HHLDi = a0 + a1 (WORKERS)i + a2 (AGE)i + a3 (EDU)i +a4
(LOAN)i + a5 (CASTE)i + a6 (NAAV)i + a7 (LV)i + a8 (SB)i + ei.
Explanation of Regression Results
[image:9.504.31.476.127.335.2]The regression results in table-4 facilitate the testing of the hypothesised signs of the explanatory variables and their significance as well as overall
Table 3. Percentage of Income Across Size Group of Operational Land Holdings in Terms of Bigha ( Chitmu and Guridih)
0 0.1 – 1.99 2 – 2.99 3- 3.99 4 and above
Chit Gur Chit Gur Chit Gur Chit Gur Chit Gur
Crop production 0 0 8.45 6.89 11.65 13.86 22.94 7.75 9.29 9.95
Agg-labour 12.31 10.08 7.72 5.08 10.66 4.70 4.65 0.79 0.82 1.32
Livestock 2.26 2.24 4.16 2.29 3.66 4.16 6.22 2.30 2.39 2.55
Total 14.57 12.32 20.33 14.26 25.97 22.75 33.81 10.84 12.51 13.81
Service 0 67.23 12.17 27.02 14.64 0 46.68 29.93 70.81 32.90
Wage-labour 20.84 0 13.15 6.04 8.88 10.45 15.56 0 1.04 4.93
Migration 30.86 0 35.49 34.12 24.20 49.98 0 20.95 4.73 30.26
Business 18.09 0 5.33 8.32 13.86 8.08 0 22.44 9.02 16.45
CPR Income 15.64 20.45 13.53 10.23 12.45 8.78 3.94 15.84 1.89 1.63
Total 85.43 87.68 79.67 85.74 74.03 77.25 66.19 89.16 87.49 86.19
Table 4. Regression Results of Household Livelihood Diversification (HHLD)
Villages 1
Chitmu
2 Guridih
1& 2 Combined
3 Domnisole
4 Benechapra
3& 4 Combined
Explanatory Variables
Total workers (WORKERS)
.149**** (1.36)
.132 (1.139)
.212* (2.742)
.563* (9.099)
.490* (5.535)
.642* (18.718) Avg. workers age
(AGE)
-.024*** (1.629)
-.02*** (-1.669)
.0002 (.023)
-1.403* (-9.456)
-1.322* (-6.566)
-1.668* (-21.041) Avg years of schooling
of workers (EDU)
-.0184 (-.534)
.044 (.532)
-.026 (-.867)
.025 (.773)
.017 (.409)
.007 (.442) Amount of loan
(LOAN)
-.00001 (-1.24)
.000001 (.145)
-.00001 (-1.135)
.000005 (.236)
-.000002 (-.402)
-.000005** (-2.039)
CASTE .281
(.796)
-1.057* (-2.855)
-.000002 (-.285)
-- -.320****
(-1.454)
-.131 (-1.218) Non agr. asset value per
worker (NAAV)
-.00003*** (-1.886)
-.00002*** (-1.866)
-.00001 (-.972)
-.00008 (-.67)
.00001 (.467)
.00002**** (1.55) Livestock value per
worker(LV)
-.00009*** (-1.566)
.00003 (.985)
-.00002** (-2.089)
-.00008 (-1.071)
.0001** (2.258)
.00005** (2.042) Scheme Beneficiary
(SB)
.097 (.371)
-.203 (-.552)
.215 (1.076)
-.04 (-.462)
.220**** (1.457)
.078**** (1.495)
Dummy -.149
(-.732)
-.072**** (-1.281)
R2 .33 .349 .202 .702 .661 .871
F 2.645* 3.016* 2.693* 13.439* 9.749* 65.009*
(Figures in parenthesis indicate t values); *, **, ***, and **** indicate level of significance at 1 , 5 , 10 and 20 percent respectively;
[image:9.504.60.451.380.605.2]significance. Although R2 value is not very high , it is observed that for all the regions the regression equations are good fit as vindicated by the value of F - statistic and its level of significance. This is in conformity with the arguments of Pindyck and Rubinfeld when they stress that where the cross
section data are involved, a lower value of R2 may
result even if the model fit is satisfactory because of wide variability of cross section observations. In case of village Chitmu, it is observed that the variables like WORKERS, AGE, LOAN, NAAV and LV have signs as expected while that of EDU, CASTE and SB go in the reverse direction. However four of the variables having expected signs viz WORKERS, AGE, NAAV and LV appear to be significant at varying degrees. In case of village Guridih, the variables WORKERS, AGE, EDU, CASTE, NAAV and SB conform to their expected signs and out of these AGE, CASTE and NAAV emerge as significant contributors to overall variation. In case of combined regression of these two villages the variables having expected signs are recorded as WORKERS, CASTE, NAAV, LOAN and LV with the first and last emerging to be significant.
In case of village Domnisole, it is found that all the considered variables except LOAN conform to their expected signs with a significant variation coming from variables like WORKERS, AGE etc. Almost similar result is recorded in case of village Benechapra where only LV (although significant but not meeting the expected sign) and quite a number of variables help explain significant overall variation. In some cases higher the level of livestock, greater may be subletting of those to other members in the village to earn some income. This provides the villagers scope for diversification into increased number of activities and hence the positive sign.
ANOVA Results for the Household Diversification Indices
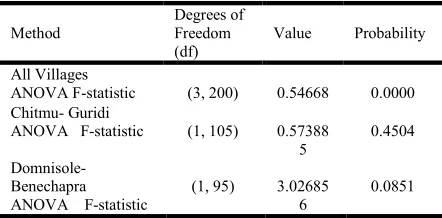
Mean diversification indices on the basis of sample data for the four villages corroborate the hypothesis. The relatively asset poor villages like Domnisole (2.45) and Benechapra (2.69) exhibit higher diversification indices compared to asset
rich villages like Chitmu (2.07) and Guridih (1.95). The computed diversification indices for the sample respondents in each of the considered villages provide scope of testing the equality of the mean indices across the 4 villages as well as pairwise equality for the indices in villages located in different geographical regions. ANOVA results for equality of means as revealed by the F -value from the following Table 5 suggest that there is
significant difference in mean level of
diversification across the different locational pattern of the villages in the two districts. Further the difference among variance figures for the diversification indices in the four villages also turns out to be significant, as revealed in table- 6, by all the three methods (Barlett, Levene, Brown- Forsythe) implying that there is great difference in the patterns of diversification to non-farm jobs across the villagers in the concerned villages.
This may be attributed to some of essential features of differences in the sample villages in Purulia and Bankura district as mentioned below. Villages in Purulia suffer from scarce drinking water problem, which assumes acute form during summer. Here communication facility is in very poor form and metal road can be said to be almost nonexistent. Quality of land is rather poor as mono-cropping is somehow carried on in the absence of irrigation facility. There is observed an increasing tendency among people in these villages to migrate to other states in search of a viable livelihood. Average level of education is rather on a higher side and so people usually are not afraid of getting duped with at the hands of agents facilitating migration job. There are quite a good number of service holders and businessmen in these areas who also happen to be owners of substantial land holding size. This leads to somewhat greater average land holding size in these region compared to that in Joypur block of Bankura. SHGs here are rather active and the women here are better engaged in SHG activities and are aware of the importance of childrens’ education.
in nature having the benefit of being under the purview of irrigation. People here are rather averse to migration to other states as most of them are afraid of staying away from home for long period despite having little income earning alternatives. This is partly accounted for by their relatively
lower average educational status compared to that in Purulia side. The SHGs here are mostly in dormant form with the apathy of local stakeholders and inefficient monitoring and support by local Govt. Hence possibility of diversification to viable farm and non- farm jobs assumes great importance.
However if we consider pair wise villages in similar geographical locations as displayed in Table 5, we interestingly find that while the difference in mean level of diversification across Chitmu and Guridih is insignificant, that is not so in case of Domnisole and Benechapra (it being significant at 8% level) despite their geographical proximity and similar sort of soil quality. Similar results also hold for test for difference between the variance of diversification indices across the aforesaid pair-wise villages as is evident from Table 7. The insignificant difference in mean diversification indices in the two villages of Purulia may be said to be accounted for by similar average education status, soil quality, mean land-holding size and non-farm asset as is evident from table-8. However despite locational proximity and similar soil features, there is observed significant difference in mean diversification across the two villages in Joypur block. This may be attributed to highly differing mean educational status, skewed mean land ownership and divergent ownership to non- farm assets as shown in table 8. Greater uniformity in socio-economic status, outlook, opportunities and push and pull factors explain insignificant difference in the variance for villages in Jhalda-II block unlike that in case of Joypur.
Effects of Diversification on Individual Income
In this section the effect of individual
diversification and other socio-economic
characteristics on individual income are analysed. The regression fit is of the following form
IND. INCOMEi = a0 + a1 (INDVI)i + a2 (EDU)i +a3 (AGE)i + a4 (GEND)i + a5 (ADULTS)i + a6 (OCCU)i + a7 (SQ AGE)i + a8 (DUMMY)i + ei
Here gender (GEND) is a qualitatitive variable assuming value 1 for males and 0 for females. Occupation (OCCU) is also a qualitatitive variable, equal to 1 if individual earns maximum percentage of income from farm occupation , while it is zero if he earns major percentage from non-farming jobs. It is hypothesized that the efforts exerted by individuals in maintaining diversified jobs leads to better income earning opportunities through
partaking in off-farm season employment i.e. a1>0.
[image:11.504.27.248.147.256.2]Here INDVI indicates individual diversification index. On the basis of results of some other related Table 5. ANOVA Result for Equality of Mean Test
Method
Degrees of Freedom (df)
Value Probability
All Villages
ANOVA F-statistic (3, 200) 0.54668 0.0000
Chitmu- Guridi
ANOVA F-statistic (1, 105) 0.57388
5
0.4504
Domnisole- Benechapra ANOVA F-statistic
(1, 95) 3.02685
6
[image:11.504.32.243.281.346.2]0.0851
Table 6. ANOVA Result for Equality of Variance Test
Method Degrees of
Freedom (df)
Value Probability
All Villages
Bartlett 3 16.74650 0.0008
Levene (3, 200) 4.312893 0.0057
[image:11.504.28.248.375.536.2]Brown-Forsythe (3, 200) 3.346777 0.0202
Table 7. ANOVA Result for Equality of Variance across pair-wise Villages
Village Domnisole- Benechapra
Degrees of
Freedom (df) Value Probability
F-test (47, 48) 2.811004 0.0005
Siegel-Tukey (1, 95) 4.442171 0.0377
Bartlett 1 11.98862 0.0005
Levene (1, 95) 8.213885 0.0051
Brown-Forsythe (1, 95) 8.010234 0.0057
Village Chitmu- Guridih
Degrees of Freedom (df)
Value Probability
F-test (53, 52) 1.270449 0.3893
Siegel-Tukey (1, 105) 0.074507 0.7854
Bartlett 1 0.743666 0.3885
Levene (1, 105) 0.599640 0.4405
studies it is expected that education measured by years of schooling (EDU) has positive impact on
income a2 >0, age has U- shaped impact on
earnings i.e. a3 > 0, a7 < 0; males are assumed to
earn more on an average than females i.e. a4 >0 ;
The variable ADULTS implies members more than 14 years of age, excluding the individual under
consideration in a family. As number of such ADULTS increases, there is likely to be increased competition amongst members in the family for the same type of job and hence less earning
opportunities, accordingly a5 <0. It is expected
that individuals who report working mainly on farming activity would earn less than others whose major share of income is attained from varied type
of jobs in non–farm sector i.e. a6 <0.
Explanation of Individual Income Regression
The results in table-9 indicate that all the regressions are good fit. The impact of the variable INDVI, although mostly significant is however ambiguous. In cases of villages like Domnisole and Benechapra, this is of the expected positive sign,
while in the other cases it is just the reverse. Here possible reason is that the need to diversify is perceived to be less for enhancing income on the part of villagers with specific skill and dexterity.
[image:12.504.61.441.155.226.2]As expected, years of schooling and age have a positive significant impact on earnings in all the villages. Age squared, as expected reveals significant negative relation with individual income in each case indicating that after a certain age Table 8. Socio-Economic Features of the Households in the Sample Villages
Village No. of
Household Surveyed
Average No of Family Members
Average Education of Workers
Value of Farm Asset per Household
Value of Non-farm Asset per Household
Land Holding per Household (Bigha)
Chitmu 53 6 3.46 47.16 4929.28 1.79
Guridih 54 5.57 2.42 359.25 5834.26 1.67
Domnisole 48 5.39 0.04 0 1080.21 0.140
Benechapra 49 5.24 1.73 1989.79 2579.59 0.78
Source: Field Survey
Table 9. Regression Results of Individual Income
Explanatory variables Villages 1 Chitmu 2 Guridih 1& 2 Combined 3 Domnisole 4 Benechapra 3& 4 Combined
INDVI -.083
(-1.004) -.098**** (-1.285) -.091**** (-1.601) .392* (5.253) .352* (4.819) .463* (9.265)
EDU 0.298*
(3.466) .363* (4.066) .334* (5.290) .131** (2.038) .197* (2.651) .148* (2.860)
AGE 0.601***
(1.633) .710** (1.833) .624* (2.375) 1.258* (4.254) .969* (2.867) .101**** (1.519)
GEND 0.043
(0.433) .041 (.437) .034 (.489) .008 (.123) .063 (.878) .046 (.937)
ADULTS -0.020
(-.256) -.132*** (1.822) .021 (.392) -.264* (-4.476) .018 (.268) -.109** (-2.292)
OCCU -.166**
(-1.851) -.250* (-2.906) -.185* (-2.926) -.041 (-.684) -.030 (-.431) -0.014 (-.281)
SQ Age -.418
(-1.140) -.647*** (-1.730) -.467*** (-1.781) -1.035* (-3.671) -.889* (-2.771) -.021 (.262)
DUMMY -.140*
(-2.498)
-.022 (-.297)
R2 .212 .363 .238 .468 .234 .267
F 5.078* 10.954* 10.592* 19.868* 7.598* 15.463*
(Figures in parenthesis indicate t values); *, **, ***, and **** indicate level of significance at 1 , 5 , 10 and 20
[image:12.504.71.429.259.476.2]people tend to be less agile and lover of sedentary jobs. Gender has the expected positive sign for all cases, although not significant. There is expected negative significant impact of the variable ADULT on individual income in most of the cases. The variable OCCU, as assumed, has negative impact on individual earnings in case of all the villages but is significant only in case of Purulia district. Overall, thus most of the regression coefficients help explain the income earning figures as per the expected sign considerations.
Conclusion
Household level diversification in the four villages of the study area appears to be rather moderate. It is basically governed by the extent of alternative non-farm opportunities in the neighbourhood, socio-economic features of the villagers, their access to credit, assets and Govt. benefit schemes. It is important to note that alternative job prospects is influenced by acquired diversified skill as well as training facilities in the adjoining region, availability of access roads to market , level of literacy and awareness of the villagers about the prospective benefits they are entitled to through Panchayat provisions. Differences in the level of diversification across households is accounted for by dissimilarities in socio–economic attainments, differential access to assets and available diversification opportunities as a form of insurance to guard against uncertain income shocks. Individual earnings again, are influenced by the extent of diversification, occupational weightage of non–farm/ farm sector, education, age patterns etc. Policies to extend systematic skill and training opportunities with attendant extension of formal credit facilities spread of awareness of individual rights and opportunities and extension of marketing facilities through betterment in the condition of access roads, village haats etc as well as role of
motivating agents would go a long way in removing the barriers towards diversification.
REFERENCES
Baker, J. 1995. Survival and accumulation strategies at the rural-urban interface in
Northwest Tanzania. Environment and
Urbanization., 7(1): 117-132.
Robert, C. and Gordon, C, 1992. Sustainable rural livelihoods: practical concepts for the 21st century IDS, IDS Discussion Paper No 296 Drinkwater, M. and Rusinow, T. 1999.
Presentation on CARE’s Livelihood approach. NRAC
Ellis, F. 1998. Household strategies and rural
livelihood diversification. Journal of
Development Studies, 35(1): 1-38.
Reardon, T. 1997. Using Evidence of Household Level Income Diversification to Inform Study of the Rural Non farm Labour Market in Africa.
World Development., 25(5): 735-748.
Scoones, I. 1998. Sustainable Rural Livelihoods: A Framework for Analysis. IDS Working Paper, No.72.
Sen, A.K. 1981. Poverty and Famines: An Essay on Entitlements and Deprivation. Oxford: Clarendon Press.
Tacoli, C. 1998. Rural- urban linkages and sustainable rural livelihoods,. In implementing the sustainable rural livelihood approach in
Sustainable Rural Livelihoods: what
contribution can we make? Ed. Carney. D,
DFID, London:67-82.